Abstract
Background & objectives:
Coagulation and haemostasis are dynamic processes. The haemostatic changes in liver disease affect all aspects of coagulation. The prothrombin time (PT)/international normalized ratio (INR) was developed to monitor oral anticoagulant therapy and the activated partial thromboplastin time to investigate inheritable single factor deficiencies. Viscoelastic tests such as thromboelastogram (TEG) give information about dynamics of clot formation (coagulation factor and anticoagulant activity), clot strength (platelets and fibrinogen) and clot stability (finbrinolysis and factor XIII). Administration of blood products before invasive procedures is still guided by INR and platelet count in patients of liver disease. This study was aimed to evaluate the validity of TEG to predict post-procedural bleed after central venous cannulation in patients with cirrhosis.
Methods:
Ninety patients aged 20-70 yr diagnosed with liver cirrhosis requiring elective central venous catheter (CVC) insertion were studied. Platelet count, INR, serum creatinine, TEG and Child-Turcotte-Pugh (CTP) score were recorded before the procedure. Right-sided internal jugular vein was cannulated. On the basis of presence or absence of post-procedural bleed, patients were divided into bleeding and non-bleeding groups. The CTP score, component of TEG (R - reaction time, K - coagulation time, MA - maximum amplitude and α - angle) and laboratory parameters of both the groups were compared.
Results:
Bleeding was seen more when CTP scores were ≥10 (P=0.05). The K time of 3.05 min or more on thromboelastograph was a significant predictor of bleeding [area under the curve (AUC) 0.694, P=0.047]. MA of 48.8 mm or more was a significant predictor of non-bleeding. INR ≥2.6 was a significant predictor of bleeding (AUC 0.765, P=0.005). K time had a low-positive predictive value of 20 per cent and the positive and negative likelihood ratios of 1.87 and 0.48, respectively.
Interpretation & conclusions:
Our results show that the cut-off value for INR ≥2.6 and K time ≥3.05 min predict bleeding and MA ≥48.8 mm predicts non-bleeding in patients with cirrhosis undergoing central venous pressure catheter cannulation.
Keywords: Bleeding, cirrhosis, international normalized ratio, K time, maximum amplitude, thromboelastogram
In patients with cirrhosis of liver, clinical and laboratory evidence indicates that the haemostatic system is in a ‘rebalanced’ state. Changes in the prohaemostatic pathways are balanced by changes in the antihaemostatic pathways1. This rebalanced state is far more precarious and potentially unstable as compared to the haemostatic balance in healthy individuals. It explains the potential of bleeding and thrombotic complications in these patients1. The usefulness of conventional tests in assessing the haemorrhagic risk and therapeutic strategies in patients with cirrhosis is debatable2,3. It is a common practice to prophylactically correct haemostatic abnormalities in patients with liver disease before invasive procedures by administration of blood products guided by the prothrombin time (PT) and the platelet count. Patients with liver disease have the greatest risk of transfusion-related lung injury as compared to other populations4. Major procedures such as liver transplant have been performed without administration of fresh frozen plasma despite the presence of an elevated international normalized ratio (INR)5. This is due to the fact that INR calculation does not take into account the concurrent reduction in anticoagulant levels in liver disease. Therefore, there is no consistent relationship between bleeding and mild to moderate increase in INR in chronic liver disease.
Thromboelastogram (TEG) monitors haemostasis as a dynamic process in the whole blood as compared to the isolated conventional coagulation screens6. It measures changes in clot tensile strength over time and gives information on the dynamics of clot formation (coagulation factor and anticoagulant activity), clot strength (platelets and fibrinogen) and clot stability (fibrinolysis and factor XIII). The plasma-based PT reflects the time lag for the initiation of polymerized fibrin gel formation after addition of tissue factor. In contrast, addition of platelets (whole blood) in the TEG affects the onset and rate of fibrin polymerization caused by platelet-mediated procoagulant reactions and platelet-fibrinogen interactions. It has been used to guide blood component therapy in different clinical situations including coagulopathic patients7. In this pilot study, the role of TEG was evaluated in predicting post-procedural bleed after central venous cannulation in patients with cirrhosis of liver.
Material & Methods
Ninety consecutive adult patients aged 20-70 yr, diagnosed with Child B and C cirrhosis requiring elective central venous catheter (CVC) insertion in critical care unit of Institute of Liver and Biliary Sciences, New Delhi, India, from April 2013 to December 2013, who consented to participate in this prospective observational study were included in the study. Patients with active bleeding, known local vascular abnormality or skeletal deformity or history of prior central vein cannulation and patients who did not consent to the procedure were excluded from the study.
The study protocol was approved by the Institutional Review Board Committee and written informed consent was obtained from all individuals participated in the study. The diagnosis of liver cirrhosis was based on available history, serologic testing, radiologic imaging and liver histology. The Child-Turcotte-Pugh (CTP) score of all patients was recorded.
Study parameters: Baseline laboratory investigations including platelet count, INR, serum creatinine and TEG were recorded within six hours before the procedure. TEG® was performed using kaolin as the activator. Measurement of TEG consisted of the following four variables: (i) Reaction time (R): Time from the start of the recording until the amplitude reaches 2 mm; (ii) Coagulation time (K): Time from the end of the reaction time until the amplitude reaches 20 mm; (iii) Maximum amplitude (MA): Maximum width of the TEG trace represents the absolute strength of the clot; and (iv) Angle (α): Formed by the slope from the R value to the K value.
Cannulation technique: Right-sided internal jugular vein (IJV) was cannulated using a landmark technique8. IJV was cannulated from the apex of the triangle between the sternal and clavicular heads of the sternocleidomastoid muscle under local anaesthesia. A 23-gauge finder needle was advanced through the skin at approximately 45° angle and in the direction of the right nipple. After aspiration of venous blood, the finder needle was used to guide the 18-gauge introducer needle. The CVC was inserted by the Seldinger technique9. Number of attempts taken to place CVC was also recorded. Electrocardiography, pulse oximetry and non-invasive blood pressure were monitored during the procedure. Post-procedure patients were nursed in head propped-up position and a chest X-ray was performed to rule out pneumothorax and haemothorax and to confirm the position of the catheter. Artery puncture was noted as forceful pulsatile expulsion of bright red blood from the needle. Pneumothorax was to be treated with tube thoracostomy if symptomatic or progressive or if more than 20 per cent of the interface between the lung and the chest wall was separated10. Arterial puncture, pneumothorax, haemothoarax and bleeding at the site of catheter insertion were recorded. The assessor was blinded to the study. Patients were observed for bleeding for six hours after insertion of the CVC. Bleeding complication was defined as bleeding requiring additional and non-expected haemostatic measures such as compression bandage for more than 15 min at catheter insertion site, blood transfusions and bleeding causing extension of hospital stay11. In the event of bleeding, the drop in haemoglobin concentration was monitored at every six hours inteval. INR >1.5 was considered abnormal7. The laboratory investigation results were defined as abnormal if those fell outside the established reference range of our hospital. Patients were defined as coagulopathic by laboratory parameters if platelet count <150,000 (beyond the reference range) or INR >1.511 or both and coagulopathic by TEG if coagulation index was less than -3. On the basis of presence or absence of bleeding complication, patients were divided into two groups, bleeding group and non-bleeding group.
Statistical analysis: Statistical analysis was done using Statistical Package for Social Sciences (SPSS) for Windows, Version 20.0 (SPSS Inc., Chicago, IL, USA). Descriptive statistics were calculated for all TEG variables (R, K, MA and α) and laboratory parameters (platelet count and INR). Proportions were used to describe discrete variables. Mean ± standard deviation was used for normally distributed continuous variables while median with interquartile range (IQR) for data if not normally distributed. The Chi-square (χ2) test was used to determine whether abnormal test results were associated with an increased risk of bleeding. The Chi-square test was also used to determine whether renal dysfunction represented by creatinine and severity of liver disease represented by CTP scores were associated with an increased risk of bleeding. Unpaired t test was used for comparing parametric data between groups and Mann–Whitney rank sum test for non-parametric data. Chi-square analysis and Fisher's exact test were applied as appropriate for comparing proportions between groups. Receiver operating characteristics (ROC) analysis was used for determining area under the curve (AUC) and cut-off values. Sensitivity, specificity, positive and negative predictive values of TEG and laboratory parameters were calculated.
Results
Of the 90 patients, 11 were in bleeding group, while the remaining 79 were in non-bleeding group. Five of the 11 patients required blood product transfusion. None of the patients had prolonged hospital stay due to complications of central venous cannulation. The demographic characteristics of both groups are presented in Table I. In 82 patients (91%), cannulation was performed with a single attempt whereas the second attempt was required in eight patients. Arterial puncture, pneumothorax and haemothorax were not observed in any of the patients.
Table I.
Comparative demographic variables and Child-Turcotte-Pugh (CTP) scores between bleeding and non-bleeding groups
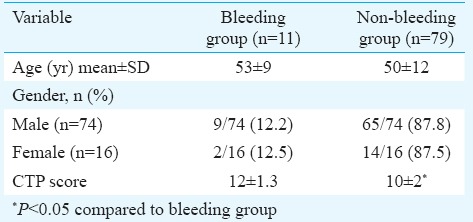
In 50 of the 90 patients, coagulation index on TEG was suggestive of coagulopathy. Of these 50 patients with abnormal TEG, 10 had bleeding (20%) (Table II), whereas among the remaining 40 patients with normal coagulation index on TEG, one patient developed bleeding. Eighty six of the 90 patients had evidence of coagulopathy according to the laboratory parameters (platelet count, INR), but only 11 of these 86 patients (12%) had bleeding. Bleeding was seen more when CTP scores were ≥10 (P=0.05).
Table II.
Cases of bleeding among patients with normal and abnormal laboratory results

The K time on TEG was a significant predictor of bleeding with AUC of 0.694 (Fig. 1) and (P< 0.05) (Table III). K time value of 3.05 min or more was found to have sensitivity and specificity of 70 and 62.5 per cent, respectively, for prediction of bleeding (Table IV). K time had a low positive predictive value of 20 per cent and the positive and negative likelihood ratios (LRs) of 1.87 and 0.48, respectively (Table IV). MA (in mm) was a significant (P<0.05) predictor of non-bleeding (Table III). The AUC for predicting non-bleeding was 0.719 (Fig. 2), with P=0.029. MA value of 48.85 mm or more was found to have a sensitivity and specificity of 68 and 64 per cent, respectively, for predicting non-bleeding (Table V). The positive and negative LRs for MA were 1.87 and 0.50, respectively (Table IV). Among the laboratory parameters, only INR was a significant predictor of bleeding with AUC of 0.765 (Fig. 3). INR value of 2.6 or more had a sensitivity and specificity of 72 and 74 per cent, respectively (Table V). Non-parametric Spearman's correlation of INR with R time showed a correlation coefficient of 0.22 (P=0.036). This showed a non-significant correlation between INR and R time. No significant association was seen between renal dysfunction and incidence of bleeding in the study patients.
Fig. 1.
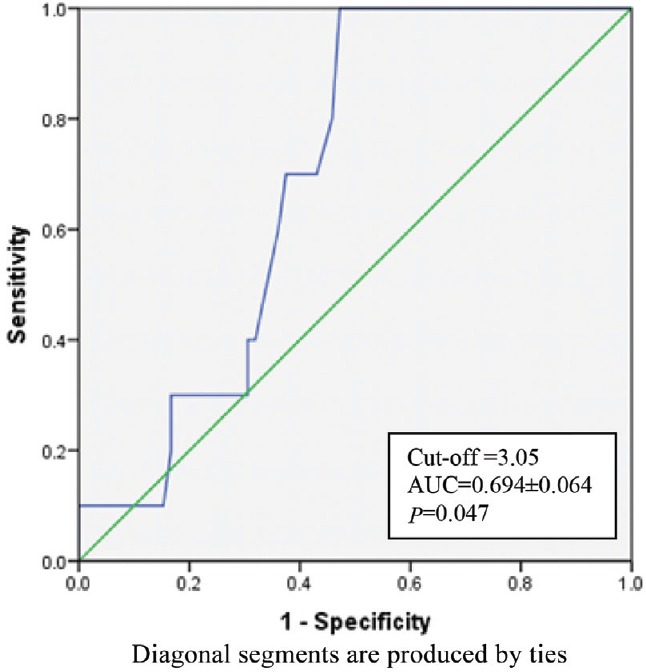
Receiver operating characteristic for K time. (AUC: area under curve).
Table III.
Components of thromboelastograph, haemostatic test and bleeding
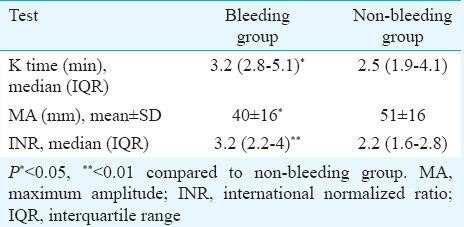
Table IV.
Predictive values and likelihood ratios of K time and maximum amplitude (MA)

Fig. 2.
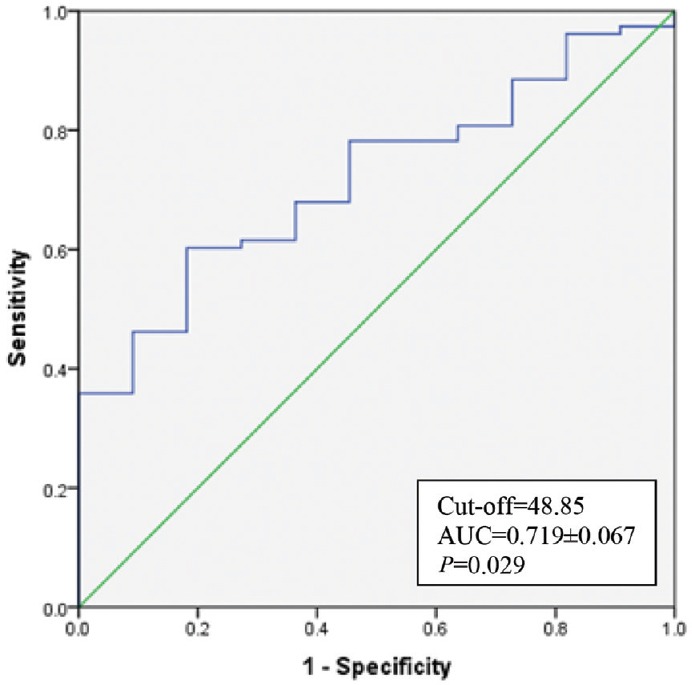
Receiver operating characteristic for Maximum amplitude.
Table V.
Cut-off values with sensitivity and specificity for variables
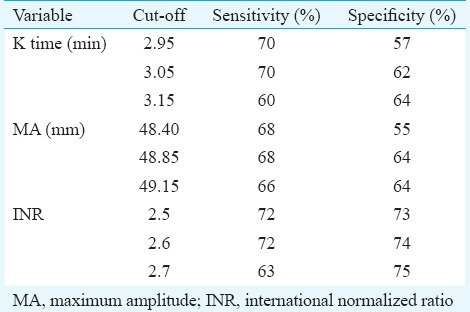
Fig. 3.
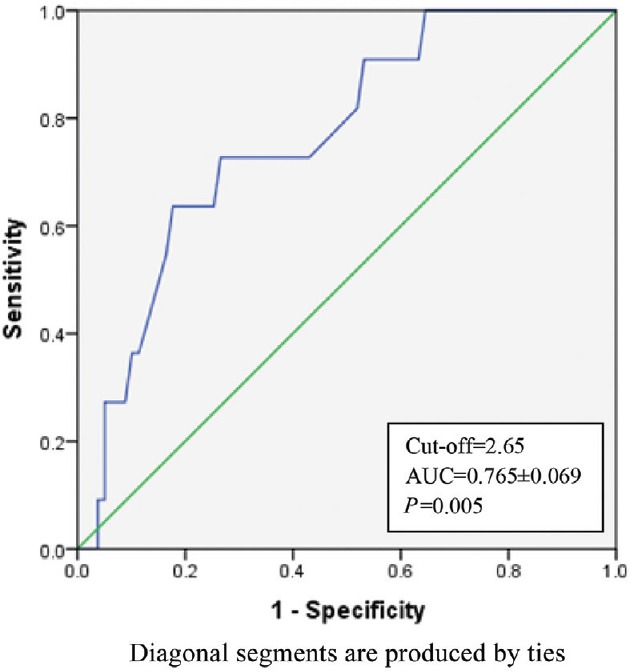
Receiver operating characteristic for International normalized ratio (INR).
Sensitivity and specificity of TEG parameters in detecting coagulopathy were 91 and 49 per cent, respectively. Positive and negative predictive values for TEG in detecting coagulopathy were 20 and 97.5 per cent, respectively. Sensitivity and specificity of laboratory parameters (INR and platelet count) in detecting coagulopathy were 100 and 5 per cent, respectively. Positive and negative predictive values of laboratory parameters in detecting coagulopathy were 12 and 100 per cent, respectively.
Discussion
Our study suggested that TEG was better at predicting bleeding after CVC insertion in patients with liver disease compared to laboratory parameters (platelet counts and INR). The K time of the TEG components was a significant indicator of bleeding while MA was a significant indicator of non-bleeding in our patients.
Thromboelastography has been used for blood replacement during liver transplant surgery and coronary artery bypass surgery12,13. Transfusion algorithms based on TEG have been developed and have shown to reduce transfusion requirements12. However, bleeding during surgery is a dynamic process with many surgical and non-surgical perioperative factors playing major contribution14. Apart from surgery, patients with liver disease also undergo other invasive procedures such as CVC insertion, tracheostomy, liver biopsy, pleural or ascitic fluid tapping. Central venous cannulations particularly in patients with deranged coagulation profile should be done under ultrasound guidance so that the chances of arterial puncture can be avoided, but it is not widely available and needs technical skill.
TEG variables have been used to examine re-bleeding in patients with oesophageal varices. Chau et al15 found that TEG variables R, K and α were associated with variceal re-bleed in 20 cirrhotic patients. Of these, α angle was found to have significance. Routine coagulation tests (PT, platelet count, activated partial thromboplastin time, whole-blood clot lysis time) did not show a significant difference between the re-bleeding and non-re-bleeding groups15. In our study also, TEG was significantly better than conventional laboratory parameters at predicting bleeding with a specificity of 49 per cent of TEG versus specificity of 5 per cent of conventional tests. There was no significant difference between the TEG and conventional tests with regard to the negative predictive value for bleeding (97.5 vs. 100%). A low-positive predictive value of 20 per cent indicated low occurrence of coagulopathy in this population. LRs are independent of disease prevalence and refer to the likelihood of having disease. However, the positive LRs of 1.87 for K time and MA indicated that the likelihood of the patient having coagulopathy increased by approximately two times given the positive test result.
Davis and Chandler16 used TEG to predict bleeding after renal transplant biopsy in 120 patients. They found that K time and α angle were significantly associated with bleeding after renal transplant biopsy, and α angle was found to be the best indicator of bleeding. In our study, K time was a significant predictor of bleeding while MA was a significant predictor of non-bleeding in patients with cirrhosis.
Platelet count and INR are the most commonly available and widely used tests for assessment of coagulopathy. However, these have not been found to be the predictors of bleeding in patients with liver disease17. Our study demonstrated that INR value of 2.6 had a sensitivity and specificity of 72 and 74 per cent, respectively. Our results were in agreement with the study by Chau et al15 in which platelet count and INR were not found to be reliable predictors of bleeding in patients with liver disease.
We did not include patients with variceal bleed because these patients invariably received blood products for coagulopathy correction, which might confound the results of TEG. The presence of renal dysfunction is also known to increase the risk of bleeding18,19. We included serum creatinine as a marker for the renal dysfunction. However, since serum creatinine is not a good indicator of renal function in patients with liver disease20, we may have missed out a few cases of renal dysfunction in this study.
On the basis of findings of this pilot study, we suggest that cut-off value for INR of 2.6 or more and K time 3.05 min or more may be taken into consideration for predicting bleeding and MA 48.8 mm or more to predict non-bleeding in patients with cirrhosis undergoing CVC insertion.
Footnotes
Conflicts of Interest: None.
References
- 1.Lisman T, Porte RJ. Rebalanced hemostasis in patients with liver disease: Evidence and clinical consequences. Blood. 2010;116:878–85. doi: 10.1182/blood-2010-02-261891. [DOI] [PubMed] [Google Scholar]
- 2.Tripodi A, Salerno F, Chantarangkul V, Clerici M, Cazzaniga M, Primignani M, et al. Evidence of normal thrombin generation in cirrhosis despite abnormal conventional coagulation tests. Hepatology. 2005;41:553–8. doi: 10.1002/hep.20569. [DOI] [PubMed] [Google Scholar]
- 3.Segal JB, Dzik WH. Transfusion Medicine/Hemostasis Clinical Trials Network. Paucity of studies to support that abnormal coagulation test results predict bleeding in the setting of invasive procedures: An evidence-based review. Transfusion. 2005;45:1413–25. doi: 10.1111/j.1537-2995.2005.00546.x. [DOI] [PubMed] [Google Scholar]
- 4.Benson AB, Austin GL, Berg M, McFann KK, Thomas S, Ramirez G, et al. Transfusion-related acute lung injury in ICU patients admitted with gastrointestinal bleeding. Intensive Care Med. 2010;36:1710–7. doi: 10.1007/s00134-010-1954-x. [DOI] [PMC free article] [PubMed] [Google Scholar]
- 5.Dupont J, Messiant F, Declerck N, Tavernier B, Jude B, Durinck L, et al. Liver transplantation without the use of fresh frozen plasma. Anesth Analg. 1996;83:681–6. doi: 10.1097/00000539-199610000-00004. [DOI] [PubMed] [Google Scholar]
- 6.Mallett SV, Chowdary P, Burroughs AK. Clinical utility of viscoelastic tests of coagulation in patients with liver disease. Liver Int. 2013;33:961–74. doi: 10.1111/liv.12158. [DOI] [PubMed] [Google Scholar]
- 7.Schaden E, Saner FH, Goerlinger K. Coagulation pattern in critical liver dysfunction. Curr Opin Crit Care. 2013;19:142–8. doi: 10.1097/MCC.0b013e32835ebb52. [DOI] [PubMed] [Google Scholar]
- 8.Ray BR, Mohan VK, Kashyap L, Shende D, Darlong VM, Pandey RK. Internal jugular vein cannulation: A comparison of three techniques. J Anaesthesiol Clin Pharmacol. 2013;29:367–71. doi: 10.4103/0970-9185.117115. [DOI] [PMC free article] [PubMed] [Google Scholar]
- 9.Harvey M, Cave G. Ultrasound-guided peripheral venous cannulation using the Seldinger technique. Emerg Med J. 2011;4:338. doi: 10.1136/emj.2010.100602. [DOI] [PubMed] [Google Scholar]
- 10.Fragou M, Gravvanis A, Dimitriou V, Papalois A, Kouraklis G, Karabinis A, et al. Real-time ultrasound-guided subclavian vein cannulation versus the landmark method in critical care patients: A prospective randomized study. Crit Care Med. 2011;39:1607–12. doi: 10.1097/CCM.0b013e318218a1ae. [DOI] [PubMed] [Google Scholar]
- 11.Giannini EG, Greco A, Marenco S, Andorno E, Valente U, Savarino V. Incidence of bleeding following invasive procedures in patients with thrombocytopenia and advanced liver disease. Clin Gastroenterol Hepatol. 2010;8:899–902. doi: 10.1016/j.cgh.2010.06.018. [DOI] [PubMed] [Google Scholar]
- 12.Wang SC, Shieh JF, Chang KY, Chu YC, Liu CS, Loong CC, et al. Thromboelastography-guided transfusion decreases intraoperative blood transfusion during orthotopic liver transplantation: Randomized clinical trial. Transplant Proc. 2010;42:2590–3. doi: 10.1016/j.transproceed.2010.05.144. [DOI] [PubMed] [Google Scholar]
- 13.Ak K, Isbir CS, Tetik S, Atalan N, Tekeli A, Aljodi M, et al. Thromboelastography-based transfusion algorithm reduces blood product use after elective CABG: A prospective randomized study. J Card Surg. 2009;24:404–10. doi: 10.1111/j.1540-8191.2009.00840.x. [DOI] [PubMed] [Google Scholar]
- 14.Westerkamp AC, Lisman T, Porte RJ. How to minimize blood loss during liver surgery in patients with cirrhosis. HPB (Oxford) 2009;11:453–8. doi: 10.1111/j.1477-2574.2009.00078.x. [DOI] [PMC free article] [PubMed] [Google Scholar]
- 15.Chau TN, Chan YW, Patch D, Tokunaga S, Greenslade L, Burroughs AK. Thrombelastographic changes and early rebleeding in cirrhotic patients with variceal bleeding. Gut. 1998;43:267–71. doi: 10.1136/gut.43.2.267. [DOI] [PMC free article] [PubMed] [Google Scholar]
- 16.Davis CL, Chandler WL. Thromboelastography for the prediction of bleeding after transplant renal biopsy. J Am Soc Nephrol. 1995;6:1250–5. doi: 10.1681/ASN.V641250. [DOI] [PubMed] [Google Scholar]
- 17.Tripodi A, Mannucci PM. The coagulopathy of chronic liver disease. N Engl J Med. 2011;365:147–56. doi: 10.1056/NEJMra1011170. [DOI] [PubMed] [Google Scholar]
- 18.Slack A, Yeoman A, Wendon J. Renal dysfunction in chronic liver disease. Crit Care. 2010;14:214. doi: 10.1186/cc8855. [DOI] [PMC free article] [PubMed] [Google Scholar]
- 19.Noris M, Remuzzi G. Uremic bleeding: Closing the circle after 30 years of controversies? Blood. 1999;94:2569–74. [PubMed] [Google Scholar]
- 20.Bonnel AR, Bunchorntavakul C, Reddy KR. Immune dysfunction and infections in patients with cirrhosis. Clin Gastroenterol Hepatol. 2011;9:727–38. doi: 10.1016/j.cgh.2011.02.031. [DOI] [PubMed] [Google Scholar]


