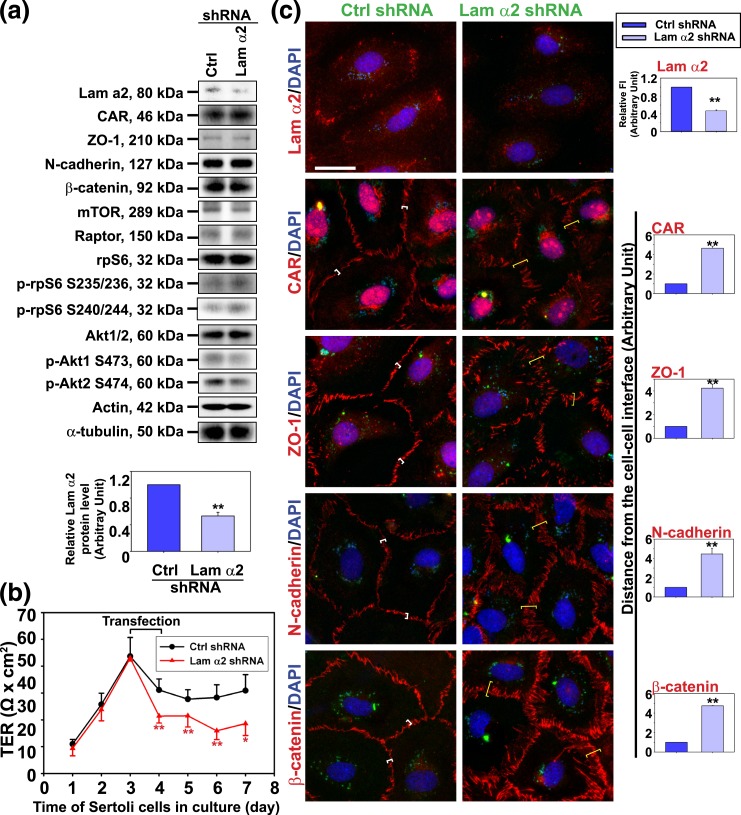
Figure 2.
Knockdown of laminin α2 disrupts the Sertoli cell TJ-permeability barrier function through mTORC1-Akt signaling. Primary Sertoli cells cultured for 3 days were transfected with laminin α2 (Lam α2) vs nontargeting negative control (Ctrl) shRNA for 24 hours. Cells were rinsed and cultured for additional 24 hours (for IF) or 48 hours (for IB). (a) Studies by IB illustrated laminin α2 was silenced by ∼50%. Knockdown of laminin α2 had no effect on the protein levels of TJ (e.g., CAR and ZO-1) and basal ES proteins (e.g., N-cadherin and β-catenin). Laminin α2 knockdown, however, induced an upregulation of p-rpS6 S235/236 and p-rpS6 S240/244 (the activated form of rpS6) and downregulated p-Akt1 S473 and p-Akt2 S474, but not the total rpS6 or total Akt. Each bar in the histogram is a mean ± SD of 6 independent experiments. ** P < 0.01 by Student t test. Changes in the steady-state level of p-rpS6 S235/236 and p-rpS6 S240/244 vs p-rpS6, and also p-Akt1 S473 and pAkt2 S474 vs total Akts, were shown in Supplemental Fig. 1 (157.3KB, pdf) . (b) Knockdown of laminin α2 perturbed the Sertoli cell TJ-permeability barrier function. Each data point is a mean ± SD of triplicate bicameral units of a representative experiment from a total of n = 3 independent experiments which yielded similar results. *P < 0.05; **P < 0.01 by Student t test. (c) Studies by IF confirmed laminin α2 expression in Sertoli cell cytosol but laminin α2 also prominently localized at the cell-matrix interface, consistent with the notion that laminin α2 is a basement membrane protein. Knockdown of laminin α2 by using specific shRNA considerably reduced its expression (red fluorescence) in Sertoli cells. Laminin α2 knockdown also caused mislocalization of BTB-associated proteins (e.g., CAR, ZO-1, N-cadherin, and β-catenin), such that these proteins no longer localized tightly at the cell-cell interface (see white brackets in cells transfected with control shRNA), but diffusely localized at the site (yellow brackets in cells transfected with laminin α2-specific shRNA), illustrating these proteins were being redistributed from the near the cell surface to the cell cytosol. Sertoli cell nuclei were visualized by DAPI (blue). The expression of GFP (green) illustrated successful transfection because GFP is an integrated component of the vector DNA. Scale bar, 30 μm. Histograms on the right panel summarized IF results for each target protein shown on the two left panels with each bar represents a mean ± SD of three experiments. Fluorescence at two opposite sides of two adjacent cells from 50 randomly selected cells were scored and analyzed from each experiment as described in Materials and Methods, and a total of three independent experiments were done, which yielded similar results. **P < 0.01 by Student t test.

