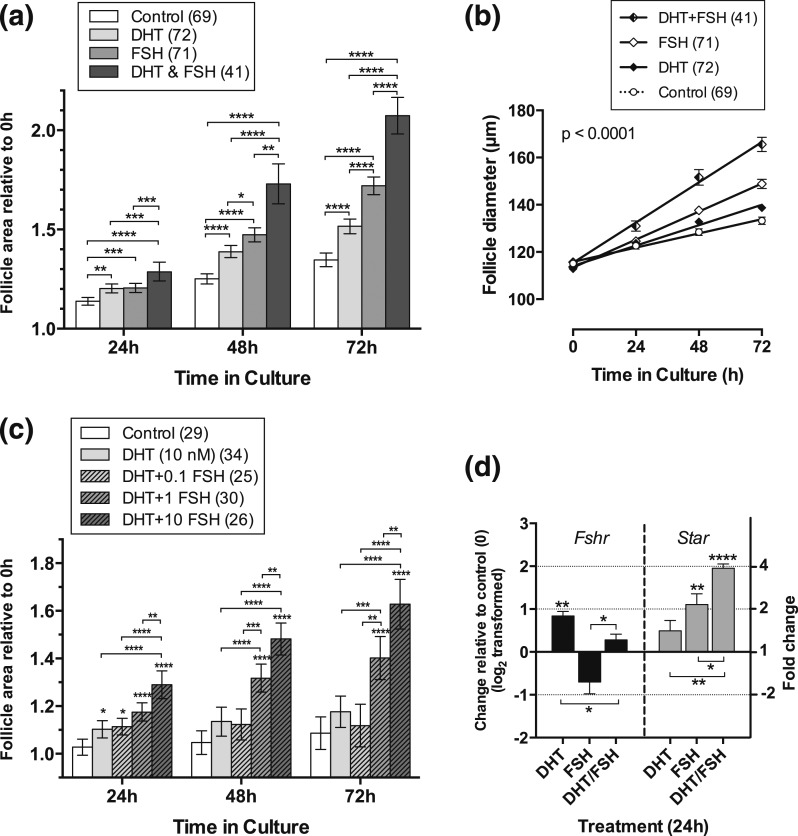
Figure 6.
(a) FSH further stimulates DHT-stimulated follicle growth after 48 hours of culture. Relative area of follicles in different treatments was compared at each time point using one-way ANOVA with a Tukey’s multiple comparisons test. *P < 0.05, **P < 0.01, ***P < 0.001, ****P < 00001. Values are mean and 95% confidence interval. Numbers in parentheses are numbers of follicles. (b) Growth trajectory over time of follicles cultured in the absence and presence of DHT and/or FSH. A combination of DHT and FSH stimulates a greater rate of growth than DHT alone (P < 0.0001), FSH alone (P < 0.0001), or control (P < 0.0001). FSH or DHT alone stimulates a greater rate of growth than control (FSH, P < 0.0001; DHT, P < 0.002). The rate of growth in FSH alone is significantly greater than that in DHT alone (P < 0.0004). Values are means and SEM, and lines are regression slopes. Slopes were compared using linear regression. Numbers in parentheses are numbers of follicles. (c) Follicles cultured in the presence of DHT and increasing doses of FSH showed significant growth enhancement in the presence of 1 ng/mL and 10 ng/mL FSH, but not in the lowest dose of FSH (0.1 ng/mL). Statistical comparisons as in a. (d) Change in expression of Fshr and Star in four samples of five follicles, each cultured for 24 hours in the presence of DHT alone, FSH alone, or DHT and FSH in combination. Data have been log2 transformed, and treatments were compared with control (0) and between treatments using an unpaired t test. Fold change indicated in right-hand y axis. Asterisks by error bars indicate a significant difference in expression from control; differences between treatments are indicated by asterisks on horizontal lines. P values as in a. Values are mean and SEM.

