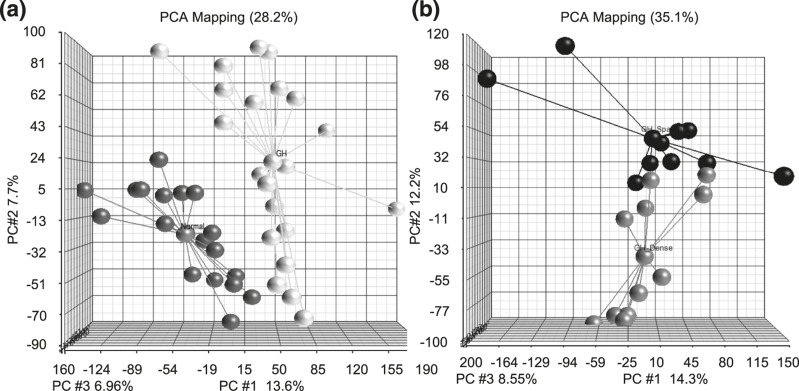
Figure 1.
PCA graphs showing differential gene expression between normal pituitary, DG, and SG GH tumors. (a) PCA plot displaying the expression profiles of individual GH tumors (white dots) compared with normal pituitary samples (black dots). (b) PCA plot of the global differences in gene expression between SG (black) and DG (gray) GH tumors.

