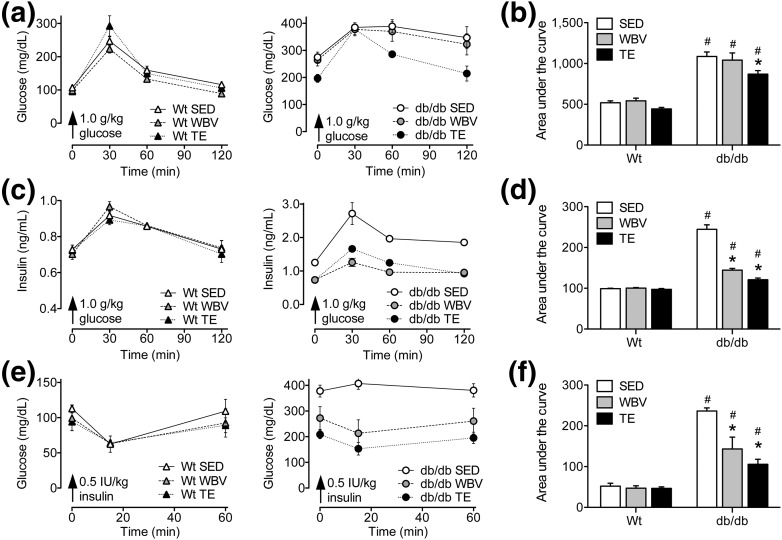
Figure 3.
Partial reinstatement of glycemic control and recovery of insulin sensitivity following exercise or WBV in db/db mice. (a) Left graph shows fasting glucose levels and responses to IP glucose administration in WT mice exposed to TE, WBV, or SED conditions. Right graph shows fasting glucose and responses to IPGTT in db/db mice. (b) Bars represent group averages for the AUC, which was computed using serum glucose values taken before and at intervals after IP glucose challenge. Exercise reduces the AUC in db/db mice relative to db/db SED mice, indicative of enhanced glucose clearance. (c) Left graph shows fasting insulin levels and insulin responses to IP glucose in WT mice, and right graph shows measures from db/db mice in the indicated conditions. (d) In db/db mice, exercise and WBV reduced AUC values derived from insulin responses to glucose challenge. Reductions in AUC relative to db/db SED mice are indicative of enhanced pancreatic sensitivity to glucose after musculoskeletal loading. (e) Left graph shows serum glucose levels before and after IP insulin administration in WT mice, and right graph shows these measures for the indicated groups of db/db mice. (f) Comparison of the AUC from glucose responses to insulin challenge revealed that exercise and WBV partially restored insulin sensitivity in db/db mice relative to db/db SED mice. Although all groups of db/db mice were insulin resistant relative to WT mice, the reductions observed following exercise and WBV suggest enhancement of insulin sensitivity. For graphs, bars and symbols represent the average of (n= 6 to 8) mice in the indicated conditions, and hashtags denote the effect of genotype following 2 × 3 ANOVA with statistical significance at P < 0.05. Asterisks indicate significant differences relative to matched-genotype SED mice following one-way ANOVA with Bonferroni-corrected post hoc comparisons.

