Abstract
Purpose
Commonly 2D scouts or topograms are used prior to CT scan acquisition. However, low-dose 3D scouts could potentially provide additional information for more effective patient positioning and selection of acquisition protocols. We propose using model-based iterative reconstruction to reconstruct low exposure tomographic data to maintain image quality in both low-dose 3D scouts and reprojected topograms based on those 3D scouts.
Methods
We performed tomographic acquisitions on a CBCT test-bench using a range of exposure settings from 16.6 to 231.9 total mAs. Both an anthropomorphic phantom and a 32 cm CTDI phantom were scanned. The penalized-likelihood reconstructions were made using Matlab and CUDA libraries and reconstruction parameters were tuned to determine the best regularization strength and delta parameter. RMS error between reconstructions and the highest exposure reconstruction were computed, and CTDIW values were reported for each exposure setting. RMS error for reprojected topograms were also computed.
Results
We find that we are able to produce low-dose (0.417 mGy) 3D scouts that show high-contrast and large anatomical features while maintaining the ability to produce traditional topograms.
Conclusions
We demonstrated that iterative reconstruction can mitigate noise in very low exposure CT acquisitions to enable 3D CT scout. Such additional 3D information may lead to improved protocols for patient positioning and acquisition refinements as well as a number of advanced dose reduction strategies that require localization of anatomical features and quantities that are not provided by simple 2D topograms.
I. INTRODUCTION
Computed tomography (CT) is widespread and plays an important role in diagnostic image; however, there have been increasing concerns about the radiation exposures received by patients. There are many factors that influence patient dose including patient positioning1,2 and dose reduction methods like tube current modulation3,4 that customize the x-ray exposure to the patient. Both of these elements rely on understanding patient size, location within the scanner, and the anatomical targets of interest. Traditionally, this information is gathered through 2D “scout” or “survey” projections of the patient called topograms. Typically, one anterior-posterior view and/or one lateral view are collected to verify patient position, field of view, and to drive current modulation schemes.
A number of more advanced dose reduction strategies are in development including fluence-field modulation,5,6 region-of-interest scanning,7,8 and task-driven acquisition and reconstruction;9 however, these approaches generally require more anatomical information than one- or two-view projection data. Recently, 3D scouts have been proposed10 as an alternative to traditional topograms. For these scans to be effective, one must collect projection data at very low exposures (e.g., at the same level of traditional topograms) and the image quality must be sufficient for the given application. As in previous work,10 we note that model-based reconstruction is an important tool for maintaining image quality with very low-dose acquisitions.
In this work, we investigate low-dose CT acquisitions appropriate for generating 3D scouts and use penalized-likelihood reconstruction to mitigate noise in the low-exposure data. We concentrate on abdominal imaging using a cone-beam CT test-bench and make dose measurements associated with different exposure levels. Moreover, we consider the image quality associated with both the 3D scout image volumes as well as reprojected data that emulates traditional topogram data collections.
II. METHODS
A) Data acquisition and Basic Processing
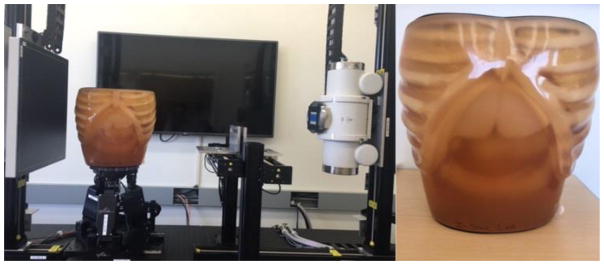
For our investigations, an abdominal phantom (Kyoto Kagaku, Kyoto, Japan) was scanned on a custom cone-beam CT test-bench (See Figure 1). The x-ray generator and controls were modified to permit frame-to-frame modulation of the x-ray pulse width (e.g., to emulate tube current modulation) though only constant pulse widths were used in these experiments. An x-ray technique of 100 kVp and 20 mA were used for all experiments with 360 views and the same geometry for all of them. We acquired data over a range of 0.1–30 ms commanded pulses. Projection data were corrected for the offset and gain. 20 offset frames were acquired before and after each acquisition and averaged to form a mean offset image. Air scans of 100 frames were acquired for each pulse length for gain correction. Standard geometric calibrations were performed to determine the system geometry for reconstruction.
Figure 1.
CBCT test-bench and abdominal phantom.
B) Pulse Width Verification and CTDI measurements
Due to the customization of the x-ray generator for pulse-width modulation, pulse length measurements were made using the Accu-Pro kV sensor (RadCal, Monrovia, CA) for each of the commanded pulse widths. To measure the dose for each exposure level, we used the Accu-Pro system with a 0.6 cc Farmer chamber and 32 cm CTDI phantom. CTDI phantom scans were collimated to a 4 cm width (at the phantom). Integral doses were measured on the center and peripheral locations of the CTDI phantom, allowing the calculation of a weighted CTDI:
For measurements with commanded pulse widths between 0.1ms and 1.25ms, the equipment was not sensitive enough to measure the dose at the center (i.e., zero reading). Therefore, to compute CTDIW we scaled a longer pulse width measure by a ratio of air scan values.
C) Penalized-Likelihood Reconstruction, Topogram Generation, and Assessment
For reconstruction, a penalized-likelihood (PL) estimator was chosen. To match the Poisson model, air scan values were used to estimate the bare-beam fluence. A Huber penalty was applied with transition parameter, δ, and regularization strength, β. The δ parameter delta was chosen to be 10−3 mm−1 based on previous studies and experiments.11 To determine optimal regularization strength, reconstructions over a range of β values were performed for the highest exposure image. An edge response (between the spine and soft-tissue regions) was computed, and chose the β associated with a 1.5 mm blur. In this high exposure case (231.91mAs), we found β = 400 and this reconstruction was used as our gold standard. For all other exposure levels regularization strength was chosen to minimize RMSE between the gold standard and the lower-exposure reconstruction. All PL volumes were reconstructed with 1×1×1 mm3 voxels. Fifty iterations of a separable quadratic surrogates algorithm12 was performed using 20 ordered subsets. Additionally, a basic scatter correction was applied to the data. Specifically, a scalar value was subtracted all projections. This scalar was chosen as a fraction of the lowest pixel values in all projections for each exposure level. RMSE relative to the gold standard was recorded for each low-exposure reconstruction.
In addition to the volumetric reconstructions, we generated synthetic topogram for the anterior-posterior and lateral views. We used the same geometry as the imaging system to re-project the PL reconstruction data at each exposure level. As with the PL volumes, the highest exposure was used as a gold standard and RMSE for lower exposures was computed relative to the gold standard topogram.
III. RESULTS
A) System Characterization, Data acquisitions, and Dosimetry
Following pulse width measurement experiments, we found that commanded tube pulse values were not accurate and an offset of +2.21 ms was present (based on a linear fit across all exposures). Actual pulse lengths, corresponding exposures, and dosimetry results are summarized in Table 1. In addition to CTDIW, we estimated dose-length product (DLP) presuming a pitch of 1.0 and 25 cm of axial coverage. Published abdominal CT dose-length products13 are in the range of 300–500 mGy·cm. Presuming a typical value of 400 mGy·cm and recognizing that topograms are acquired at doses 0.4–2% of the CT scan10 (or 0.8–4% for bilateral scouts), we expect topograms to be in the range of 3.2–16 mGy·cm – approximately matched to the lower end of our investigated range and suggesting that these acquisitions are comparable in dose to traditional CT topograms.
Table 1.
Summary of acquisition and reconstruction parameters, and dosimetry
| Scan | Tube Current (mA) | Commanded Pulse Width (ms) | Actual Pulse Width (ms)(ms) | Total Exposure (mAs) | Optimal β | CTDIw (mGy) | DLP (mGy·cm) |
|---|---|---|---|---|---|---|---|
| 1 | 20 | 30 | 32.21 | 231.91 | 400 | 7.593 | 190 |
| 2 | 20 | 15 | 17.21 | 123.91 | 1000 | 4.108 | 103 |
| 3 | 20 | 7 | 9.21 | 66.31 | 1000 | 2.067 | 51.7 |
| 4 | 20 | 3.5 | 5.71 | 41.11 | 1000 | 1.448 | 36.2 |
| 5 | 20 | 1.25 | 3.46 | 24.91 | 1000 | 0.612 | 15.3 |
| 6 | 20 | 0.5 | 2.71 | 19.51 | 1000 | 0.608 | 15.2 |
| 7 | 20 | 0.25 | 2.46 | 17.71 | 1000 | 0.444 | 11.1 |
| 8 | 20 | 0.1 | 2.31 | 16.63 | 600 | 0.417 | 10.4 |
B) Reconstructed Image Volumes
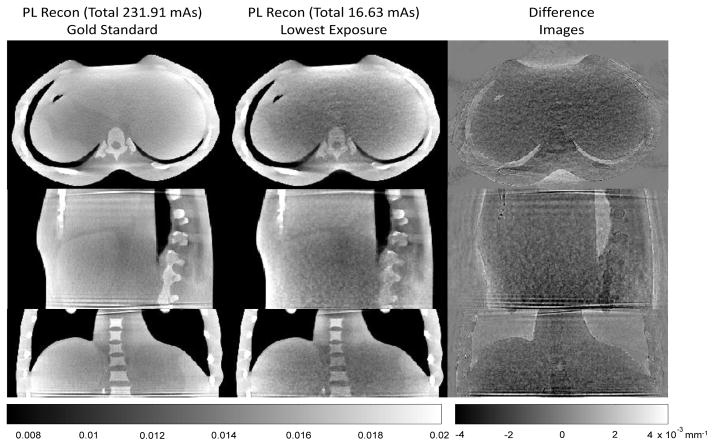
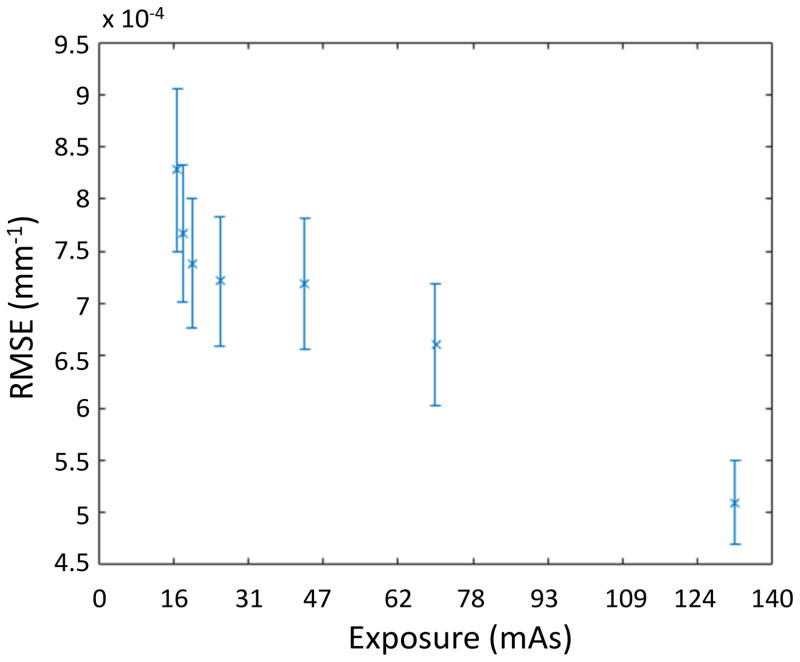
Results of the regularization optimization are included in Table 1. It is interesting to note that the regularization parameter that achieves the minimum RMSE relative to the gold standard is relatively constant across exposures. (The optimum was at β = 1000 for all but the highest and lowest exposures. The differences in these two cases is small since the action of β tends to be logarithmic.) Sample reconstructions of the highest and lowest exposures are shown in Figure 2. While the lowest exposure image is clearly noisier, large and high contrast features are still evident in the reconstruction. Tissue boundaries can still be seen but with some difficulty. At the lowest exposures some ring artifacts are starting to become noticeable. Difference images better show the noise structure as well as the presence of some systematic bias – specifically, under-attenuation in soft tissue regions. Figure 3 illustrates the RMSE in low exposure reconstructions as compared to the highest exposure gold standard. The RMSE generally increases slowly with decreasing exposure but appears to increase dramatically at the lowest exposure settings.
Figure 2.
Sample PL reconstructions including the highest exposure gold standard and the lowest exposure (16.63 mAs) reconstruction. Difference images between these two image volumes show some systematic bias (under-attenuation) as well as increased noise. While noise levels are increased and some ring artifacts are present, even the lowest exposure investigated shows important gross details that are useful for patient positioning and coarse organ localization.
Figure 3.
RMSE of the PL reconstruction versus the gold standard as a function of exposure. RMSE was computed over the central 41 transaxial slices – slice-by-slice. Inter-slice RMSE variation was used to place ±1 std. dev. error bars on the plot.
C) Synthetic Topograms
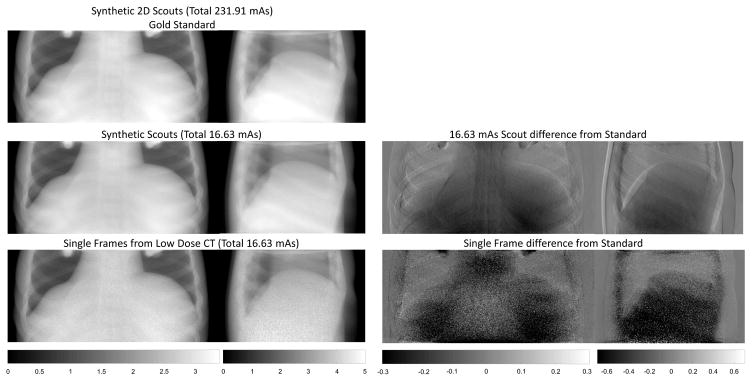
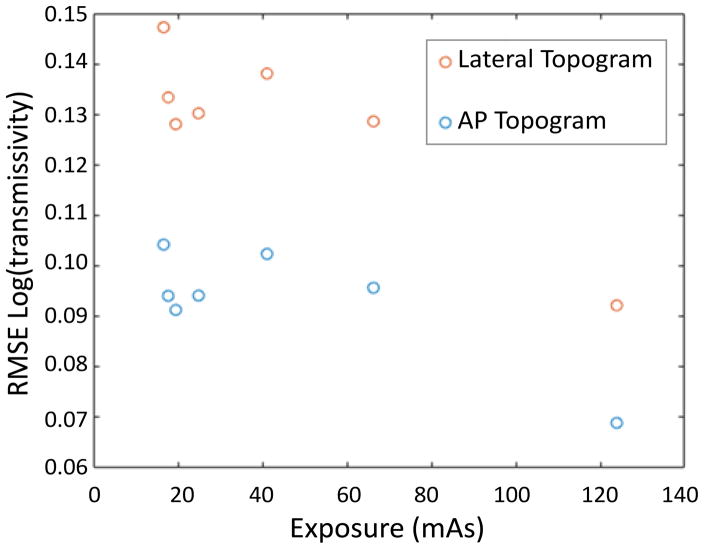
In addition to the low-exposure 3D scout investigation in the previous section, synthetic AP and lateral topograms were generated. Sample topograms for the highest and lowest exposures are shown in Figure 4. Additionally, we show single projection views from the lowest exposure data set. The differences between the synthetic topograms at different exposures is difficult to visualize. Difference images show some increased noise, but bias is more dominant (again, under-attenuation). The source of this bias is unclear but may be due to kVp changes. As compared with single views from the CBCT projection data, the synthetic topograms are much less noisy – indicating that regularization and integration of other views can lead to substantial denoising. RMSE relative to the gold standard topograms are shown in Figure 5. The RMSE is a very shallow function of exposure, as one might expect from the qualitative assessment of the synthetic topograms.
Figure 4.
Illustration of synthetic topograms produced from re-projection of the PL reconstructions of very low exposure CT data. The highest exposure case is used as a gold standard for comparison. While even the lowest exposure synthetic topograms appear nearly indistinguishable from the gold standard, there are quantitative differences evident in different images. Note that re-projections of the PL reconstruction yield higher quality topograms than the raw CBCT data from single views.
Figure 5.
RMSE of the synthetic topograms relative to the gold standard topogram as a function of exposure. The lateral topograms have higher error (likely due to the longer path lengths) and follow a similar trend to the AP topogram. The RMSE is a relatively flat function of exposure.
IV. DISCUSSION and CONCLUSION
We have presented an approach for low-exposure acquisition of 3D scouts for CT that uses model-based reconstruction to control noise. Initial dose assessments suggest that one can collect such 3D scouts at exposure levels similar to current 2D topograms and produce images that are good enough to show high-contrast and large area anatomical features. In this fashion, we can gain additional 3D information for the same patient exposure of traditional 2D scouts that may enable a variety of advanced dose reduction methods as well as improved patient positioning and tube current modulation. We have also demonstrated that if traditional 2D topograms are desired, these may be formed by re-projecting the 3D scouts. Thus, not only can we gain 3D preview information about the patient anatomy, traditional protocols that require conventional 2D topograms can also be maintained.
References
- 1.Toth T, Ge Z, Daly MP. The influence of patient centering on CT dose and image noise. Med Phys. 2007;34(7):3093. doi: 10.1118/1.2748113. [DOI] [PubMed] [Google Scholar]
- 2.Strauss KJ, Goske MJ, Kaste SC, Bulas D, Frush DP, Butler P, Morrison G, Callahan MJ, Applegate KE. Image gently: Ten steps you can take to optimize image quality and lower CT dose for pediatric patients. AJR Am J Roentgenol. 194(4):868–873. doi: 10.2214/AJR.09.4091. [DOI] [PubMed] [Google Scholar]
- 3.Gies M, Kalender WA, Wolf H, Suess C. Dose reduction in CT by anatomically adapted tube current modulation. I. Simulation studies. Med Phys. 26(11):2235–2247. doi: 10.1118/1.598779. [DOI] [PubMed] [Google Scholar]
- 4.Kalra MK, Maher MM, Toth TL, Schmidt B, Westerman BL, Morgan HT, Saini S. Techniques and applications of automatic tube current modulation for CT. Radiology. 233(3):649–657. doi: 10.1148/radiol.2333031150. [DOI] [PubMed] [Google Scholar]
- 5.Hsieh SS, Pelc NJ. The piecewise-linear dynamic attenuator reduces the impact of count rate loss with photon-counting detectors. Phys Med Biol. 59(11):2829–2847. doi: 10.1088/0031-9155/59/11/2829. [DOI] [PMC free article] [PubMed] [Google Scholar]
- 6.Stayman JW, Mathews A, Zbijewski W, Gang G, Siewerdsen J, Kawamoto S, Blevis I, Levinson R. Fluence-field modulated x-ray CT using multiple aperture devices. SPIE Medical Imaging. 2016:97830X. doi: 10.1117/12.2214358. [DOI] [PMC free article] [PubMed] [Google Scholar]
- 7.Chityala R, Hoffmann KR, Rudin S, Bednarek DR. Region of interest (ROI) computed tomography (CT): comparison with full field of view (FFOV) and truncated CT for a human head phantom. SPIE Medical Imaging. 2005;583 doi: 10.1117/12.595430. [DOI] [PMC free article] [PubMed] [Google Scholar]
- 8.Lifeng Yu L, Yu Zou Y, Sidky EY, Pelizzari CA, Munro P, Xiaochuan Pan X. Region of interest reconstruction from truncated data in circular cone-beam CT. IEEE Trans Med Imaging. 25(7):869–881. doi: 10.1109/tmi.2006.872329. [DOI] [PubMed] [Google Scholar]
- 9.Gang GJ, Siewerdsen JH, Stayman JW. Task-driven tube current modulation and regularization design in computed tomography with penalized-likelihood reconstruction. SPIE Medical Imaging. 2016:978324. doi: 10.1117/12.2216387. [DOI] [PMC free article] [PubMed] [Google Scholar]
- 10.Yin Z, Yao Y, Montillo A, Wu M, Edic PM, Kalra M, De Man B. Acquisition, preprocessing, and reconstruction of ultralow dose volumetric CT scout for organ-based CT scan planning. Med Phys. 42(5):2730–2739. doi: 10.1118/1.4921065. [DOI] [PubMed] [Google Scholar]
- 11.Wang AS, Stayman JW, Otake Y, Kleinszig G, Vogt S, Gallia GL, Khanna AJ, Siewerdsen JH, JBJ, PN, et al. Soft-tissue imaging with C-arm cone-beam CT using statistical reconstruction. Phys Med Biol. 59(4):1005–1026. doi: 10.1088/0031-9155/59/4/1005. [DOI] [PMC free article] [PubMed] [Google Scholar]
- 12.Wang AS, Stayman JW, Otake Y, Vogt S, Kleinszig G, Siewerdsen JH. Accelerated statistical reconstruction for C-arm cone-beam CT using Nesterov’s method. Med Phys. 42(5):2699–2708. doi: 10.1118/1.4914378. [DOI] [PMC free article] [PubMed] [Google Scholar]
- 13.Shrimpton PC, Hillier MC, Lewis MA, Dunn M. National survey of doses from CT in the UK: 2003. British Journal of Radiology. 79(948):968–80. doi: 10.1259/bjr/93277434. [DOI] [PubMed] [Google Scholar]


