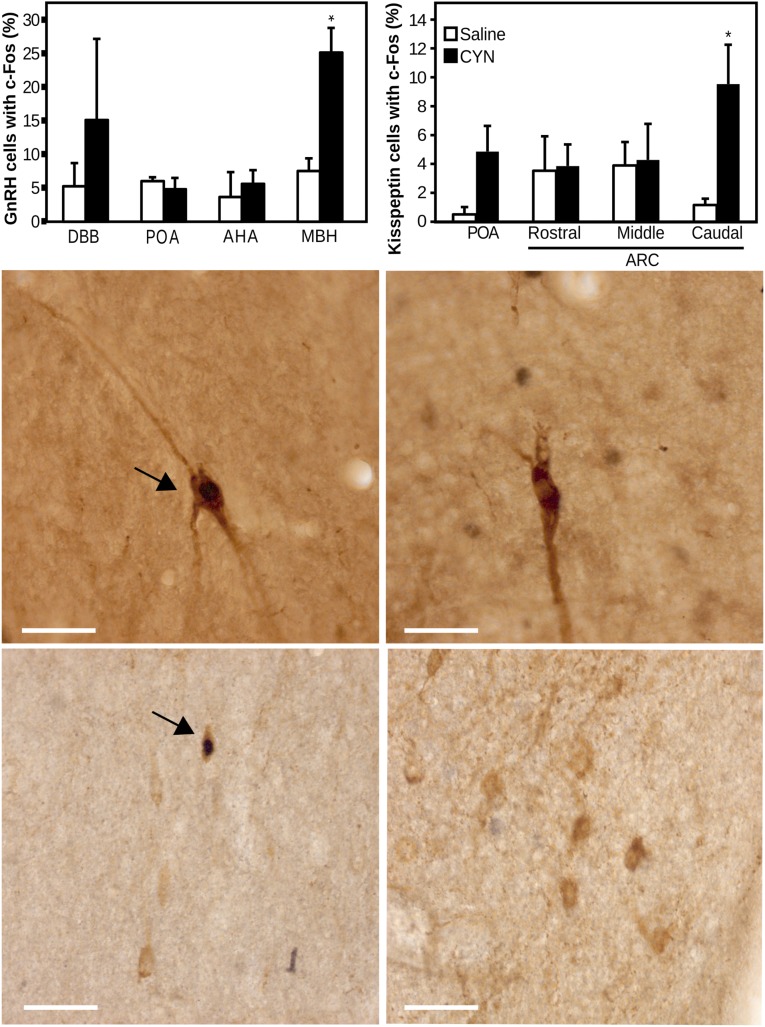
Figure 4.
Top panels: Percentage (± standard error of the mean) of GnRH and kisspeptin immunoreactive cells that contain c-Fos in ewes that received either saline (open bars) or CYN (black bars). *P < 0.05 versus saline-treated ewes. AHA, anterior hypothalamic area; DBB, diagonal band of Broca. Lower panels: Representative photomicrographs of GnRH (mediobasal hypothalmus, middle) and kisspeptin (caudal ARC, bottom) immunoreactive soma (gray) in ewes treated with CYN (left) or saline (right). Arrowheads indicate GnRH or kisspeptin soma that contain nuclear c-Fos (black). Scale bar, 50 µm.

