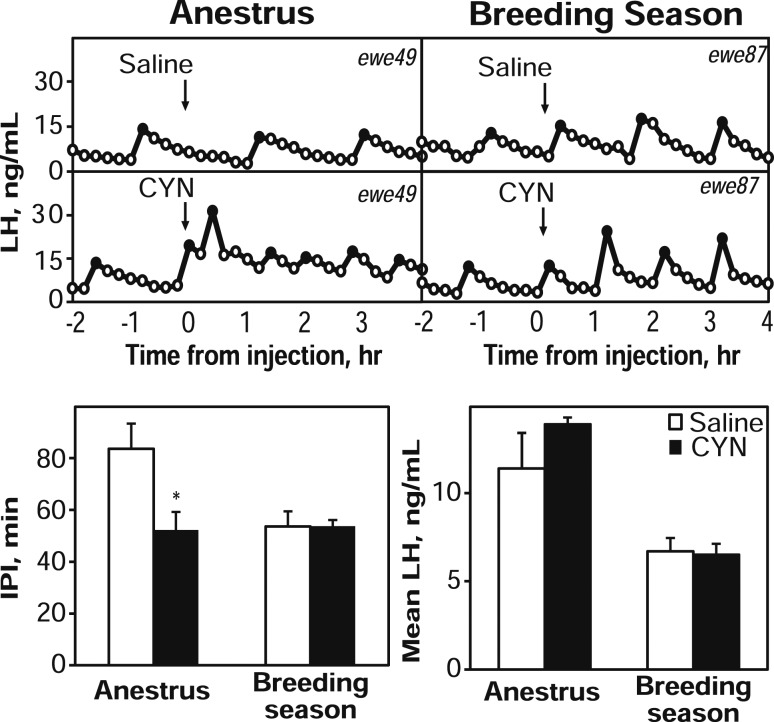
Figure 5.
Top panels: Representative LH patterns in one OVX ewe during anestrus (left) and another ewe in the breeding season (right) receiving ICV injection (arrows) of saline (top panels) or CYN (bottom panels). Black points represent samples identified as pulses. Bottom panels: Mean (± SEM) IPI (left panel) and mean LH concentration (right panel) during the 4-hour postinjection period in OVX ewes receiving saline (open bars) and CYN (black bars) during anestrus (left) or during the breeding season (right). *P < 0.05 versus saline injection.

