

Abstract
Aims
Clinical and experimental evidence supports a strong link between the complement system, complement regulatory proteins and the pathogenesis of diabetes vascular complications. We previously reported that the complement regulatory protein CD59 is inactivated by glycation in humans with diabetes. Our objective for this study is to assess experimentally how the deficiency of CD59 impacts the development of diabetic atherosclerosis in vivo.
Methods
We crossed mCD59 sufficient and deficient mice into the ApoE−/− background to generate mCd59ab+/+/ApoE−/− and mCd59ab−/−/ApoE−/− mice, and induced diabetes by multiple low dose injections of streptozotocin. Atherosclerosis was detected by hematoxylin and eosin (H&E) and oil red-O staining. Membrane attack complex (MAC) deposition and macrophage infiltration were detected by immunostaining.
Results
Diabetic mCD59 deficient (mCD59ab−/−/ApoE−/−) mice developed nearly 100% larger atherosclerotic lesion areas in the aorta (7.5% ± 0.6 vs 3.6% ± 0.7; p < 0.005) and in the aortic roots (H&E: 26.2% ± 1.9 vs. 14.3% ± 1.1; p < 0.005), in both cases associated with increased lipid (Oil red-O: 14.9% ± 1.1 vs. 7.8% ± 1.1; p < 0.05) and MAC deposition (6.8% ± 0.8 vs. 3.0% ± 0.7; p <0.005) and macrophage infiltration (31.5% ± 3.7 vs. 16.4% ± 3.0; p <0.05) in the aortic roots as compared to their diabetic mCD59 sufficient (mCD59ab+/+/ApoE−/−) counterpart.
Conclusions
The deficiency of CD59 accelerates the development of diabetic atherosclerosis.
Keywords: Atherosclerosis, CD59, Diabetes, Diabetic vascular complications, Membrane attack complex, Complement
1. Introduction
Diabetes and pre-diabetes are major independent risk factors for cardiovascular disease (CVD). Individuals with diabetes are at a much higher risk of heart attacks, stroke and occlusive peripheral vascular disease caused by an accelerated form of atherosclerosis. Seminal human studies like the Diabetes Control and Complications Trial (DCCT) demonstrated that hyperglycemia is ultimately responsible for the extensive vascular disease characteristic of human diabetes (1990) and that the vascular damage induced by hyperglycemia likely starts in the pre-diabetic state, as strongly indicated by the 2–3 fold higher risk of CVD in individuals with pre-diabetes (Jarrett et al., 1982; Tominaga et al., 1999). However, the cellular and molecular mechanisms that link hyperglycemia and vascular disease are not yet fully understood. This is in part because 1) ethical and practical considerations preclude conducting in-depth mechanistic studies in humans, especially for chronic conditions such as the complications of diabetes that take years to develop, and 2) no animal model of diabetes fully recapitulates diabetic vascular disease in the intensity and distribution seen in humans.
Extensive experimental and clinical evidence reported in the past decades supports a strong link between the complement system, complement regulatory proteins and the pathogenesis of CVD including atherosclerosis and the vascular complications of diabetes (Acosta et al., 2000; De Pergola et al., 2011; Flyvbjerg, 2010; Hertle et al., 2014; Hovind et al., 2005; Mellbin et al., 2012; Rosoklija et al., 2000; Uesugi et al., 2004; Woroniecka et al., 2011; Zhang et al., 2002). There is also experimental and clinical evidence that genetic absence or functional inhibition of CD59 is a risk factor for vascular and neuropathic disease (An et al., 2009; Emin et al., 2016; Ghosh et al., 2013; Liu et al., 2014; Nevo et al., 2013; Qin et al., 2004; Wu et al., 2009; Yamashina et al., 1990; Yun et al., 2008).
The complement system, an effector of both adaptive and innate immunity, is activated through three enzymatic cascades known as the classical, the alternative and the mannose-binding lectin (MBL) pathways (reviewed in(Morgan and Harris, 1999)). The three activation pathways eventually converge at the level of C3 and C5 and thereafter share a common sequence involving the late components C6, C7, C8, and C9, leading to the generation of a multi-protein complex C5b-9, also known as the membrane attack complex (MAC). Functionally, the membrane attack complex (MAC) is the main effector of complement-mediated tissue damage; structurally, the MAC is a circular polymer of 12–18 C9 monomers with the capacity to insert into cell membranes and to form a transmembrane pore of an effective internal radius of 5–7 nm(Podack, 1984). In non-self cells like heterologous red blood cells or bacteria, influx of ions and water through the MAC pore results in colloid-osmotic swelling and lysis. An array of mechanisms that include fluid phase and membrane-bound inhibitors of complement system has evolved to protect “self” cells from the potentially devastating effects of unrestricted complement activation. Among the membrane-bound proteins, decay-accelerating factor (DAF) (Nicholson-Weller et al., 1985), membrane cofactor protein (MCP) and complement receptor 1 (CR1) restrict the early complement activation cascade, and CD59, an 18–20 kDa GPI-linked glycoprotein (Morgan, 1995) ubiquitously expressed in mammalian cells, inhibits formation of the MAC at the terminal stage.
In human atherosclerosis, MAC co-localization with other complement activation products and immunoglobulins has been documented in atheromas (Rus et al., 1986), in which complement may be activated by bound immunoglobulins, C-reactive protein (Hansson et al., 1987), and/or cholesterol crystals, cholesterol-containing lipids or oxidized LDL (Biro et al., 2007). In animals, the deficiency of C6 protected against fat-induced atherosclerosis in rabbits(Schmiedt et al., 1998), and deficiency of CD59 increased atherosclerosis induced by high fat diet in both LDLR−/− (Yun et al., 2008) and ApoE−/− mice (Wu et al., 2009).
In human diabetes, early evidence for a potential role of complement and complement regulatory proteins in the pathogenesis of diabetic complications was provided by the identification of activated complement proteins such as C1q, C4d, C3d and MAC in kidneys (Falk et al., 1987), retinas (Zhang et al., 2002), and endoneurial microvessels (Rosoklija et al., 2000) of individuals with diabetes. Regarding CVD associated with diabetes, high blood levels of soluble MAC complexes at the time of hospitalization for an acute myocardial infarction in the large prospective DIGAMI trial strongly predicted the risk of a subsequent cardiovascular event in the next 3.5 years (Mellbin et al., 2012).
Work from our laboratory has advanced the hypothesis that the functional inactivation of human CD59 by glycation at Lysine 41, within glycation motif Lys41/His44, increases MAC-deposition and MAC dependent pathological cellular responses; thus contributing to the higher risk of CVD in humans with diabetes (Acosta et al., 2000; Qin et al., 2004). In support of this hypothesis we reported earlier that: 1) red blood cells from individuals with diabetes exhibit a significantly decreased activity of CD59 and are significantly more sensitive to MAC-mediated lysis ex-vivo (Qin et al., 2004), 2) glycated CD59 (GCD59) is present in renal and sural nerve biopsies from individuals with but not without diabetes (Qin et al., 2004), 3) GCD59 in those target organs of diabetic complications co-localize with MAC deposits(Qin et al., 2004). More recently, we reported results of three human studies in which we found robust relationships between single plasma levels of GCD59 and both acute (OGTT) and chronic measures (HbA1c) of glucose handling, and that blood levels of GC59 paralleled glucose trends during active insulin therapy(Ghosh et al., 2013; Ghosh et al., 2014).
Based on the extensive evidence summarized above for a role of complement system and MAC in the complications of diabetes and the key role of CD59 as an inhibitor of MAC formation (recently reviewed in (Ghosh et al., 2015)), we proposed the intriguing hypothesis that the inactivation or deficiency of CD59 could contribute to the development of extensive vascular disease in response to hyperglycemia.
To investigate further the effect of CD59 deficiency on the development of diabetic CVD, we generated mCD59ab knock-out mice (mCD59ab−/−)(Qin et al., 2009), and crossed them into the ApoE−/− background, one of the two mouse models recommended by NIH’s Animal Models of Diabetic Complications Consortium (https://www.diacomp.org/shared/document.aspx?id=26) for studies of diabetic CVD (Hsueh et al., 2007; Nakashima et al., 1994; Park et al., 1998). We report here that diabetic mCD59ab−/−/ApoE−/− mice develop significantly more intense atherosclerosis with increased MAC deposition than diabetic mCD59ab+/+/ApoE−/−. These results provide strong experimental support for a potential protective role of complement regulatory protein CD59 against the development of diabetic CVD.
2. Materials and Methods
2.1. Mice and induction of diabetes
Animal studies were approved by the Harvard Medical School Institutional Animal Care and Use Committee.
mCd59ab−/−/ApoE−/− mice were generated by crossing our previously reported mCd59ab−/− mice (backcrossed more than 10 times to C57BL/6J mice) (Qin et al., 2009) with ApoE−/− mice (backcrossed 10 times to C57BL/6J mice, The Jackson Laboratory, Bar Harbor, ME), as previously reported (Wu et al., 2009). The successful generation of these compound mice was determined by both PCR genotyping and FACS analysis of mCd59ab−/−/ApoE−/− erythrocytes with anti-mCd59a and anti-mCd59b antibodies to confirm the physical absence of mCD59, as previously described in detail (Wu et al., 2009). Mice were fed a normal chow diet (as opposed to the high fat diet used to induce atherosclerosis in ApoE−/−).
Both mCd59ab−/−/ApoE−/− and mCd59ab+/+/ApoE−/− mice were made diabetic by multiple low dose injections of STZ (Sigma–Aldrich, St. Louis, MO, USA), following the protocol recommended by the AMDCC. Briefly, 8-week-old mice were injected (intraperitoneal) with either STZ (50 mg/kg body weight) in 10 mM Na-citrate buffer, pH 4.5 or only buffer once daily for 5 consecutive days. Non-fasting blood glucose was measured once a week from a blood drop transferred into the glucometer directly from the tail tip. Mice were considered diabetic if blood glucose reached > 250 mg/dl 2 weeks after the first STZ administration. Sixteen weeks after STZ administration, mice were euthanized by CO2 asphyxiation.
2.2. Tissue collection and characterization of atherosclerotic lesions
After euthanization, entire aorta from the heart outlet to the iliac bifurcation was collected and analyzed by staining with oil red-O. Lesion area as percentage (%) was calculated as (oil red-O stained area/total aortic area) ×100, as previously described (Wu et al., 2009). Sections of the aortic roots (5 μm) were stained with either hematoxylin and eosin (H&E) or oil red-O and lesion area as percentage (%) was calculated as (staining positive area/ventricle area) X100, as previously described (Wu et al., 2009).
2.3. Immunofluorescence staining
Frozen aortic root sections were stained with rabbit anti-rat C9 antibody (kindly provided by Dr. B. P. Morgan, University of Wales, UK; this antibody cross-reacts with mouse C9) or with anti-mouse C3b/iC3b/C3c mAb (clone 3/26, Hycult Biotech, PA, USA). Macrophages in the atherosclerotic plaques (aortic root) were characterized by immunostaining with rat anti-mouse CD68 IgG2a (clone FA-11, AbD Serotec, USA). Primary antibodies were detected using corresponding fluorescein isothiocyanate (FITC)-conjugated secondary antibodies and compared with negative controls which were stained with the secondary antibody alone. Immunofluorescence and histological results were quantified from three serial sections in each mouse using Image ProPlus 6.0 software. Quantification of C9 deposition or macrophage infiltration in aortic roots was done as percentage (%) of positive area vs. lesion area as described (Wu et al., 2009) and two independent investigators performed all measurements in a blinded fashion unless otherwise stated. The mean of the quantified results of three sections obtained from each mouse was used for statistical analysis.
2.4. Serum lipid measurement
After euthanization, blood was drawn by heart puncture, and serum was isolated and stored at −80°C until further use. Serum cholesterol and triglyceride were measured at the Clinical Pathology Laboratory of Children’s Hospital, Boston.
2.5. ELISA for measuring C3b/iC3b/C3c
C3 activation products were measured by a sandwich ELISA using anti-mouse C3b/iC3b/C3c mAb (Markiewski et al., 2004) (clone 2/11, Hycult Biotech, PA, USA) that recognizes a neoantigenic site on the mouse C3 activation fragments C3b/iC3b/C3c in the presence of native C3(Mastellos et al., 2004). Briefly, blood was collected from the tail tip of ApoE−/− mice at various times after STZ injection and allowed to clot at 4°C for 1 hour (Kotimaa et al., 2015). Serum was separated from blood cells by centrifugation at 1000 × g for 15 min at 4°C and aliquots were stored at −80°C until analysis. Microtiter plates (Immulon 4HBX, Thermo Scientific, New York, USA) were coated with anti-mouse C3b/iC3b/C3c mAb (clone 2/11) (1 μg/ml in PBS, pH 7.4) for overnight at 4°C. Nonspecific binding to the wells was prevented by incubation with blocking buffer (1% BSA in PBS) for 1 h. Mouse serum (1/20,000 dilution in blocking buffer) were added and incubated for 1 h. Subsequently, a HRP-conjugated polyclonal goat anti-mouse C3 Ab (3 μg/ml in blocking buffer) (MP Biomedicals, USA) was added and incubated for 1 h. Bound Ab was detected by the addition of substrate solution (1-Step Ultra TMB, Thermo Scientific, Rockford, IL) with 6 min incubation period followed by addition of 10% (v/v) sulphuric acid. OD was measured in an ELISA reader at 450 nm. All incubations were conducted at room temperature unless otherwise stated, and the wells were washed with PBS containing Tween 20 (0.05% v/v) in between incubation steps.
2.6. Statistical analysis
Experimental results are shown as the Mean ± SEM. The differences between two groups were evaluated with 2-tailed Student’s t-test for continuous variables. Difference between groups were considered significant when p < 0.05 (two tailed). Associations between categorical variables were estimated with Pearson’s r coefficient.
3. Results
3.1. Deficiency of CD59 does not affect the plasma glucose levels achieved by STZ injection
To assess whether the deficiency of CD59 influences the development of diabetic CVD, we generated mCd59ab−/−/ApoE−/− and mCd59ab+/+/ApoE−/− mice. Introduction of ApoE−/− background was critical because most mouse strains are highly resistant to the development of atherosclerosis, a limitation that has been overcome by the molecular engineering of atherosclerosis prone mouse models such as the ApoE−/−, now a primary mouse model to study experimental atherosclerosis, as recommended by the AMDCC(Nakashima et al., 1994; Park et al., 1998). The generation of these mice (Qin et al., 2009) and their increased susceptibility to develop high fat diet-induced atherosclerosis was reported by us previously (Wu et al., 2009).
The work reported here was aimed at evaluating the role of CD59 in the development of diabetic CVD. For this reason, mice were fed a normal fat diet and were made diabetic by injection of multiple low doses of STZ, an antibiotic that causes pancreatic beta cell failure, generating an accepted model of type 1 diabetes in animals. The multiple low-dose STZ approach, also recommended by the AMDCC, was chosen because mice are relatively resistant to develop hyperglycemia after a single higher dose of STZ, and the higher dose may cause unintended tissue toxicity complicating the interpretation of results.
Both mCd59ab−/−/ApoE−/− and mCd59ab+/+/ApoE−/− mice developed hyperglycemia at comparable rates and achieved similar levels of blood glucose at the end of the 16-week duration of the experiment (Figure 1A). On the day of sacrifice, mean body weights of mice injected with STZ (both mCD59ab−/−/ApoE−/− and mCD59ab+/+/ApoE−/−) were ≈20% lower than those of control mice injected with only buffer. Weight loss is a well-known adverse effect STZ injection in mice (Graham et al., 2011). Importantly, body weights of the diabetic mCd59ab−/−/ApoE−/− and mCd59ab+/+/ApoE−/− at the time of sacrifice were not different (Figure 1B). These results indicate that the deficiency of CD59 does not affect the susceptibility of mice to develop hyperglycemia or adverse effects in response to STZ.
Figure 1. Blood glucose and body weight of mCd59ab−/−/ApoE−/− and mCD59ab+/+/ApoE−/− mice after STZ treatment.

(A) Average blood glucose level of diabetic mCd59ab−/−/ApoE−/− (n=12) and mCD59ab+/+/ApoE−/− mice (n=7) after STZ administration. (B) Body weight of STZ-treated mCd59ab−/−/ApoE−/− (n=12) and mCD59ab+/+/ApoE−/− mice (n=7) (diabetic); and of PBS-treated mCd59ab−/−/ApoE−/− (n=5) and mCD59ab+/+/ApoE−/− mice (n=5) (non-diabetic). *p <0.05.
3.2. CD59 Deficiency Accelerates Atherosclerosis in diabetic mice
Histological analysis of oil red-O stained “en face” aortas showed that diabetic mCd59ab−/−/ApoE−/− mice developed significantly larger atherosclerotic lesions than that of diabetic mCD59ab+/+/ApoE−/− mice (mean ± SEM: mCd59ab−/−/ApoE−/−: 7.5% ± 0.6; mCD59ab+/+/ApoE−/−: 3.6% ± 0.7; p < 0.005). Atherosclerotic lesions also developed in non-diabetic mCd59ab−/−/ApoE−/− and mCD59ab+/+/ApoE−/− mice, albeit at a much lower degree and with no evident difference between the two groups of non-diabetic mice (mean ± SEM: mCd59ab−/−/ApoE−/−: 1.6% ± 0.3; mCD59ab+/+/ApoE−/−: 1.4% ± 0.2) (Figure 2). Similarly, histological analysis of the aortic roots with either H&E or oil red-O staining showed significantly more atherosclerosis in diabetic mCd59ab−/−/ApoE−/− than in diabetic mCD59ab+/+/ApoE−/− mice (H&E: 26.2% ± 1.9 vs. 14.3% ± 1.1, respectively; p < 0.005. Oil red-O: 14.9% ± 1.1 vs. 7.8% ± 1.1, respectively; p < 0.05) (Figure 3A,B). Serum cholesterol levels were slightly higher in both groups of diabetic mice than in the non-diabetic counterparts but the lipid profiles were not significantly different between diabetic mCD59 deficient and mCD59 sufficient mice (Supplemental figure 1). Together, these results indicate that the deficiency of CD59 brings about an accelerated form of diabetes-induced atherosclerosis.
Figure 2. Development of atherosclerotic lesion in the aorta of mCd59ab−/−/ApoE−/− and mCD59ab+/+/ApoE−/− mice after STZ treatment.

Top: Representative images of en face aortas stained with oil red-O in mice form each experimental and control group 16 weeks after STZ injection. Scale bars, 2mm. Bottom: Quantification of atherosclerotic lesion areas in the en face aorta preparations in mice 16 weeks after the STZ injection. Lesion area (%) is (oil red-O stained area/total aortic area) ×100. *p <0.05, **p <0.005.
Figure 3. Development of atherosclerotic lesion in the aortic root of mCd59ab−/−/ApoE−/− and mCD59ab+/+/ApoE−/− mice after STZ treatment.
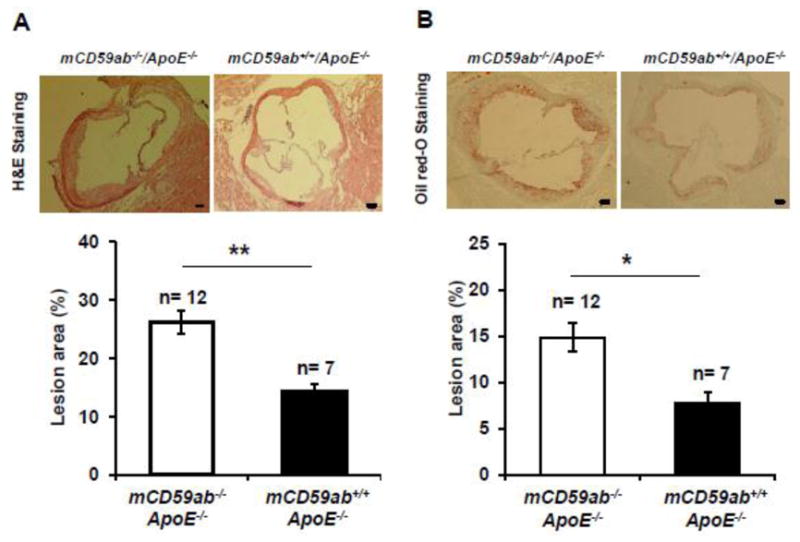
(A) Top: Representative images of H&E staining of aortic root preparations from diabetic mCd59ab−/−/ApoE−/− and mCD59ab+/+/ApoE−/−. Images were taken at 4X magnification. Scale bars, 100 μm. Bottom: Quantification of atherosclerotic lesion areas in the aortic roots. (B) Top: Representative images of Oil red-O staining of aortic root preparations from diabetic mCd59ab−/−/ApoE−/− and mCD59ab+/+/ApoE−/−. Images were taken at 4X magnification. Scale bars, 100 μm. Bottom: Quantification of atherosclerotic lesion areas in the aortic roots. Lesion area (%) is (staining positive area/ventricle area) X100. In all cases, the analysis was performed using mean values from three sections obtained from each mouse. *p <0.05, **p <0.005.
3.3. Accelerated atherosclerosis in diabetic mCD59ab−/−/ApoE−/− mice is associated with increased MAC deposition and macrophage infiltration
Since inhibition of MAC formation is the main function of CD59, we investigated MAC deposition in the atherosclerotic lesions of the aortic roots excised from the diabetic mice by staining with anti-C9 antibody. As expected, mCD59 deficient mice had more MAC deposition than their mCD59 sufficient counterpart, within both diabetic and non-diabetic groups (Figure 4). In parallel with the significantly increased atherosclerosis shown in Figures 3, diabetic mCd59ab−/−/ApoE−/− mice had significantly larger MAC staining area in the aortic roots than diabetic mCD59ab+/+/ApoE−/− mice (6.8% ± 0.8 vs. 3.0% ± 0.7, respectively; p < 0.005). Diabetic mCd59ab−/−/ApoE−/− mice also exhibited a significantly higher macrophage infiltrate in the lesions than that of diabetic mCD59ab+/+/ApoE−/− mice (31.5% ± 3.7 vs. 16.4% ± 3.0, respectively; p < 0.05, Figure 5). No staining for MAC deposition or macrophage infiltration was observed using secondary antibody alone (Supplemental figure 2A and 2B, respectively). These results indicate that MAC likely plays a critical role in the pathogenesis of diabetic atherosclerosis.
Figure 4. C9 deposition in atherosclerotic lesions of diabetic and non-diabetic mCd59ab−/−/ApoE−/− and mCD59ab+/+/ApoE−/− mice.

Left: Representative images of C9 deposition in aortic roots of diabetic and non-diabetic mCd59ab−/−/ApoE−/− and mCD59ab+/+/ApoE−/− mice 16 weeks after STZ injection. Images were taken at 4X magnification. Scale bars, 100 μm. Right: Quantification of C9 deposition in aortic roots was done as percentage (%) of positive area vs. lesion area. In all cases, the analysis was performed using mean values from three sections obtained from each mouse. *p <0.05, **p <0.005.
Figure 5. Macrophage infiltration in atherosclerotic lesions of diabetic mCd59ab−/−/ApoE−/− and mCD59ab+/+/ApoE−/− mice.
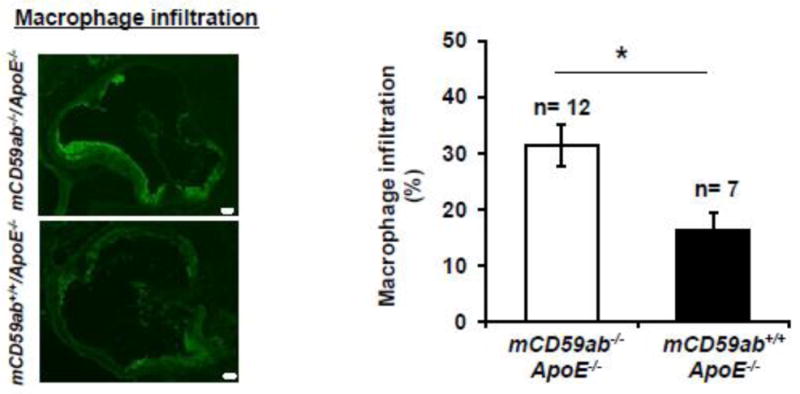
Left: Representative images of macrophage infiltration in aortic roots of diabetic mCd59ab−/−/ApoE−/− and mCD59ab+/+/ApoE−/− mice 16 weeks after STZ injection. Images were taken at 4X magnification. Scale bars, 100 μm. Right: Quantification of macrophage infiltration in aortic roots was done as percentage (%) of positive area vs. lesion area. In all cases, the analysis was performed using mean values from three sections obtained from each mouse. *p <0.05.
3.4. Diabetes increases activation of complement
An interesting observation from the experiments depicted in Figure 4 was that aortic roots of diabetic mCd59ab−/−/ApoE−/− mice showed significantly higher MAC staining than non-diabetic mCd59ab−/−/ApoE−/− (p < 0.05; Figure 4). One interpretation of this result is that the presence of diabetes itself contributed to increased MAC deposition because diabetes also activates the complement system. This interpretation was investigated measuring levels of iC3b in serum of STZ-induced diabetic mice. Serum levels of iC3b, a product of the proteolytic cleavage of C3b, increase as a consequence of complement activation and is an accepted parameter to assess complement activation in experimental animals (Kotimaa et al., 2015). Supplemental figure 3 shows that serum levels of iC3b were increased by 40% (p < 0.05) even in mCD59ab+/+/ApoE−/− mice as early as 2 weeks after STZ treatment as compared with their non-diabetic counterparts. Consistent with increased complement activation in the hyperglycemic as compared with normoglycemic mice, staining of aortic root sections showed significantly increased deposition of immunoreactive iC3b in the hyperglycemic mice (Supplemental figure 4). These results imply that diabetes itself can cause activation of complement system and explain the increased MAC deposition in diabetic as compared with non-diabetic mCd59ab−/−/ApoE−/− mice.
4. Discussion
This study demonstrates that the systemic deficiency of the complement regulatory protein CD59 renders ApoE−/− mice much more sensitive to the development of accelerated atherosclerosis in response to hyperglycemia. Sixteen weeks after injection of STZ to induce Type 1-like diabetes, mCD59 deficient (mCd59ab−/−/ApoE−/−) mice had ≈ 100% larger lesion areas in both the aortic surface (en face preparation) and in the aortic roots than their diabetic mCD59 sufficient (mCd59a+/+/ApoE−/−) counterparts. The magnitude of increased atherosclerotic vascular damage developed in diabetic mCd59ab−/−/ApoE−/− mice exceeds by far the 25% difference used by the AMDCC to define the development of atherosclerosis as “accelerated”. The increased level of atherosclerosis in diabetic mCD59 deficient mice was comparable to that of mCD59 sufficient mice that were fed with the atherogenic high fat diet for 2 months (Wu et al., 2009). Indeed, serum levels of cholesterol and triglycerides in the diabetic mCd59ab−/− mice were not significantly higher than in their diabetic mCd59ab+/+/ApoE−/− counterparts and, in fact, cholesterol levels were ≈ 40% lower than those observed in the same animals fed a high fat diet, as reported by us in (Wu et al., 2009).
Our present results provide strong evidence to our hypothesis that inactivation of CD59 in individuals with diabetes promotes the development of accelerated atherosclerosis associated with hyperglycemia. The experimental work reported here required the physical absence of mCD59, rather than its inactivation, because mouse CD59 does not exhibit the glycation motif present in the human CD59 protein and, therefore, is not sensitive to inactivation by glycation (Acosta et al., 2000; Bodian et al., 1997). The absence of the glycation motif in CD59 from other animal species other than humans is quite remarkable considering that animals in general and mice in particular are resistant to develop complications of diabetes with the intensity and distribution seen in humans. This difference in the susceptibility to develop diabetes complications cannot be fully explained by the chronic, long term nature of those complications because it is well known that animals develop diseases in time intervals proportional to their life-spans.
Previous experimental work form our laboratory has demonstrated the agonist effect of the MAC and antagonist effect of CD59 in the development of atherosclerosis in mCD59−/−/ApoE−/− mice fed a high fat diet (Wu et al., 2009). It is noteworthy that the diabetic mice used in this work were fed a normal fat diet to isolate hyperglycemia as the only stressor inducing vascular damage. The extent of MAC deposition exhibited a strong positive correlation with the extent of a) atherosclerotic lesion areas in the aortic root (Pearson’s r 0.6), b) atherosclerotic lesion areas in the “en face” aorta preparation (Pearson’s r 0.7), and c) macrophage infiltration in the aortic root (Pearson’s r 0.42). Even though this association does not directly prove causation, it strongly suggests that MAC deposition plays a critical role in the development of diabetic atherosclerosis. This conclusion is based not only on the experimental results shown in Figures 2, 3 and 4, but also on the extensive experimental evidence that the MAC induces the release of an array of growth factors and cytokines able to promote inflammation with macrophage infiltration and cell proliferation, as characteristically seen in atherosclerotic lesions. We have also shown that the MAC directly stimulates cholesterol accumulation in macrophages and formation of foam cells (Wu et al., 2009).
mCD59 deficient (mCD59ab−/−/ApoE−/−) mice exhibited more MAC deposition than their CD59 sufficient (mCD59ab+/+/ApoE−/−) counterparts, as expected from the physical deficiency of CD59 (Figure 4). An interesting finding, however, is that MAC deposition was significantly increased when mCD59ab−/− deficient littermates were rendered diabetic. Since the only major difference between the diabetic and non-diabetic mCD59 deficient mice is the presence of hyperglycemia in those injected with STZ, this experimental observation suggested that diabetes itself may be a stressor that induces complement activation and MAC formation, and this effect is less evident in mCD59 sufficient mice because of the overriding presence of CD59 (Figure 4). This interpretation was confirmed by measuring iC3b in serum from STZ-induced diabetic mCD59ab+/+/ApoE−/− mice. iC3b levels were measured early (2–3 weeks) in the development of experimental diabetes to avoid confounding effects potentially derived from organ/tissue lesions (e.g. atherosclerotic) like those depicted in Figures 2 and 3. There are different ways by which hyperglycemia can reportedly activate the complement cascades: autoantibodies to glycated and glycol-oxydated proteins can activate the classical pathway (Orchard et al., 1999; Uesugi et al., 2004), fructosamines, the stable products of the non-enzymatic attachment of glucose to ε-amino groups in proteins, activate the MBL pathway by increasing ligand-receptor binding (Fortpied et al., 2010), and increased AGEs on the arterial walls serve as neo-epitopes for MBL binding and activation (Flyvbjerg, 2010). Because CD59 is an inhibitor of MAC formation, MAC deposition due to diabetes-induced complement activation would be more pronounced and readily detected in mCD59ab−/− mice due to the physical absence of CD59. This experimental evidence indicative of complement activation in diabetes is consistent with other human studies showing deposition of activated complement proteins in target organs of diabetes complications(Falk et al., 1987; Rosoklija et al., 2000; Zhang et al., 2002) or that high blood levels of soluble MAC complexes as a predictor of risk of a subsequent cardiovascular event in individuals with diabetes (Mellbin et al., 2012)
Similar to other tightly regulated biological systems, phenotypic endpoints like MAC deposition and other downstream effects of complement activation depend on the delicate balance between complement activators and inhibitors. This “delicate balance” paradigm is well exemplified by the human disease known as Paroxysmal Nocturnal Hemoglobinuria (PNH), a hemolytic anemia in which bone-marrow derived cells lack GPI-anchored proteins such as CD59 (Parker, 1996). Under “normal” conditions, the basal “tick-over” activation of complement is sufficient to induce only mild degree of hemolysis. In contrast, when stressors like infections amplify complement activation, patients suffer “paroxysmal” crises of hemolysis with hemoglobinuria, platelet activation and potentially lethal thrombotic episodes (Hill et al., 2013). Similarly, systemic absence of CD59 due to gene mutations is reportedly associated with vascular or neuropathic disease (Nevo et al., 2013). From the results of the work reported here, it is tempting to propose that the “delicate balance” paradigm between complement activation and restriction could be also operative in the tissue damage caused by diabetes: on one hand deficiency of CD59 through gene deletion, as in the mCD59ab−/− mice reported in this paper, or through its inactivation by glycation, as in individuals with diabetes (Acosta et al., 2000; Qin et al., 2004), and on the other activation of the complement system by hyperglycemia (Flyvbjerg, 2010; Fortpied et al., 2010; Uesugi et al., 2004). Complement-dependent and complement-independent mechanisms (reviewed in (Brownlee, 2001)) of tissue damage by hyperglycemia would act together, perhaps synergistically, to promote proliferation, inflammation and thrombosis as characteristically seen in the target organs of diabetic complications (summarized in Supplemental Figure 5).
Supplementary Material
Acknowledgments
Source of Funding:
This work was supported by the National Heart, Lung, and Blood Institute of the National Institute of Heath grant HL107762 to JAH.
Abbreviations
- CVD
Cardio Vascular Disease
- MAC
Membrane Attack Complex
- STZ
Streptozotocin
- ApoE
Apolipoprotein E
- mCD59ab
mouse CD59a and CD59b
Footnotes
Publisher's Disclaimer: This is a PDF file of an unedited manuscript that has been accepted for publication. As a service to our customers we are providing this early version of the manuscript. The manuscript will undergo copyediting, typesetting, and review of the resulting proof before it is published in its final citable form. Please note that during the production process errors may be discovered which could affect the content, and all legal disclaimers that apply to the journal pertain.
References
- Acosta J, Hettinga J, Fluckiger R, Krumrei N, Goldfine A, Angarita L, Halperin J. Molecular basis for a link between complement and the vascular complications of diabetes. Proc Natl Acad Sci U S A. 2000;97:5450–5455. doi: 10.1073/pnas.97.10.5450. [DOI] [PMC free article] [PubMed] [Google Scholar]
- An G, Miwa T, Song WL, Lawson JA, Rader DJ, Zhang Y, Song WC. CD59 but not DAF deficiency accelerates atherosclerosis in female ApoE knockout mice. Mol Immunol. 2009;46:1702–1709. doi: 10.1016/j.molimm.2009.02.009. [DOI] [PMC free article] [PubMed] [Google Scholar]
- Biro A, Thielens NM, Cervenak L, Prohaszka Z, Fust G, Arlaud GJ. Modified low density lipoproteins differentially bind and activate the C1 complex of complement. Mol Immunol. 2007;44:1169–1177. doi: 10.1016/j.molimm.2006.06.013. [DOI] [PubMed] [Google Scholar]
- Bodian DL, Davis SJ, Morgan BP, Rushmere NK. Mutational analysis of the active site and antibody epitopes of the complement-inhibitory glycoprotein, CD59. J Exp Med. 1997;185:507–516. doi: 10.1084/jem.185.3.507. [DOI] [PMC free article] [PubMed] [Google Scholar]
- Brownlee M. Biochemistry and molecular cell biology of diabetic complications. Nature. 2001;414:813–820. doi: 10.1038/414813a. [DOI] [PubMed] [Google Scholar]
- DCCT. Diabetes Control and Complications Trial (DCCT). Update. DCCT Research Group. Diabetes Care. 1990;13:427–433. doi: 10.2337/diacare.13.4.427. [DOI] [PubMed] [Google Scholar]
- De Pergola G, Ciccone MM, Guida P, Morea G, Giannuzzo E, Cortese F, Scicchitano P, Favale S, Silvestris F. Relationship between C3 levels and common carotid intima-media thickness in overweight and obese patients. Obesity facts. 2011;4:159–163. doi: 10.1159/000327893. [DOI] [PMC free article] [PubMed] [Google Scholar]
- Emin M, Wang G, Castagna F, Rodriguez-Lopez J, Wahab R, Wang J, Adams T, Wei Y, Jelic S. Increased internalization of complement inhibitor CD59 may contribute to endothelial inflammation in obstructive sleep apnea. Science translational medicine. 2016;8:320ra321. doi: 10.1126/scitranslmed.aad0634. [DOI] [PMC free article] [PubMed] [Google Scholar]
- Falk RJ, Sisson SP, Dalmasso AP, Kim Y, Michael AF, Vernier RL. Ultrastructural localization of the membrane attack complex of complement in human renal tissues. Am J Kidney Dis. 1987;9:121–128. doi: 10.1016/s0272-6386(87)80089-6. [DOI] [PubMed] [Google Scholar]
- Flyvbjerg A. Diabetic angiopathy, the complement system and the tumor necrosis factor superfamily. Nat Rev Endocrinol. 2010;6:94–101. doi: 10.1038/nrendo.2009.266. [DOI] [PubMed] [Google Scholar]
- Fortpied J, Vertommen D, Van Schaftingen E. Binding of mannose-binding lectin to fructosamines: a potential link between hyperglycaemia and complement activation in diabetes. Diabetes Metab Res Rev. 2010;26:254–260. doi: 10.1002/dmrr.1079. [DOI] [PubMed] [Google Scholar]
- Ghosh P, Sahoo R, Vaidya A, Cantel S, Kavishwar A, Goldfine A, Herring N, Bry L, Chorev M, Halperin JA. A specific and sensitive assay for blood levels of glycated CD59: a novel biomarker for diabetes. Am J Hematol. 2013;88:670–676. doi: 10.1002/ajh.23478. [DOI] [PMC free article] [PubMed] [Google Scholar]
- Ghosh P, Sahoo R, Vaidya A, Chorev M, Halperin JA. Role of complement and complement regulatory proteins in the complications of diabetes. Endocr Rev. 2015;36:272–288. doi: 10.1210/er.2014-1099. [DOI] [PMC free article] [PubMed] [Google Scholar]
- Ghosh P, Vaidya A, Sahoo R, Goldfine A, Herring N, Bry L, Chorev M, Halperin JA. Glycation of the complement regulatory protein CD59 is a novel biomarker for glucose handling in humans. J Clin Endocrinol Metab. 2014 doi: 10.1210/jc.2013-4232. jc20134232. [DOI] [PMC free article] [PubMed] [Google Scholar]
- Graham ML, Janecek JL, Kittredge JA, Hering BJ, Schuurman HJ. The streptozotocin-induced diabetic nude mouse model: differences between animals from different sources. Comparative medicine. 2011;61:356–360. [PMC free article] [PubMed] [Google Scholar]
- Hansson GK, Lagerstedt E, Bengtsson A, Heideman M. IgG binding to cytoskeletal intermediate filaments activates the complement cascade. Exp Cell Res. 1987;170:338–350. doi: 10.1016/0014-4827(87)90311-9. [DOI] [PubMed] [Google Scholar]
- Hertle E, Stehouwer CD, van Greevenbroek MM. The complement system in human cardiometabolic disease. Mol Immunol. 2014;61:135–148. doi: 10.1016/j.molimm.2014.06.031. [DOI] [PubMed] [Google Scholar]
- Hill A, Kelly RJ, Hillmen P. Thrombosis in paroxysmal nocturnal hemoglobinuria. Blood. 2013;121:4985–4996. doi: 10.1182/blood-2012-09-311381. quiz 5105. [DOI] [PubMed] [Google Scholar]
- Hovind P, Hansen TK, Tarnow L, Thiel S, Steffensen R, Flyvbjerg A, Parving HH. Mannose-binding lectin as a predictor of microalbuminuria in type 1 diabetes: an inception cohort study. Diabetes. 2005;54:1523–1527. doi: 10.2337/diabetes.54.5.1523. [DOI] [PubMed] [Google Scholar]
- Hsueh W, Abel ED, Breslow JL, Maeda N, Davis RC, Fisher EA, Dansky H, McClain DA, McIndoe R, Wassef MK, Rabadan-Diehl C, Goldberg IJ. Recipes for creating animal models of diabetic cardiovascular disease. Circ Res. 2007;100:1415–1427. doi: 10.1161/01.RES.0000266449.37396.1f. [DOI] [PubMed] [Google Scholar]
- Jarrett RJ, McCartney P, Keen H. The Bedford survey: ten year mortality rates in newly diagnosed diabetics, borderline diabetics and normoglycaemic controls and risk indices for coronary heart disease in borderline diabetics. Diabetologia. 1982;22:79–84. doi: 10.1007/BF00254833. [DOI] [PubMed] [Google Scholar]
- Kotimaa JP, van Werkhoven MB, O’Flynn J, Klar-Mohamad N, van Groningen J, Schilders G, Rutjes H, Daha MR, Seelen MA, van Kooten C. Functional assessment of mouse complement pathway activities and quantification of C3b/C3c/iC3b in an experimental model of mouse renal ischaemia/reperfusion injury. J Immunol Methods. 2015;419:25–34. doi: 10.1016/j.jim.2015.02.010. [DOI] [PubMed] [Google Scholar]
- Liu F, Ge X, Sahoo R, Qin X, Halperin J. The deficiency of CD59 accelerates the development of diabetic atherosclerosis in mice. Mo Immunol. 2014;61:223. [Google Scholar]
- Markiewski MM, Mastellos D, Tudoran R, DeAngelis RA, Strey CW, Franchini S, Wetsel RA, Erdei A, Lambris JD. C3a and C3b activation products of the third component of complement (C3) are critical for normal liver recovery after toxic injury. J Immunol. 2004;173:747–754. doi: 10.4049/jimmunol.173.2.747. [DOI] [PubMed] [Google Scholar]
- Mastellos D, Prechl J, Laszlo G, Papp K, Olah E, Argyropoulos E, Franchini S, Tudoran R, Markiewski M, Lambris JD, Erdei A. Novel monoclonal antibodies against mouse C3 interfering with complement activation: description of fine specificity and applications to various immunoassays. Mol Immunol. 2004;40:1213–1221. doi: 10.1016/j.molimm.2003.10.019. [DOI] [PubMed] [Google Scholar]
- Mellbin LG, Bjerre M, Thiel S, Hansen TK. Complement activation and prognosis in patients with type 2 diabetes and myocardial infarction: a report from the DIGAMI 2 trial. Diabetes Care. 2012;35:911–917. doi: 10.2337/dc11-1642. [DOI] [PMC free article] [PubMed] [Google Scholar]
- Morgan BP. Complement regulatory molecules: application to therapy and transplantation. Immunol Today. 1995;16:257–259. doi: 10.1016/0167-5699(95)80175-8. [DOI] [PubMed] [Google Scholar]
- Morgan BP, Harris CL. Complement Regulatory Proteins. Academic Press; London: 1999. [Google Scholar]
- Nakashima Y, Plump AS, Raines EW, Breslow JL, Ross R. ApoE-deficient mice develop lesions of all phases of atherosclerosis throughout the arterial tree. Arterioscler Thromb. 1994;14:133–140. doi: 10.1161/01.atv.14.1.133. [DOI] [PubMed] [Google Scholar]
- Nevo Y, Ben-Zeev B, Tabib A, Straussberg R, Anikster Y, Shorer Z, Fattal-Valevski A, Ta-Shma A, Aharoni S, Rabie M, Zenvirt S, Goldshmidt H, Fellig Y, Shaag A, Mevorach D, Elpeleg O. CD59 deficiency is associated with chronic hemolysis and childhood relapsing immune-mediated polyneuropathy. Blood. 2013;121:129–135. doi: 10.1182/blood-2012-07-441857. [DOI] [PubMed] [Google Scholar]
- Nicholson-Weller A, March JP, Rosen CE, Spicer DB, Austen KF. Surface membrane expression by human blood leukocytes and platelets of decay-accelerating factor, a regulatory protein of the complement system. Blood. 1985;65:1237–1244. [PubMed] [Google Scholar]
- Orchard TJ, Virella G, Forrest KY, Evans RW, Becker DJ, Lopes-Virella MF. Antibodies to oxidized LDL predict coronary artery disease in type 1 diabetes: a nested case-control study from the Pittsburgh Epidemiology of Diabetes Complications Study. Diabetes. 1999;48:1454–1458. doi: 10.2337/diabetes.48.7.1454. [DOI] [PubMed] [Google Scholar]
- Park L, Raman KG, Lee KJ, Lu Y, Ferran LJ, Jr, Chow WS, Stern D, Schmidt AM. Suppression of accelerated diabetic atherosclerosis by the soluble receptor for advanced glycation endproducts. Nat Med. 1998;4:1025–1031. doi: 10.1038/2012. [DOI] [PubMed] [Google Scholar]
- Parker CJ. Molecular basis of paroxysmal nocturnal hemoglobinuria. Stem Cells. 1996;14:396–411. doi: 10.1002/stem.140396. [DOI] [PubMed] [Google Scholar]
- Podack ER. Molecular composition of the tubular structure of the membrane attack complex of complement. J Biol Chem. 1984;259:8641–8647. [PubMed] [Google Scholar]
- Qin X, Goldfine A, Krumrei N, Grubissich L, Acosta J, Chorev M, Hays AP, Halperin JA. Glycation inactivation of the complement regulatory protein CD59: a possible role in the pathogenesis of the vascular complications of human diabetes. Diabetes. 2004;53:2653–2661. doi: 10.2337/diabetes.53.10.2653. [DOI] [PubMed] [Google Scholar]
- Qin X, Hu W, Song W, Grubissich L, Hu X, Wu G, Ferris S, Dobarro M, Halperin JA. Generation and phenotyping of mCd59a and mCd59b double-knockout mice. Am J Hematol. 2009;84:65–70. doi: 10.1002/ajh.21319. [DOI] [PMC free article] [PubMed] [Google Scholar]
- Rosoklija GB, Dwork AJ, Younger DS, Karlikaya G, Latov N, Hays AP. Local activation of the complement system in endoneurial microvessels of diabetic neuropathy. Acta Neuropathol (Berl) 2000;99:55–62. doi: 10.1007/pl00007406. [DOI] [PubMed] [Google Scholar]
- Rus HG, Niculescu F, Constantinescu E, Cristea A, Vlaicu R. Immunoelectron-microscopic localization of the terminal C5b-9 complement complex in human atherosclerotic fibrous plaque. Atherosclerosis. 1986;61:35–42. doi: 10.1016/0021-9150(86)90111-5. [DOI] [PubMed] [Google Scholar]
- Schmiedt W, Kinscherf R, Deigner HP, Kamencic H, Nauen O, Kilo J, Oelert H, Metz J, Bhadki S. Complement C6 deficiency protects against diet-induced atherosclerosis in rabbits. Arterioscler Thromb Vasc Biol. 1998;18:1790–1795. doi: 10.1161/01.atv.18.11.1790. [DOI] [PubMed] [Google Scholar]
- Tominaga M, Eguchi H, Manaka H, Igarashi K, Kato T, Sekikawa A. Impaired glucose tolerance is a risk factor for cardiovascular disease, but not impaired fasting glucose. The Funagata Diabetes Study. Diabetes Care. 1999;22:920–924. doi: 10.2337/diacare.22.6.920. [DOI] [PubMed] [Google Scholar]
- Uesugi N, Sakata N, Nangaku M, Abe M, Horiuchi S, Hisano S, Iwasaki H. Possible mechanism for medial smooth muscle cell injury in diabetic nephropathy: glycoxidation-mediated local complement activation. Am J Kidney Dis. 2004;44:224–238. doi: 10.1053/j.ajkd.2004.04.027. [DOI] [PubMed] [Google Scholar]
- Woroniecka KI, Park AS, Mohtat D, Thomas DB, Pullman JM, Susztak K. Transcriptome analysis of human diabetic kidney disease. Diabetes. 2011;60:2354–2369. doi: 10.2337/db10-1181. [DOI] [PMC free article] [PubMed] [Google Scholar]
- Wu G, Hu W, Shahsafaei A, Song W, Dobarro M, Sukhova GK, Bronson RR, Shi GP, Rother RP, Halperin JA, Qin X. Complement regulator CD59 protects against atherosclerosis by restricting the formation of complement membrane attack complex. Circ Res. 2009;104:550–558. doi: 10.1161/CIRCRESAHA.108.191361. [DOI] [PMC free article] [PubMed] [Google Scholar]
- Yamashina M, Ueda E, Kinoshita T, Takami T, Ojima A, Ono H, Tanaka H, Kondo N, Orii T, Okada N, et al. Inherited complete deficiency of 20-kilodalton homologous restriction factor (CD59) as a cause of paroxysmal nocturnal hemoglobinuria. N Engl J Med. 1990;323:1184–1189. doi: 10.1056/NEJM199010253231707. [DOI] [PubMed] [Google Scholar]
- Yun S, V, Leung W, Botto M, Boyle JJ, Haskard DO. Brief report: accelerated atherosclerosis in low-density lipoprotein receptor-deficient mice lacking the membrane-bound complement regulator CD59. Arterioscler Thromb Vasc Biol. 2008;28:1714–1716. doi: 10.1161/ATVBAHA.108.169912. [DOI] [PubMed] [Google Scholar]
- Zhang J, Gerhardinger C, Lorenzi M. Early complement activation and decreased levels of glycosylphosphatidylinositol-anchored complement inhibitors in human and experimental diabetic retinopathy. Diabetes. 2002;51:3499–3504. doi: 10.2337/diabetes.51.12.3499. [DOI] [PubMed] [Google Scholar]
Associated Data
This section collects any data citations, data availability statements, or supplementary materials included in this article.