Summary
Clinical and epidemiological studies indicate that obesity affects the development and phenotype of asthma by inducing inflammatory mechanisms in addition to eosinophilic inflammation. The aim of this study was to assess the effect of obesity on allergic airway inflammation and T helper type 2 (Th2) immune responses using an experimental model of asthma in BALB/c mice. Mice fed a high‐fat diet (HFD) for 10 weeks were sensitized and challenged with ovalbumin (OVA), and analyses were performed at 24 and 48 h after the last OVA challenge. Obesity induced an increase of inducible nitric oxide synthase (iNOS)‐expressing macrophages and neutrophils which peaked at 48 h after the last OVA challenge, and was associated with higher levels of interleukin (IL)‐4, IL‐9, IL‐17A, leptin and interferon (IFN)‐γ in the lungs. Higher goblet cell hyperplasia was associated with elevated mast cell influx into the lungs and trachea in the obese allergic mice. In contrast, early eosinophil influx and lower levels of IL‐25, thymic stromal lymphopoietin (TSLP), CCL11 and OVA‐specific immunoglobulin (IgE) were observed in the obese allergic mice in comparison to non‐obese allergic mice. Moreover, obese mice showed higher numbers of mast cells regardless of OVA challenge. These results indicate that obesity affects allergic airway inflammation through mechanisms involving mast cell influx and the release of TSLP and IL‐25, which favoured a delayed immune response with an exacerbated Th1, Th2 and Th17 profile. In this scenario, an intense mixed inflammatory granulocyte influx, classically activated macrophage accumulation and intense mucus production may contribute to a refractory therapeutic response and exacerbate asthma severity.
Keywords: asthma, BALB/c mice, eosinophils, high‐fat diet, neutrophils, obesity
Introduction
Asthma is a chronic disease in the lungs characterized by airway hyperresponsiveness (AHR), variable degrees of airflow obstruction and pulmonary inflammation. The prevalence of asthma has increased consistently in the last decade, with approximately 300 million adults and children affected by this disease worldwide 1. Lifestyle changes and genetic predisposition are suggested to be associated with the increased incidence of asthma, mainly in westernized countries 1. Classically, T helper type 2 (Th2) cells play a predominant role in the pathogenesis of asthma by the release of interleukin (IL)‐4, IL‐5, IL‐9 and IL‐13 cytokines. These mediators contribute to the clinical features of asthma by triggering immunoglobulin (Ig)E production, eosinophilic inflammation, mucus hypersecretion and bronchial hyperreactivity 2. In addition, studies have identified that early dysfunction of the airway epithelium after allergic stimuli promotes the Th2 immune response 3, 4 through the release of IL‐25, IL‐33 and thymic stromal lymphopoietin (TSLP). These cytokines take part in the activation of type 2 innate lymphoid (ILC2) and dendritic cells, thereby promoting the secretion of high amounts of IL‐5 and IL‐13 contributing to eosinophilic airway inflammation 5. However, asthma is a heterogeneous disease involving many pathways, leading to several clinical phenotypes associated with a different inflammatory response 2. Moreover, non‐Th2 factors such as interferon (IFN)‐γ, IL‐17 and neutrophils are often related to severe phenotypes of asthma and resistance to corticosteroid treatment 6, 7, 8.
Currently, obesity is recognized as an important risk factor of asthma. Moreover, obesity worsens the symptoms of asthma and reduces the response of patients with asthma to conventional treatments 9, 10, 11. Adult obese asthmatics frequently develop an immune response that is distinct from the classical Th2 allergic response and is characterized instead by lower serum IgE levels and fewer numbers of eosinophils in the sputum 9, 12. Although the mechanisms underlying this association have not yet been elucidated completely, it has been suggested that obesity‐associated inflammation induces the development of the characteristic clinical phenotypes that are observed in obese‐asthmatic individuals 13, 14.
The prevalence of obesity, defined as a body mass index (BMI) of ≥ 30 kg/m2, has been largely increasing during the last two decades. Consumption of a high‐fat diet (HFD) induces an imbalance in fatty acids flow, leading to adipocyte hypertrophy and hyperplasia. These events induce abnormal adipose tissue accumulation and leptin resistance 15. In addition, changes in the adipose tissue trigger the influx of mast cells, M1 macrophages and CD8+ T lymphocytes that secrete inflammatory cytokines such as IL‐1β, IL‐6, IFN‐γ and tumour necrosis factor (TNF)‐α, which induce the low‐degree systemic inflammation observed typically in obese individuals. In contrast, the numbers of immune cells such as eosinophils, ILC2 and alternatively activated macrophages involved in adipose homeostasis are reduced in the obese state 16.
Studies involving animal models support the association between obesity and asthma; however, these studies have provided conflicting results, due probably to the use of different protocols and mouse strains for inducing both diseases 17, 18, 19. A study employing obesity‐prone C57BL/6 mice indicated that obesity exacerbates the asthma pathology via a Th2 immune response mechanism 17, which was not supported by other studies 18, 20. BALB/c mice represent an intermediate phenotype between the obesity‐prone and resistant strain. This mouse strain presents moderate gain weight 21, but shows a high body adiposity index and production of inflammatory cytokines 22, 23. However, few reports have assessed immune responses in the lungs of BALB/c mice with concomitant diet‐induced obesity and ovalbumin (OVA)‐induced asthma 24. Therefore, in the present study, a BALB/c experimental model for allergic airway disease was used to evaluate the effects of HFD‐induced obesity on the immune responses in OVA‐induced pulmonary allergy.
Materials and methods
Mice
Female BALB/c mice (aged 4–5 weeks) were obtained from the Federal University of Juiz de Fora (UFJF). All mice were maintained in a temperature‐controlled facility with a 12‐h light/dark cycle and were given free access to the diet. The mice were fed a standard chow for 1 week before initiating the study protocol. All animal experiments were performed in accordance with the principles of the Brazilian Code for the Use of Laboratory Animals and were approved by the UFJF Ethics Committee for the Use of Laboratory Animals (CEEA–UFJF No. 094/2012).
Induction of obesity and pulmonary allergy
Initially, BALB/c mice were divided randomly into two groups according to their diets during the 10‐week study period: mice in the control (CN) group received a standard diet (10% calories from fat, Nuvilab‐CR1®; Nuvital Nutrientes Ltd, Colombo, Brazil), and mice in the obesity (OB) group received the HFD (60% calories from fat; Prag Soluções Ind. Co. Ltd Jau, SP. Brazil). The two diets contained similar quantities of protein, cellulose, soybean oil, vitamins and minerals per calorie. Food intake and weight of the mice were measured twice and once a week, respectively. Pulmonary allergy was induced at 6 weeks after the initiation of diet consumption. The mice were subdivided into the following four groups: control group (CN), obese group (OB), pulmonary allergy group (PA) and obese pulmonary allergy group (OB/PA). Six and 8 weeks after initiation of the dietary regimen, mice in the allergy groups were sensitized intraperitoneally (i.p.) with 3 μg OVA (grade V; Sigma‐Aldrich Corp., St Louis, MO, USA) in 1 mg alum (Sigma‐Aldrich) and were challenged with aerosolized 1% OVA for 20 min at 21, 23, 25, 27 and 29 days after the first sensitization. The mice were euthanized and samples were collected at 24 and 48 h after the last OVA challenge. Body mass (BM) and body length (BL) (distance from the tip of the nose to the base of the tail) were determined, and BMI was calculated as BM (g)/BL (cm2) 25.
Evaluation of biochemical parameters
Blood was collected at 24 h after the last OVA challenge. Serum separated from the blood samples was used for measuring total cholesterol, high‐density lipoprotein (HDL), low‐density lipoprotein (LDL) and triglyceride levels by a colorimetric enzymatic method. Serum levels of TNF‐α and leptin were determined using commercially available enzyme‐linked immunoassay (ELISA) kits (OptEIA; BD Bioscience, San Jose, CA, USA and R&D Systems, Minneapolis, MN, USA, respectively), according to the manufacturer's instructions. Serum levels of anti‐OVA‐specific IgE were determined by optical density measured at 492 nm using a microplate reader (SpectraMax 190; Molecular Devices, Sunnyvale, CA, USA).
Determination of cell count in the bronchoalveolar lavage fluid (BALF) and bone marrow (BM)
Total leucocyte counts in the BALF and BM were determined using a Neubauer chamber. Cytospin slides were stained with Diff‐Quick stain (Laborclin Ltda, Pinhais, Brazil) to determine the differential cell count (Fanem 248, Brazil), considering 300 nucleated cells.
Histological evaluation of the pulmonary tissue
The inflammatory scores of periodic acid‐Schiff (PAS) staining of goblet cells and haematoxylin and eosin (H&E) staining were evaluated as described previously 26. Mast cells were quantified in pulmonary tissue sections stained with toluidine blue and eosinophils were quantified per 100‐μm2 field in the peribroncovascular area with Direct Red 80 staining (Sigma‐Aldrich). Cells were examined in a blinded manner under an optical microscope (Zeiss, Hallbergmoos, Germany) at ×400 (mast cells) and ×1000 (eosinophils) magnifications.
Immunohistochemical staining of inducible nitric oxide synthase (iNOS), arginase and myeloperoxidase (MPO)
Pulmonary tissue sections were deparaffinized and rehydrated in a graded ethanol series, and antigens were retrieved in citrate buffer (pH 6). The sections were blocked with serum and exposed to goat polyclonal arginase I antibody (1 : 100, sc 18351) or rabbit polyclonal iNOS antibody (1 : 500, sc 8310; Santa Cruz Biotechnology, Inc., Santa Cruz, CA, USA). The presence of MPO granules in the cytoplasm of neutrophils was quantified using 3 µg/ml goat polyclonal MPO antibody (AF 3667; R&D Systems). The tissue sections were then treated with biotin‐conjugated secondary antibodies (Santa Cruz Biotechnology, Inc.), followed by treatment with peroxidase‐conjugated streptavidin complex (Santa Cruz Biotechnology, Inc.). Positively stained cells were detected using the peroxidase substrate 3,3‐diaminobenzidine (Sigma‐Aldrich), with haematoxylin (Sigma‐Aldrich) as the counterstain. Cells showing positivity for iNOS, arginase or MPO were quantified in 100‐μm2 fields in the peribronchovascular area and were examined in a blinded manner under an optical microscope (Zeiss) at ×1000 magnification.
Analysis of eosinophil peroxidase (EPO) and MPO activities in lung homogenates
EPO activity in the pulmonary tissue was evaluated as described previously 26. MPO activity was determined by mixing 100 μl of the sample with 100 μl of 6 mM O‐phenylenediamine (OPD) solution in 10 mM citrate (pH = 4·5), followed by the addition of 20% H2O2. After 30 min, the reaction was stopped by adding 50 μl of 1 M H2SO4, and the absorbance was measured at 492 nm on a microplate reader (SpectraMax 190).
Measurement of cytokine and chemokine levels in the lungs
The lung tissue homogenate was prepared as described previously 26. Commercially available ELISA kits were used to determine the levels of IL‐4, IL‐5, IL‐6, IL‐9, IL‐12, TNF‐α and IFN‐γ (BD OptEIA; BD Biosciences, EUA); IL‐13, IL‐25, IL‐33, TSLP, leptin and eotaxin (CCL11) (R&D Systems, Minneapolis, MN, USA); and IL‐17A (eBioscience, San Diego, CA, USA), according to the manufacturer's instructions.
Statistical analysis
Data were analysed using Graph Pad Prism version 5.0 (Graph Pad Software, San Diego, CA, USA). Numerical data were analysed using the Kolmogorov–Smirnov normality test. Parametric data were analysed using unpaired t‐tests, and non‐parametric data were analysed using the Mann–Whitney U‐test. The threshold significance level for all tests was set at P ≤ 0·05. Data are expressed as the mean and standard error of the mean (s.e.m.).
Results
HFD feeding caused obesity associated with systemic inflammation and metabolic disorder, and altered the OVA‐induced IgE response in BALB/c mice
BALB/c mice fed the HFD (60% kcal from fat) for 10 weeks (OB group) showed a higher final body weight, increased BMI and more perigonadal and retroperitoneal fat accumulation in comparison with the control group (CN) fed a standard diet (10% kcal from fat). In addition, both leptin and TNF‐α serum levels as well as fasting total cholesterol, LDL‐cholesterol, triglyceride and glucose levels were increased in the HFD‐fed mice (Table 1). The effect of HFD‐induced obesity on leptin levels in the lungs was also evaluated; the OB group and OVA‐sensitized and challenged obese (OB/PA) group had higher leptin levels in the lungs when compared to both the CN and OVA‐sensitized non‐obese (PA) groups. Sensitization and challenge with OVA did not influence the weight of the mice (data not shown) or the levels of leptin in the lungs of the obese mice (Fig. 1).
Table 1.
High fat diet‐induced obesity leads to metabolic disturbances and promotes an inflammatory profile in BALB/c mice
| Parameter | Control | Obese |
|---|---|---|
| Body weight (g) | 22·23 (± 0·56) | 27·58 (± 0·90)* |
| Perigonadal fat (g) | 0·330 (± 0·02) | 0·975 (± 0·08)* |
| Body mass index (g/cm2) | 0·27 (± 0·01) | 0·33 (±0·01)* |
| Glucose (mg/dl) | 107·5 (± 4·93) | 208·7 (± 10·15)* |
| Total cholesterol (mg/dl) | 80·60 (± 4·21) | 138·9 (± 8·20)* |
| HDL‐cholesterol (mg/dl) | 28·80 (± 2·02) | 31·20 (± 1·44) |
| LDL‐cholesterol (mg/dl) | 38·90 (± 13·63) | 80·10 (± 7·35)* |
| Triglycerides (mg/dl) | 62·75 (± 3·56) | 135·00 (± 17·09)* |
| Leptin (ng/ml) | 571·8 (± 57·72) | 4982·00 (± 736·2)* |
| TNF‐α (pg/ml) | 100·3 (± 3·10) | 171·3 (± 25·13)* |
BALB/c mice were fed a standard diet [control group (CN)] or a high‐fat diet (obese group) for 10 weeks. Values are expressed as mean ± standard error of the mean (s.e.m.) (n = 10). *P < 0·05 compared with the CN group. HDL = high‐density lipoprotein; LDL = low‐density lipoprotein; TNF = tumour necrosis factor.
Figure 1.
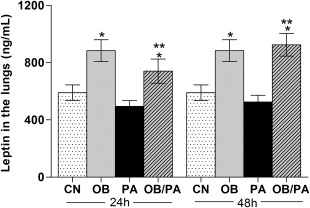
Leptin levels in the lung tissue homogenate at 24 and 48 h after the last ovalbumin (OVA) challenge. Values are expressed as mean ± standard error of the mean (s.e.m.) (n = 5). *P < 0·05 for the obese (OB), pulmonary allergy (PA) and OB/PA groups compared to the control (CN) group; **P < 0·05 for the OB/PA group compared to the PA group.
An elevated IgE level is a characteristic marker of the allergic immune response. As expected, OVA sensitization and challenge increased significantly the serum levels of OVA‐specific IgE in the PA and OB/PA groups. However, the levels of OVA‐specific IgE were lower in the OB/PA group compared to those of the PA group at 24 h after OVA challenge (Fig. 2).
Figure 2.
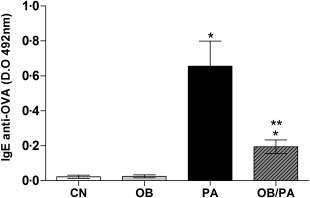
Levels of ovalbumin (OVA)‐specific immunoglobulin (Ig)E in the serum at 24 h after the last OVA challenge. OD indicates optical density. Values are expressed as mean ± standard error of the mean (s.e.m.) (n = 5). *P < 0·05 for the obese (OB), pulmonary allergy (PA) and OB/PA groups compared to the control (CN) group; **P < 0·05 for the OB/PA group compared to the PA group.
Obesity promoted mast cell influx associated with intense mucus production after OVA challenge
Figure 3a,b shows that mice of both the PA and OB/PA groups had intense inflammatory infiltrates in the peribronchovascular region. In general, the PA and OB/PA groups exhibited a similar inflammatory response in the lungs, which was only slightly higher than that observed in the PA group at 24 h after OVA challenge. In addition, goblet hyperplasia and mucus production were more intense in the OB/PA group compared to those of the PA group at both time‐points studied (Fig. 3c,d).
Figure 3.
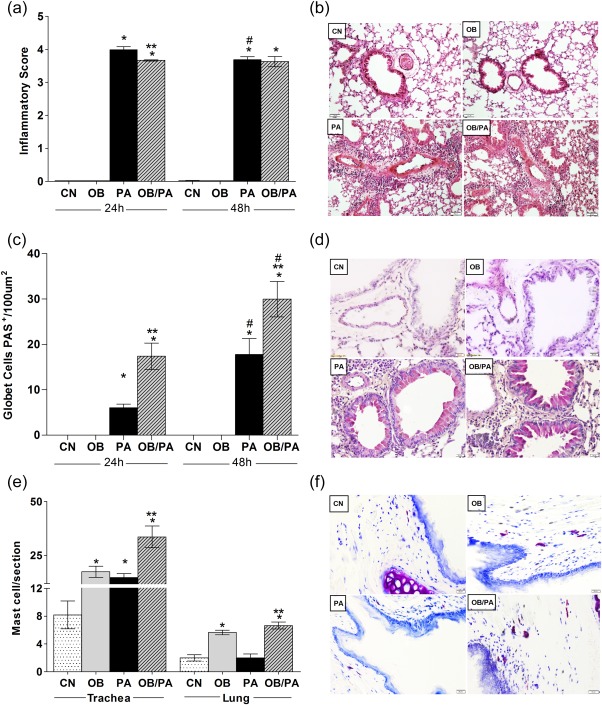
Obesity promoted intense mucus production at 24 and 48 h after the last ovalbumin (OVA) challenge. Inflammatory score in the lung evaluated by hematoxylin and eosin (H&E) staining (a), period acid‐Schiff (PAS)‐positive goblet cells (c) and mast cell influx in the pulmonary tissue and trachea with toluidine blue staining (e). Panels show representative images from each group at ×200 magnification for H&E (b), 400 for PAS (d) and ×400 for toluidine blue (f). Values are expressed as mean ± standard error of the mean (s.e.m.) (n = 5). *P < 0·05 for the obese (OB), pulmonary allergy (PA) and OB/PA groups compared to the control (CN) group. **P < 0·05 for the OB/PA group compared to the PA group; #P < 0·05 for the PA and OB/PA groups at 48 h compared with those at 24 h after the last OVA challenge. [Colour figure can be viewed at wileyonlinelibrary.com].
Next, we evaluated whether the intense mucus production in the allergic obese mice was associated with mast cell influx in the trachea and lungs. The OB/PA group showed a significant increase in the numbers of mast cells in the pulmonary tissue when compared to those of both the CN and PA groups at 24 h after the last OVA challenge (Fig. 3e). Both the OB/PA and PA groups showed an increase in the number of mast cells in the trachea, which was higher in the OB/PA group (Fig. 3e,f). Interestingly, the OB group presented an enhanced number of mast cells in the pulmonary tissue and trachea in comparison to the control (Fig. 3e,f).
Obesity increased the number of neutrophils in the BM at 48 h after OVA challenge
Comparison of immune responses at 24 and 48 h indicated that allergic immune responses peaked at 24 h and that the total number of inflammatory cells (data not shown) and eosinophils decreased significantly in BM at 48 h compared with those at 24 h in the PA group (Fig. 4a). However, obesity after last challenge with OVA induced less production of eosinophils in BM (Fig. 4a). In contrast, there was an increase in neutrophil population (Fig. 4b) along with an increase in the total cell count in obese allergic mice at 48 h after the last OVA challenge (data not shown).
Figure 4.
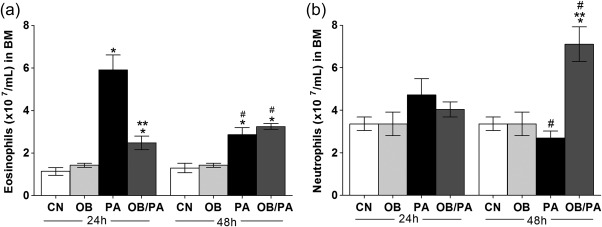
Cell counts in the bone marrow at 24 and 48 h after the last ovalbumin (OVA) challenge. Numbers of eosinophils (a); neutrophils (b). Values are expressed as mean ± standard error of the mean (s.e.m.) (n = 5). *P < 0·05 for the obese (OB), pulmonary allergy (PA) and OB/PA groups compared to the control (CN) group.; **P < 0·05 for the OB/PA group compared to the PA group.
Obesity affects the eosinophil and neutrophils influx in the lung after OVA challenge
Initially, the composition of the inflammatory infiltrate was investigated in the BALF. Total cell count in BALF increased with OVA exposure in both groups analysed (Fig. 5a). As expected, a higher eosinophil influx in the BALF was observed in the PA group after 24 and 48 h of OVA challenge compared to the OB/PA group, whereas macrophage influx was increased in the OB/PA group at both time‐points analysed (Fig. 5b). However, obesity induced a significant increase in the percentage of macrophages in OB/PA group at both time‐points analysed (Fig. 5b). Similarly, the numbers of eosinophils were lower in the pulmonary tissue of the OB/PA group in comparison to those of the PA group at both 24 and 48 h after OVA challenge (Fig. 5c,d), which was correlated with lower EPO activity (Fig. 5e) and CCL11 (Fig. 5f) levels in the lungs. Further, our data showed that the mice of the OB/PA group had increased neutrophil numbers in the pulmonary tissue (Fig. 6a,b) at 48 h after OVA challenge compared with those of the PA group, which was associated with increased MPO activity in the lungs at the same time‐point (Fig. 6c).
Figure 5.
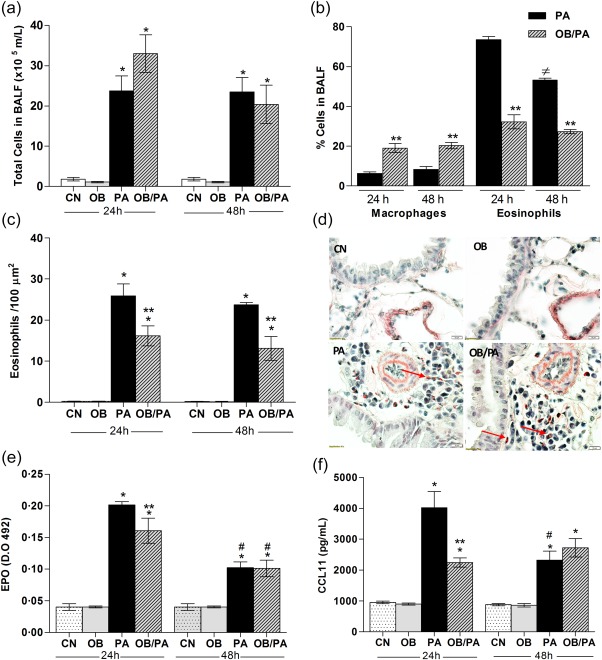
Obesity reduced eosinophil influx in the lung after ovalbumin (OVA) challenge. Total cells count in bronchoalveolar lavage fluid (BALF) (a) and differential cell count in the BALF at 24 and 48 h (b) after the last OVA challenge. Eosinophils in the lung were assessed by Sirius Red staining (c), with representative images for each group shown at a magnification of ×1000 (d). Eosinophil peroxidase (EPO) activity (e) and CCL11 (f) levels in the lung tissue homogenate at 24 and 48 h after the last OVA challenge. Values are expressed as mean ± standard error of the mean (s.e.m.) (n = 5). *P < 0·05 for the obese (OB), pulmonary allergy (PA) and OB/PA groups compared to the control (CN) group; **P < 0·05 for the OB/PA group compared to the PA group; #P < 0·05 for the PA and OB/PA groups at 48 h compared with those at 24 h after the last OVA challenge. [Colour figure can be viewed at wileyonlinelibrary.com].
Figure 6.
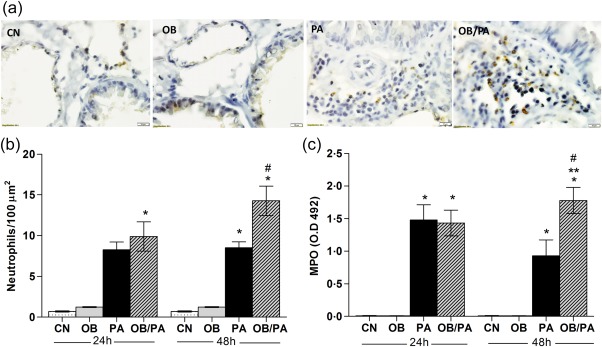
Obesity‐induced neutrophil influx at 48 h after the last ovalbumin (OVA) challenge. Neutrophils count in the bone marrow (BM) at 24 and 48 h after the last OVA challenge (a). Pulmonary tissue neutrophils assessed by myeloperoxidase (MPO) immunohistochemistry (brown staining) (b); representative images for each group are shown at a magnification of ×1000 (c). MPO activity levels (d). Values are expressed as mean ± standard error of the mean (s.e.m.) (n = 5). *P < 0·05 for the obese (OB), pulmonary allergy (PA) and OB/PA groups compared to the control (CN) group; **P < 0·05 for the OB/PA group compared to the PA group; #P < 0·05 for the PA and OB/PA groups at 48 h compared with those at 24 h after the last OVA challenge. [Colour figure can be viewed at wileyonlinelibrary.com].
Obesity induced phenotype changes in alveolar macrophages
Because a remarkable increase in the number of macrophages in the BALF was observed in the OB/PA group, alternative and classical pathways of macrophage activation were investigated by assessing the number of macrophages expressing arginase (Mac‐Arg+) and iNOS (Mac‐iNOS+), respectively. Challenge with OVA induced significant increases of both arginase‐ and iNOS‐positive macrophages (Fig. 7). The OB/PA group showed higher numbers of arginase‐positive macrophages at 24 h after the last OVA challenge in comparison with those of the PA group (Fig. 7a,b). In contrast, the iNOS‐positivity rate was higher at 48 h after OVA challenge (Fig. 7c,d).
Figure 7.
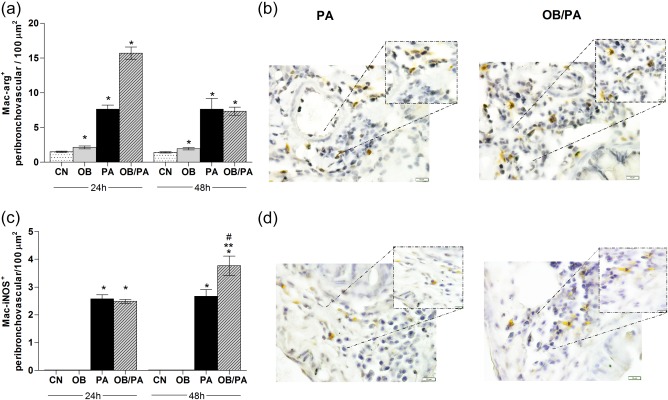
Obesity‐induced influx and phenotype changes in macrophages. Expression of arginase (a) and inducible nitric oxide synthase (iNOS) (c) in macrophages by immunohistochemistry at 24 and 48 h after the last ovalbumin (OVA) challenge in the peribronchovascular region. Representative images of macrophages in the pulmonary tissue stained with anti‐arginase (b) and anti‐iNOS antibodies (brown staining) (d); original magnification ×1000. Values are expressed as mean ± standard error of the mean (s.e.m.) (n = 5). *P < 0·05 for the obese (OB), pulmonary allergy (PA) and OB/PA groups compared to the control (CN) group; **P < 0·05 for the OB/PA group compared to the PA group; #P < 0·05 for the PA and OB/PA groups at 48 h compared with those at 24 h after the last OVA challenge. [Colour figure can be viewed at wileyonlinelibrary.com].
Obesity reduced the levels of IL‐25 and TSLP in the lungs of allergic mice
As expected, the PA group showed increased levels of IL‐25 (Fig. 8a), IL‐33 (Fig. 8b) and TSLP (Fig. 8c) at 24 h after the last OVA challenge. The OB/PA mice did not show an increase of IL‐25 and TSLP in the lungs, although the levels of IL‐33 were similar to those observed in the PA group at 24 h after the last OVA challenge (Fig. 8).
Figure 8.

Obesity reduced the release of interleukin (IL)‐25 and thymic stromal lymphopoietin (TSLP) at 24 h after the last ovalbumin (OVA) challenge. The levels of IL‐25 (a), IL‐33 (b), and TSLP (c) were evaluated in the lung homogenate at 24 h after the last OVA challenge. Values are expressed as mean ± standard error of the mean (s.e.m.) (n = 5). *P < 0·05 for the obese (OB), pulmonary allergy (PA) and OB/PA group compared to the control (CN) group; **P < 0·05 for the OB/PA group compared to the PA group.
Obesity delayed the release of IFN‐γ, IL‐4 and IL‐17A
To investigate further the effect of obesity on allergic inflammation, the cytokine profile, including the Th1 (IFN‐γ), Th2 (IL‐4, IL‐5, IL‐9, IL‐13) and Th17 (IL‐17A) profiles, in the lung homogenates was investigated. The PA group exhibited increased levels of IL‐4, IL‐5, IL‐9, IL‐13, and IL‐17A in the lung, peaking at 24 h after OVA challenge, but did not show augmented IFN‐γ production (Fig. 9). In the OB/PA group, IL‐9 and IL‐13 were also increased markedly at 24 h after OVA challenge, and IL‐5 was only slightly increased. In contrast, at 48 h after OVA challenge, the levels of IFN‐γ (Fig. 9a), IL‐4 (Fig. 9b) and IL‐17A (Fig. 9f) were elevated only in the OB/PA group. In addition, at this time‐point, the proinflammatory cytokines IL‐1β, IL‐6 and TNF‐α were also increased (Fig. 10a–c).
Figure 9.
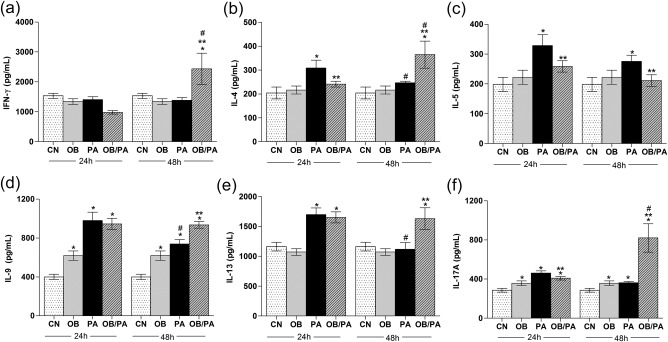
Effect of obesity on the cytokine profiles for T helper type 1 (Th1) interferon (IFN)‐γ (a), and Th2 interleukin (IL)‐4 (b), IL‐5 (c), IL‐9 (d), IL‐13 and (e), IL‐17A (f) at 24 and 48 h after the last ovalbumin (OVA) challenge. Values are expressed as mean ± standard error of the mean (s.e.m.) (n = 5). *P < 0·05 for the obese (OB), pulmonary allergy (PA) and OB/PA group compared to the control (CN) group; **P < 0·05 for the OB/PA group compared to the PA group; #P < 0·05 for the PA and OB/PA groups at 48 h compared with those at 24 h after the last OVA challenge.
Figure 10.

Effects of obesity on the levels proinflammatory cytokines interleukin (IL)‐1β (a), IL‐6 (b), and tumour necrosis factor (TNF)‐α (c) at 24 and 48 h after the last ovalbumin (OVA) challenge. Values are expressed as mean ± standard error of the mean (s.e.m.) (n = 5). *P < 0·05 for the obese (OB), pulmonary allergy (PA) and OB/PA group compared to the control (CN) group; **P < 0·05 for the OB/PA group compared to the PA group. #P < 0·05 for the PA and OB/PA groups at 48 h compared with those at 24 h after the last OVA challenge.
Discussion
Understanding the influence of obesity on the allergic immune response is of critical importance, given the widespread prevalence of obesity in asthmatic individuals. In the present study, the effect of obesity on OVA‐induced allergic lung inflammation was investigated in BALB/c mice, a mouse strain used commonly as an allergic asthma model to OVA. Although BALB/c mice are resistant to the development of obesity 22, our data indicated that feeding BALB/c mice with an HFD for 10 weeks induced moderate obesity characterized by weight gain, visceral fat accumulation and metabolic disorders. In addition, these mice had elevated serum levels of both TNF‐α and leptin, which are characteristics of low‐grade systemic inflammation that is considered a marker of the obese state 27. Moreover, high leptin levels were detected in the lungs of obese mice, suggesting the diffusion of leptin from the blood irrespective of the presence of allergy 28. Clinical studies have shown that leptin expression in the serum and lung are up‐regulated in the presence of obesity‐associated asthma, implying that this proinflammatory adipokine may contribute to the clinical phenotype in obese asthmatic individuals 29, 30.
Interestingly, the number of mast cells was elevated in obese mice regardless of the allergic process. We speculate that increases in mast cell numbers were due to the augmented levels of IL‐9 in the lungs of obese mice 31. It is well known that obesity is associated with increases in the serum levels of IL‐9 32 and with mast cell influx in the human adipose tissue 33. After OVA challenge, the number of mast cells was even higher in the obese allergic mice. Thus, the obesity‐induced accumulation of mast cells in the lung and trachea of obese allergic mice suggests an important cellular mechanism by which obesity is associated with a high risk for poorly controlled asthma 11, 34. It is accepted widely that the allergen‐dependent cross‐linking of high‐affinity IgE receptors on mast cells can trigger the activation and rapid release of proinflammatory mediators, resulting in mucus hypersecretion and smooth muscle contraction. However, clinical studies suggest that obesity is a risk factor for non‐atopic asthma, as measured by lower IgE levels 35. In the current study, higher mucus hypersecretion but reduced levels of anti‐OVA IgE were observed in the OB/PA group, which is in accordance with an experimental model of obesity and asthma in mice 36. This finding may indicate that other factors, such as over‐expression of leptin, IL‐9, IL‐13 and IL‐33 found in the lungs of allergic obese mice, may be associated with the mast cell recruitment/activation and intense mucus production after the OVA challenge 37, 38, 39. In addition, the higher levels of IL‐1β, IL‐17A and TNF‐α observed at 48 h could have enhanced mucus production later in the OB/PA mice 37, 38.
Our results demonstrate that OVA‐induced allergic immune response showed a peak after 24 h, decreasing thereafter. This correlated with a greater detection of IL‐1β in the PA group at 24 h. Conversely, the levels of IL‐1β, IL‐17A and IL‐9 were already increased at 24 h in obese mice (OB group), remaining high thereafter. This suggests that the pulmonary environment appears to become more proinflammatory as fat accumulates. In accordance, a previous study showed that non‐sensitized C57BL/6 obese mice developed AHR, which was associated with activation of the IL‐1β–NLRP3 inflammasome axis and increased levels of IL‐17A in the lungs due to chronic inflammation characteristic of obesity 40. In addition, the consumption of high‐fat diet 41, as well as increased levels of LDL as observed in obese mice, have been associated with activation of the NLRP3–IL‐1β pathway 42.
Although AHR was not analysed in the present study, the presence of the high number of goblet cells in the obese allergic mice suggests their relevance in airway obstruction. Collectively, our data highlight the potential of obesity for increasing allergic airway inflammation, which may be associated with the high mucus production, considered as the major cause of death among patients with severe asthma 43, 44.
It is well known that the pulmonary homeostatic environment contains many macrophages that are critical for innate and adaptive immunity. However, alveolar macrophages are heterogeneous and show plasticity in the response to several stimuli and cytokines. In humans with severe asthma, classically activated macrophages are associated with corticosteroid resistance 45, 46. According to previous studies, obesity can induce a switch from an M2 macrophage phenotype towards a more M1 macrophage phenotype in obese allergic mice 20, 47. Furthermore, the enhanced and continuous influx of macrophages into the airways of obese allergic mice suggests the persistent activation of innate immunity and a potential role of M1 polarized macrophages in maintaining inflammation in the lungs by releasing IL‐1β, IL‐6 and TNF‐α.
Eosinophilic airway inflammation has been associated classically with allergic sensitization and a Th2‐predominant inflammatory response 2. In the present study, eosinophil production in the BM and eosinophil influx to the pulmonary tissue and BALF were lower in the OB/PA group. We may postulate that this effect was due to the reduced levels of IL‐25 and TSLP observed in these mice. Both IL‐25 and TSLP promote the Th2 immune response via the activation of dendritic cells 48, 49. Blockage or neutralization of TSLP and IL‐25 was shown to decrease the severity of allergic disease by the reduction of allergen‐specific serum IgE levels, airway tissue inflammation, inflammatory cell infiltration and Th2 cytokines 50, 51. Consistent with this finding, in the present study the OB/PA mice presented lower levels of IL‐4 and IL‐5 and reduced accumulation of eosinophils in the lungs, corroborating previous reports 18, 36. However, prolonged influx and activation of eosinophils were observed in the OB/PA group. This effect may have been mediated in part by the enhanced levels of leptin, which is known to promote the survival and activation of eosinophils 52, 53. In addition, leptin could induce the recruitment of eosinophils by up‐regulation of CCL11 in epithelial cells 54. Collectively, our results are in agreement with clinical studies reporting obesity as an important determinant of the clinical asthma phenotype, which is characterized typically in humans by a scarce number of eosinophils in the sputum 9 and reduced or normal levels of IgE 12, 28. This phenotype usually develops in women with adult‐onset asthma 55, who show severe symptoms, frequent exacerbation episodes and resistance to conventional asthma treatment 12. Studies on experimental models of obesity and asthma have provided conflicting results with respect to the influx of eosinophils, with some studies showing increased eosinophilic inflammation 17, 19 and others showing decreased pulmonary eosinophil counts 18, 36. This discrepancy in experimental data may be due to the use of different protocols and mouse strains with different genetic backgrounds, which is consistent with the high phenotypical heterogeneity of clinical asthma observed in humans. Although a recent study in BALB/c mice showed that obesity increased the Th2 immune response 24, the present work is the first to use BALB/c mice to demonstrate the effect of obesity as an important parameter of the allergic immune response, such as neutrophil and mast cell influx into the lung as well as the innate immune response characterized by dampening the release of the epithelial cytokines IL‐25 and TSLP. Impaired secretion of TSLP and IL‐25 in obese allergic mice may favour the development of the Th17 immune response and neutrophilic inflammation 50, 56. Furthermore, obesity itself is a predisposing factor for Th17‐induced inflammation 57, and affects the maturation, recruitment and antigen presentation by dendritic cells negatively, leading to delayed secretion of inflammatory cytokines 58. Consistently, the OB/PA mice showed delayed release of the inflammatory cytokines IL‐1β, IL‐6, TNF‐α and IFN‐γ, which might have contributed to the neutrophil recruitment or, indirectly, to the IL‐17A production observed at the same time‐point 59. Although IL‐17A is produced mainly by Th17 cells, it is also produced by other cell types. Dual‐positive Th2/Th17 cells are the major source of IL‐4 and IL‐17A, and are associated with asthma severity 60. Moreover, these cells arrive at the inflammation site relatively late 60, 61, which is consistent with the delayed immune response observed in the present study, and with the increases in IL‐17A and IL‐4 production in the obese allergic mice. Both IL‐17A and neutrophils are associated with increased asthma severity 62, a common phenomenon observed in obese patients with severe asthma 9, 13. Neutrophils are essential innate immune cells that contribute to inflammation during asthma not only by secreting cytokines, chemokines and MPO granules but also by inducing resistance to glucocorticoid therapy 63. Clinical cluster analyses have identified subgroups of patients with asthma who show a concomitant increase in the numbers of eosinophils and neutrophils in induced sputum, and increased asthma severity despite the use of high corticosteroid doses 6, 64.
In conclusion, our findings suggest that obesity affects OVA‐induced airway inflammation in BALB/c mice inducing a distinct and delayed allergic immune response characterized by enhanced Th1, Th2 and Th17 responses. These events result in prolongation of the inflammatory response, characterized by mixed inflammatory influx, classically activated macrophage accumulation and intense mucus production that may contribute to asthma severity and the therapeutic response.
Author contributions
F. M. C. S. designed the study, performed laboratory and statistical analyses and drafted the manuscript. E. E. O. performed laboratory analysis and drafted the manuscript. A. C. G., C. C. A. and A. S. S. B. performed laboratory analysis. J. O. A. C. analysed and interpreted the biochemical data. J. G. contributed in the design of the study. H. C. T. and J. M. critically revised the manuscript for important intellectual content. A. P. F. designed and supervised the project and edited the manuscript. All authors have read and approved the final content of the manuscript.
Disclosure
The authors have no conflicts of interest to disclose.
Acknowledgments
This study was supported by grants from Fundação de Amparo a Pesquisa de Minas Gerais – FAPEMIG UNIVERSAL (2012/APQ 00535‐12), FAPEMIG‐PPM‐Pesquisador Mineiro: 00269‐14; Conselho Nacional de Desenvolvimento Científico e Tecnológico‐CNPq (Bolsa de Produtividade): 306575/2012‐4 and 306768/2015‐1; and CNPQ/PVE (401332/2014‐4) and CAPES. Programa Pós Graduação em Ciências Biológicas PPGC‐BIO‐Universidade Federal de Juiz de Fora. Juiz de Fora‐MG, Brasil.
References
- 1. Global Initiative for Asthma (GINA) . Global strategy for asthma management and prevention, 2015. http://ginasthma.org/2017-gina-report-global-strategy-for-asthma-management-and-prevention/
- 2. Wenzel SE. Asthma phenotypes: the evolution from clinical to molecular approaches. Nat Med 2012; 18:716–25. [DOI] [PubMed] [Google Scholar]
- 3. Hammad H, Chieppa M, Perros F, Willart MA, Germain RN, Lambrecht BN. House dust mite allergen induces asthma via Toll‐like receptor 4 triggering of airway structural cells. Nat Med 2009; 15:410–6. [DOI] [PMC free article] [PubMed] [Google Scholar]
- 4. Xiao C, Puddicombe SM, Field S et al Defective epithelial barrier function in asthma. J Allergy Clin Immunol 2011; 128:549–56.e1–12. [DOI] [PubMed] [Google Scholar]
- 5. Borish L. The immunology of asthma: asthma phenotypes and their implications for personalized treatment. Ann Allergy Asthma Immunol 2016; 117:108–14. [DOI] [PMC free article] [PubMed] [Google Scholar]
- 6. Moore WC, Hastie AT, Li X et al Sputum neutrophil counts are associated with more severe asthma phenotypes using cluster analysis. J Allergy Clin Immunol 2014; 133:1557–63.e5. [DOI] [PMC free article] [PubMed] [Google Scholar]
- 7. Sorbello V, Ciprandi G, Di Stefano A et al Nasal IL‐17F is related to bronchial IL‐17F/neutrophilia and exacerbations in stable atopic severe asthma. Allergy 2015; 70:236–40. [DOI] [PubMed] [Google Scholar]
- 8. Raundhal M, Morse C, Khare A et al High IFN‐gamma and low SLPI mark severe asthma in mice and humans. J Clin Invest 2015; 125:3037–50. [DOI] [PMC free article] [PubMed] [Google Scholar]
- 9. Telenga ED, Tideman SW, Kerstjens HA et al Obesity in asthma: more neutrophilic inflammation as a possible explanation for a reduced treatment response. Allergy 2012; 67:1060–8. [DOI] [PubMed] [Google Scholar]
- 10. Schatz M, Zeiger RS, Yang SJ et al Prospective study on the relationship of obesity to asthma impairment and risk. J Allergy Clin Immunol Pract 2015; 3:560–565. [DOI] [PubMed] [Google Scholar]
- 11. Fitzpatrick S, Joks R, Silverberg JI. Obesity is associated with increased asthma severity and exacerbations, and increased serum immunoglobulin E in inner‐city adults. Clin Exp Allergy 2012; 42:747–59. [DOI] [PubMed] [Google Scholar]
- 12. Gibeon D, Batuwita K, Osmond M et al Obesity‐associated severe asthma represents a distinct clinical phenotype: analysis of the British Thoracic Society Difficult Asthma Registry Patient cohort according to BMI. Chest 2013; 143:406–14. [DOI] [PubMed] [Google Scholar]
- 13. Scott HA, Gibson PG, Garg ML, Wood LG. Airway inflammation is augmented by obesity and fatty acids in asthma. Eur Respir J 2011; 38:594–602. [DOI] [PubMed] [Google Scholar]
- 14. Scott HA, Gibson PG, Garg ML, Upham JW, Wood LG. Sex hormones and systemic inflammation are modulators of the obese‐asthma phenotype. Allergy 2016; 71:1037–47. [DOI] [PubMed] [Google Scholar]
- 15. Harwood HJ Jr. The adipocyte as an endocrine organ in the regulation of metabolic homeostasis. Neuropharmacology 2012; 63:57–75. [DOI] [PubMed] [Google Scholar]
- 16. Lackey DE, Olefsky JM. Regulation of metabolism by the innate immune system. Nat Rev Endocrinol 2016; 12:15–28. [DOI] [PubMed] [Google Scholar]
- 17. Calixto MC, Lintomen L, Schenka A, Saad MJ, Zanesco A, Antunes E. Obesity enhances eosinophilic inflammation in a murine model of allergic asthma. Brit J Pharmacol 2010; 159:617–25. [DOI] [PMC free article] [PubMed] [Google Scholar]
- 18. de Vries A, Hazlewood L, Fitch PM, Seckl JR, Foster P, Howie SE. High‐fat feeding redirects cytokine responses and decreases allergic airway eosinophilia. Clin Exp Allergy 2009; 39:731–9. [DOI] [PubMed] [Google Scholar]
- 19. Dietze J, Bocking C, Heverhagen JT, Voelker MN, Renz H. Obesity lowers the threshold of allergic sensitization and augments airway eosinophilia in a mouse model of asthma. Allergy 2012; 67:1519–29. [DOI] [PubMed] [Google Scholar]
- 20. Diaz J, Warren L, Helfner L et al Obesity shifts house dust mite‐induced airway cellular infiltration from eosinophils to macrophages: effects of glucocorticoid treatment. Immunol Res 2015; 63:197–208. [DOI] [PMC free article] [PubMed] [Google Scholar]
- 21. Nishikawa S, Yasoshima A, Doi K, Nakayama H, Uetsuka K. Involvement of sex, strain and age factors in high fat diet‐induced obesity in C57BL/6J and BALB/cA mice. Exp Anim 2007; 56:263–72. [DOI] [PubMed] [Google Scholar]
- 22. Montgomery MK, Hallahan NL, Brown SH et al Mouse strain‐dependent variation in obesity and glucose homeostasis in response to high‐fat feeding. Diabetologia 2013; 56:1129–39. [DOI] [PubMed] [Google Scholar]
- 23. Ramalho R, Almeida J, Beltrao M et al Substance P antagonist improves both obesity and asthma in a mouse model. Allergy 2013; 68:48–54. [DOI] [PubMed] [Google Scholar]
- 24. Chen YP, Zhang JH, Li CQ, Sun QX, Jiang XH. Obesity enhances Th2 inflammatory response via natural killer T cells in a murine model of allergic asthma. Int J Clin Exp Med 2015; 8:15403–12. [PMC free article] [PubMed] [Google Scholar]
- 25. Fearnside JF, Dumas ME, Rothwell AR et al Phylometabonomic patterns of adaptation to high fat diet feeding in inbred mice. PLOS ONE 2008; 3:e1668. [DOI] [PMC free article] [PubMed] [Google Scholar]
- 26. Gouveia AC, Brugiolo AS, Alves CC et al Th2 responses in OVA‐sensitized BALB/c mice are down‐modulated by Mycobacterium bovis BCG treatment. J Clin Immunol 2013; 33:235–45. [DOI] [PMC free article] [PubMed] [Google Scholar]
- 27. Cao H. Adipocytokines in obesity and metabolic disease. J Endocrinol 2014; 220:T47–59. [DOI] [PMC free article] [PubMed] [Google Scholar]
- 28. Holguin F, Rojas M, Brown LA, Fitzpatrick AM. Airway and plasma leptin and adiponectin in lean and obese asthmatics and controls. J Asthma 2011; 48:217–23. [DOI] [PMC free article] [PubMed] [Google Scholar]
- 29. Morishita R, Franco Mdo C, Suano‐Souza FI, Sole D, Puccini RF, Strufaldi MW. Body mass index, adipokines and insulin resistance in asthmatic children and adolescents. J Asthma 2016; 53:478–84. [DOI] [PubMed] [Google Scholar]
- 30. Sutherland TJ, Cowan JO, Young S et al The association between obesity and asthma: interactions between systemic and airway inflammation. Am J Respir Crit Care Med 2008; 178:469–75. [DOI] [PubMed] [Google Scholar]
- 31. Kearley J, Erjefalt JS, Andersson C et al IL‐9 governs allergen‐induced mast cell numbers in the lung and chronic remodeling of the airways. Am J Respir Crit Care Med 2011; 183:865–75. [DOI] [PMC free article] [PubMed] [Google Scholar]
- 32. Dalmas E, Rouault C, Abdennour M et al Variations in circulating inflammatory factors are related to changes in calorie and carbohydrate intakes early in the course of surgery‐induced weight reduction. Am J Clin Nutr 2011; 94:450–8. [DOI] [PubMed] [Google Scholar]
- 33. Divoux A, Moutel S, Poitou C et al Mast cells in human adipose tissue: link with morbid obesity, inflammatory status, and diabetes. J Clin Endocrinol Metab 2012; 97:E1677–85. [DOI] [PubMed] [Google Scholar]
- 34. Beuther DA, Sutherland ER. Overweight, obesity, and incident asthma: a meta‐analysis of prospective epidemiologic studies. Am J Respir Crit Care Med 2007; 175:661–6. [DOI] [PMC free article] [PubMed] [Google Scholar]
- 35. Chen Y, Dales R, Jiang Y. The association between obesity and asthma is stronger in nonallergic than allergic adults. Chest 2006; 130:890–5. [DOI] [PubMed] [Google Scholar]
- 36. Pizzolla A, Oh DY, Luong S et al High fat diet inhibits dendritic cell and T cell response to allergens but does not impair inhalational respiratory tolerance. PLOS ONE 2016; 11:e0160407. [DOI] [PMC free article] [PubMed] [Google Scholar]
- 37. Fujisawa T, Velichko S, Thai P, Hung LY, Huang F, Wu R. Regulation of airway MUC5AC expression by IL‐1beta and IL‐17A; the NF‐kappaB paradigm. J Immunol 2009; 183:6236–43. [DOI] [PMC free article] [PubMed] [Google Scholar]
- 38. Busse PJ, Zhang TF, Srivastava K et al Chronic exposure to TNF‐alpha increases airway mucus gene expression in vivo. J Allergy Clin Immunol 2005; 116:1256–63. [DOI] [PubMed] [Google Scholar]
- 39. Woo HJ, Yoo WJ, Bae CH et al Leptin up‐regulates MUC5B expression in human airway epithelial cells via mitogen‐activated protein kinase pathway. Exp Lung Res 2010; 36:262–9. [DOI] [PubMed] [Google Scholar]
- 40. Kim HY, Lee HJ, Chang YJ et al Interleukin‐17‐producing innate lymphoid cells and the NLRP3 inflammasome facilitate obesity‐associated airway hyperreactivity. Nat Med 2014; 20:54–61. [DOI] [PMC free article] [PubMed] [Google Scholar]
- 41. Wen H, Gris D, Lei Y et al Fatty acid‐induced NLRP3‐ASC inflammasome activation interferes with insulin signaling. Nat Immunol 2011; 12:408–15. [DOI] [PMC free article] [PubMed] [Google Scholar]
- 42. Duewell P, Kono H, Rayner KJ et al NLRP3 inflammasomes are required for atherogenesis and activated by cholesterol crystals. Nature 2010; 464:1357–61. [DOI] [PMC free article] [PubMed] [Google Scholar]
- 43. Kuyper LM, Pare PD, Hogg JC et al Characterization of airway plugging in fatal asthma. Am J Med 2003; 115:6–11. [DOI] [PubMed] [Google Scholar]
- 44. Green FH, Williams DJ, James A, McPhee LJ, Mitchell I, Mauad T. Increased myoepithelial cells of bronchial submucosal glands in fatal asthma. Thorax 2010; 65:32–8. [DOI] [PubMed] [Google Scholar]
- 45. Goleva E, Hauk PJ, Hall CF et al Corticosteroid‐resistant asthma is associated with classical antimicrobial activation of airway macrophages. J Allergy Clin Immunol 2008; 122:550–9.e3. [DOI] [PMC free article] [PubMed] [Google Scholar]
- 46. Bhavsar P, Hew M, Khorasani N et al Relative corticosteroid insensitivity of alveolar macrophages in severe asthma compared with non‐severe asthma. Thorax 2008; 63:784–90. [DOI] [PubMed] [Google Scholar]
- 47. Manicone AM, Gong K, Johnston LK, Giannandrea M. Diet‐induced obesity alters myeloid cell populations in naive and injured lung. Respir Res 2016; 17:24. [DOI] [PMC free article] [PubMed] [Google Scholar]
- 48. Hongjia L, Caiqing Z, Degan L et al IL‐25 promotes Th2 immunity responses in airway inflammation of asthmatic mice via activation of dendritic cells. Inflammation 2014; 37:1070–7. [DOI] [PubMed] [Google Scholar]
- 49. Jang S, Morris S, Lukacs NW. TSLP promotes induction of Th2 differentiation but is not necessary during established allergen‐induced pulmonary disease. PLOS ONE 2013; 8:e56433. [DOI] [PMC free article] [PubMed] [Google Scholar]
- 50. Barlow JL, Flynn RJ, Ballantyne SJ, McKenzie AN. Reciprocal expression of IL‐25 and IL‐17A is important for allergic airways hyperreactivity. Clin Exp Allergy 2011; 41:1447–55. [DOI] [PubMed] [Google Scholar]
- 51. Zhang F, Huang G, Hu B, Song Y, Shi Y. A soluble thymic stromal lymphopoietin (TSLP) antagonist, TSLPR‐immunoglobulin, reduces the severity of allergic disease by regulating pulmonary dendritic cells. Clin Exp Neuroimmunol 2011; 164:256–64. [DOI] [PMC free article] [PubMed] [Google Scholar]
- 52. Kato H, Ueki S, Kamada R et al Leptin has a priming effect on eotaxin‐induced human eosinophil chemotaxis. Int Arch Allergy Immunol 2011; 155:335–44. [DOI] [PubMed] [Google Scholar]
- 53. Conus S, Bruno A, Simon HU. Leptin is an eosinophil survival factor. J Allergy Clin Immunol 2005; 116:1228–34. [DOI] [PubMed] [Google Scholar]
- 54. Suzukawa M, Koketsu R, Baba S et al Leptin enhances ICAM‐1 expression, induces migration and cytokine synthesis, and prolongs survival of human airway epithelial cells. Am J Physiol Lung Cell Mol Physiol 2015; 309:L801–11. [DOI] [PubMed] [Google Scholar]
- 55. Moore WC, Meyers DA, Wenzel SE et al Identification of asthma phenotypes using cluster analysis in the Severe Asthma Research Program. Am J Respir Crit Care Med 2010; 181:315–23. [DOI] [PMC free article] [PubMed] [Google Scholar]
- 56. Yadava K, Massacand J, Mosconi I, Nicod LP, Harris NL, Marsland BJ. Thymic stromal lymphopoietin plays divergent roles in murine models of atopic and nonatopic airway inflammation. Allergy 2014; 69:1333–42. [DOI] [PubMed] [Google Scholar]
- 57. Winer S, Paltser G, Chan Y et al Obesity predisposes to Th17 bias. Eur J Immunol 2009; 39:2629–35. [DOI] [PubMed] [Google Scholar]
- 58. Smith AG, Sheridan PA, Tseng RJ, Sheridan JF, Beck MA. Selective impairment in dendritic cell function and altered antigen‐specific CD8+ T‐cell responses in diet‐induced obese mice infected with influenza virus. Immunology 2009; 126:268–79. [DOI] [PMC free article] [PubMed] [Google Scholar]
- 59. Williams AS, Chen L, Kasahara DI, Si H, Wurmbrand AP, Shore SA. Obesity and airway responsiveness: role of TNFR2. Pulm Pharmacol Ther 2013; 26:444–54. [DOI] [PMC free article] [PubMed] [Google Scholar]
- 60. Irvin C, Zafar I, Good J et al Increased frequency of dual‐positive TH2/TH17 cells in bronchoalveolar lavage fluid characterizes a population of patients with severe asthma. J Allergy Clin Immunol 2014; 134:1175–86.e7. [DOI] [PMC free article] [PubMed] [Google Scholar]
- 61. Cosmi L, Maggi L, Santarlasci V et al Identification of a novel subset of human circulating memory CD4(+) T cells that produce both IL‐17A and IL‐4. J Allergy Clin Immunol 2010; 125:222–30.e1–4. [DOI] [PubMed] [Google Scholar]
- 62. Manni ML, Trudeau JB, Scheller EV et al The complex relationship between inflammation and lung function in severe asthma. Mucosal Immunol 2014; 7:1186–98. [DOI] [PMC free article] [PubMed] [Google Scholar]
- 63. Saffar AS, Dragon S, Ezzati P, Shan L, Gounni AS. Phosphatidylinositol 3‐kinase and p38 mitogen‐activated protein kinase regulate induction of Mcl‐1 and survival in glucocorticoid‐treated human neutrophils. J Allergy Clin Immunol 2008; 121:492–8.e10. [DOI] [PubMed] [Google Scholar]
- 64. Hastie AT, Moore WC, Meyers DA et al Analyses of asthma severity phenotypes and inflammatory proteins in subjects stratified by sputum granulocytes. J Allergy Clin Immunol 2010; 125:1028–36.e13. [DOI] [PMC free article] [PubMed] [Google Scholar]


