Abstract
Background
Food protein–induced enterocolitis syndrome (FPIES) is a non–IgE-mediated food allergy of infancy whose pathophysiology is poorly understood.
Objectives
We set out to identify and phenotype allergen-responsive cells in peripheral blood of a cohort of subjects undergoing supervised food challenge for FPIES. Methods: We profiled antigen-responsive cells in PBMCs by flow cytometry, and examined cells in whole blood obtained before and after challenge by CyTOF mass cytometry and RNAseq.
Results
Using a CD154-based detection approach, we observed that milk, soy, or rice-responsive T cells, and TNF-α–producing CD154+ T cells, were significantly lower in those with outgrown FPIES compared with those with active FPIES. However, levels were within the normal range and were inconsistent with a role in the pathophysiology of FPIES. Profiling of whole blood by CyTOF demonstrated profound activation of cells of the innate immune system after food challenge, including monocytes, neutrophils, natural killer cells, and eosinophils. Activation was not observed in children with outgrown FPIES. We confirmed this pattern of innate immune activation in a larger cohort by RNAseq. Furthermore, we observed pan–T-cell activation and redistribution from the circulation after a positive food challenge but not in those who had outgrown their FPIES.
Conclusions
Our data demonstrate a compelling role of systemic innate immune activation in adverse reactions elicited by foods in FPIES. Further investigation is needed to identify the mechanism of antigen specificity of adverse reactions to foods in FPIES.
Keywords: Food allergy, non-IgE, FPIES, innate, CyTOF, RNA-sequencing
Graphical abstract
Food protein–induced enterocolitis syndrome (FPIES) is a disease of infancy characterized by profuse vomiting and lethargy beginning 2 hours after food ingestion, with a subset experiencing delayed diarrhea.1 Although most infants outgrow FPIES by school age, a minority retain clinical reactivity into adolescence or adulthood.2 Foods triggering FPIES are the most common foods introduced early into the infant’s diet, including cow’s milk, soy, rice, and oats, but a wide range of foods have been reported to induce FPIES symptoms. Reactions are consistent with antigen specificity, and although most individuals react to a single food, multifood reactivity also occurs.3 There is growing awareness of FPIES as a clinical entity, highlighted by a number of publications in the last 5 years summarizing clinical experience with FPIES.2,4–6
FPIES is classified as a non–IgE-mediated food allergy, although allergen-specific IgE can be found in some patients with FPIES and is associated with persistent disease.2 There are conflicting reports about levels of food-specific antibodies in FPIES or food protein–induced enteropathy.7–9 We have examined food-specific IgG and IgA levels in subjects with milk-induced FPIES and found a relative absence of milk-specific immunoglobulins compared with tolerant controls.10,11 In patients with food protein–induced enteropathy, a disease whose relationship to FPIES is unclear and which has not been reported in recent clinical summaries, chronic antigen exposure leads to diarrhea and vomiting and is associated with villous atrophy and T-cell infiltration.3 PBMCs from patients with non–IgE-mediated cow’s milk allergy show increased TNF-α production compared with PBMCs from patients with outgrown cow’s milk allergy,12 but it is not clear if the patients described in that cohort would fit diagnostic criteria of FPIES. Patients with FPIES have also been described to have a TH2-skewed cytokine profile from antigen-restimulated PBMCs,13 consistent with our recent findings.11 It is difficult to reconcile a TH2-skewed T-cell profile as underlying such a distinct clinical entity as FPIES. As we recently reviewed,3 there is currently a lack of understanding of the immunologic basis of adverse reactions to foods in FPIES.
Diagnosis of FPIES is based on clinical history and response to food elimination. Patients with a history of FPIES undergo a supervised food challenge when there is reason to believe that the patients may have outgrown their reactivity, usually 12 to 24 months since their last reaction. In our center, food challenges for FPIES are performed in the clinical research center, with full resuscitation facilities for rapid intravenous fluid repletion. We collected specimens from patients undergoing a food challenge for FPIES. Blood specimens were collected immediately before the challenge, and again 4 to 6 hours after the challenge. We found evidence for a profound systemic innate immune activation associated with FPIES reactions, in the absence of an abnormal or pathogenic antigen-specific T-cell response. These data point to a critical role of the innate immune system in mediating adverse reactions to foods in FPIES.
METHODS
Study population
The research protocol was approved by the Icahn School of Medicine at Mount Sinai Institutional Review Board. Written informed consent was obtained before enrollment. Patients aged 1 to 21 years previously diagnosed with FPIES underwent an oral food challenge (OFC) in the inpatient clinical research unit to evaluate for resolution. Table I presents the clinical characteristics of the study subjects. A peripheral intravenous line was inserted before the OFC. During the OFC, the challenge food was administered in 3 equal portions over 30 minutes. The OFC was considered positive on the basis of diagnostic criteria defined by Powell14: emesis and/or diarrhea, and an increase in blood polymorphonuclear leukocyte count (>3500 cells/mm3 peaking at 6 hours). Following a negative OFC result, children were observed for 4 hours, whereas following a positive OFC result they were treated (2 of 14 treated with steroids, the remainder with intravenous fluid with or without Zantac) and observed until stable, usually discharged within 6 hours. Blood samples were obtained immediately before the OFC as well as 4 hours after a negative OFC result and 6 hours after a positive OFC result. There were sex differences between groups, with positive challenges being overwhelmingly male, whereas negative challenges were gender balanced. Healthy adult (non–age-matched) controls who were non–food-allergic by self-report were recruited to provide a reference of a healthy CD154 response to foods.
TABLE I.
Subjects’ characteristics
| Characteristic | FPIES | Outgrown |
|---|---|---|
| N | 14 | 16 |
|
| ||
| Age (y), median (range) | 7.5 (1.3–21) | 4.6 (1–21) |
|
| ||
| Sex | 13 M/1 F | 7 M/9 F |
|
| ||
| Foods used for challenge | Milk (4) | Milk (7) |
| Rice (4) | Rice (3) | |
| Soy (3) | Soy (1) | |
| Oat (1) | Egg (2) | |
| Banana (1) | Wheat (1) | |
| Beef (1) | Salmon (1) | |
| Bean (1) | ||
|
| ||
| Food-specific IgE | 1 of 14 | 0 of 16 |
F, Female; M, male.
Cell isolation and culture
Blood was obtained in 10 mL heparinized vacutainer tubes. PBMCs were isolated, and cultured in AimV with 5% Human AB serum. A total of 4 × 10⁶ cells in 1 mL were plated in 24-well plates. Cells were stimulated for 6 or 18 hours with milk antigens (a mix of 50 μg/mL each of α, β, and κ caseins) (Sigma Aldrich, St Louis, Mo), or soy or rice extract prepared from flour at 100 μg/mL. Extracts were cleaned of endotoxin using DetoxiGel columns (ThermoFisher, Rockford, Ill) and verified by Pierce LAL Endotoxin quantification kit (ThermoFisher) before use.
Four hours before harvest, Brefeldin A (BD Biosciences, San Jose, Calif) was added to cells. Cells were harvested, stained with fixable live/dead stain, followed by surface markers (CD3-APC-Cy7 [eBioscience, San Diego, Calif], CD4-Brilliant Violet 405 [Biolegend, San Diego, Calif], CXCR5-PerCP-Cy5.5 [BD Biosciences], CCR6-PE-Cy7 [BD Biosciences], and CCR9-FITC [BD Biosciences]). Cells were fixed with 4% paraformaldehyde (Electron Microscopy Sciences, Hatfield, Pa), followed by permeabilization with Permeabilization Buffer (eBioscience), and intracellular staining (CD154-PE [eBioscience], TNFα-AlexaFluor700, IL-13-v450, IL-10-PE-CF594, and IL-9-AlexaFluor647). Cells were acquired on a BD LSRFortessa, and analysis was performed on FlowJo Software (TreeStar, Ashland, Ore). In some studies, CD14-PE-Cy7 was used to identify monocytes.
Mass cytometry analysis (CyTOF)
Sample preparation
Whole blood samples were treated with BD PhosFlow Lyse/Fix Buffer (BD Biosciences) before freezing the sample in 10% dimethyl sulfoxide/PBS at −80°C. Thawed samples were first barcoded with Cell-ID 20-Plex Pd Barcoding Kit (Fluidigm, San Francisco, Calif), according to the manufacturer’s protocol. All the antibodies used in this study were either purchased preconjugated from Fluidigm or were conjugated using X8 MaxPar conjugation kits according to the manufacturer’s protocol (Table II). Barcoded samples were combined, treated with heparin to eliminate nonspecific binding to eosinophils,15 and subsequently stained with specific antibodies (Table II) and acquired as one multiplex sample, followed by software debarcoding and individual sample analysis. After washing, the samples were then incubated with 0.125 nM Ir nucleic acid intercalator (Fluidigm) to enable cell identification based on DNA content, and stored in PBS with freshly diluted 2% formaldehyde (Electron Microscopy Sciences) until acquisition.
TABLE II.
Antibody panel for CyTOF analysis
| Channel | Target | Category |
|---|---|---|
| In113 | CD57 | NK cell |
| In115 | CD45 | Pan-Leukocyte |
| Nd142 | CD19 | B cells |
| Nd143 | CD45RA | T-cell subset |
| Nd144 | CD69 | Activation |
| Nd145 | CD4 | T-cell subset |
| Nd146 | CD8 | T-cell subset |
| SM147 | CD49d | Homing |
| Nd148 | CD16 | Granulocytes, monocytes |
| Sm149 | CD127 | IL-7 receptor |
| Nd150 | CD1C | DCs |
| Eu151 | CD123 | Basophils, pDCs |
| Sm152 | CD66B | Neutrophils, eosinophils |
| Eu153 | PD-1 | Activation |
| Sm154 | CD163 | Activation |
| Gd155 | CD27 | Differentiation |
| Tb159 | CD103 | Homing |
| Gd160 | CD14 | Monocytes |
| Dy161 | CD56 | NK cells |
| Dy162 | CD64 | Activation |
| Er166 | CD25 | Activation |
| Er168 | CD3 | T cells |
| Tm169 | Beta 7 | Homing |
| Er170 | CD38 | Differentiation/activation |
| Yb171 | CD161 | Activation |
| Yb174 | HLADR | APCs, activation |
APC, Antigen-presenting cell; DC, dendritic cell.
CyTOF data acquisition and analysis
Immediately before acquisition, the samples were washed once with PBS, once with deionized water, and resuspended at a concentration of 600,000 cells/mL in water containing a 1/20 dilution of EQ 4 element beads (Fluidigm). Following routine autotuning according to the manufacturer’s recommendations, the samples were acquired on a CyTOF2 mass cytometer (Fluidigm) equipped with a SuperSample system (VictorianAirships, Alamo, Calif) at a flow rate of 0.045 mL/min. For quality control, the acquisition event rate was maintained under 400 events/s, and the EQ beads were confirmed to have a median Eu151 intensity of over 1000 to ensure appropriate mass sensitivity. The resulting FCS files were normalized using the bead-based normalization tool in the CyTOF2 software and uploaded to Cytobank for analysis. Cells events were identified as Ir191/193 DNA+Ce140− events, and doublets were excluded on the basis of higher DNA content and longer event length.
Major immune populations were identified either by manual gating on biaxial plots or by using a spanning-tree progression analysis of density-normalized events, which is complementary to existing approaches for analyzing cytometry data by enabling multiple cell types to be visualized in branched tree structure.16
RNA sequencing and coexpression analysis
Whole blood was collected before and after challenge in PAXgene tubes. Tubes were stored at −80°C until RNA isolation. RNA was isolated with PAXgene Blood RNA kit (Qiagen, Valencia, Calif) according to manufacturer’s protocol. Preparation of libraries and sequencing was performed by the Genomics Core at the Icahn School of Medicine at Mount Sinai. Hundred base-pair single-end reads were generated on an Illumina HiSeq 2500, mapped in Tophat, and converted into read counts via HTseq. Gene expression levels were generated from the read count data using DESeq2 and voom R packages.
Weighted correlation network analysis and module identification was completed using WGCNA R package.17 Each module may be represented by an eigengene, which is effectively a weighted average expression profile of all the genes in the module. Modules consist of genes whose expression is correlated irrespective of the direction of correlation, so some genes in a module may have an opposite pattern of expression from the eigengene representing the module. The correlation between modules and clinical information was evaluated through linear regression. Functional enrichment of coexpressed modules was done using GSEA resource (http://software.broadinstitute.org/gsea/index.jsp).
RESULTS
CD154-based detection of allergen-specific T cells
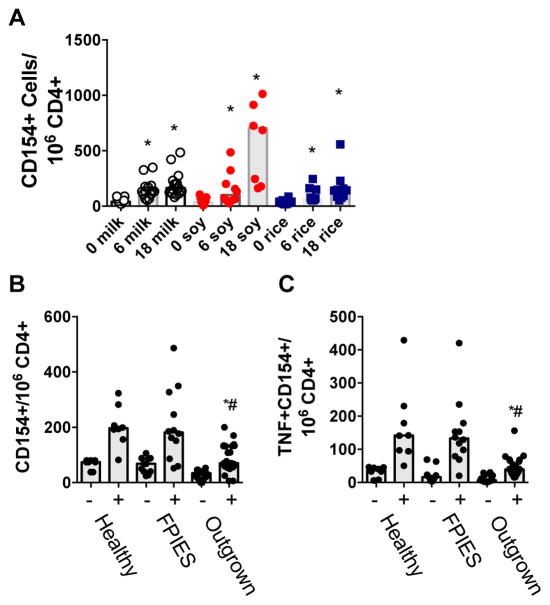
PBMCs from subjects who had undergone food challenge to soy, milk, or rice for assessment of FPIES were incubated with the relevant allergens for 6 or 18 hours before identification of allergen-responsive cells by CD154 expression. Incubation with food extract led to an increase in frequency of CD154 expression on CD3+CD4+ T cells at 6 hours that continued to increase at 18 hours (gating and representative dot plots shown in Fig E1 in this article’s Online Repository at www.jacionline.org; quantification by allergen and time point shown in Fig E2 in this article’s Online Repository at www.jacionline.org). The median frequency of CD154+ cells per million CD4+ T cells was 41, 133, and 164 for cells stimulated with milk for 0, 6, or 18 hours; 38, 101, and 705 for cells stimulated with soy for 0, 6, or 18 hours; and 37, 64, and 142 for cells stimulated with rice for 0, 6, or 18 hours (Fig 1, A). CD154+ cells coexpressed TNF-α, but did not express IL-13, IL-9, or IL-10. Cells stimulated with anti-CD3/CD28 stimulator beads were used as positive controls. Food-responsive T cells did not express mucosal-homing molecules CCR6 or CCR9, nor did they express the follicle-homing receptor CXCR5 (not shown).
FIG. 1.
CD154-based detection of food-specific T cells. A, Quantification of CD154+CD4+ T cells after 0, 6, or 18 hours of stimulation with milk, soy, or rice. B, Frequency of CD154+CD4+ T cells in the absence (−) or presence (+) of stimulation with milk, rice, or soy extract (extract matched to challenge food) in unchallenged healthy controls, or in those who reacted (FPIES) or not (outgrown) to a food challenge. C, Frequency of TNF-α+CD154+CD4+ T cells as in Fig 1, B. *P < .05 compared with media control. #P < .05 compared with FPIES.
When comparing samples from subjects who reacted or not to food challenge (termed active FPIES and outgrown, respectively), subjects who did not react had significantly fewer food-responsive CD154+ T cells, and significantly fewer food-responsive CD154+TNF-α+ T cells compared with subjects with active FPIES who reacted to their food challenge (Fig 1, B and C). However, when compared with responses observed in healthy control subjects, subjects with active FPIES did not have elevated numbers of food-responsive T cells, indicating that this difference was within the normal range and unlikely to explain the pathophysiology of FPIES. This pattern was observed in samples obtained before as well as 4 to 6 hours after food challenge.
Positive food challenge is associated with reduced activation of blood monocytes postchallenge
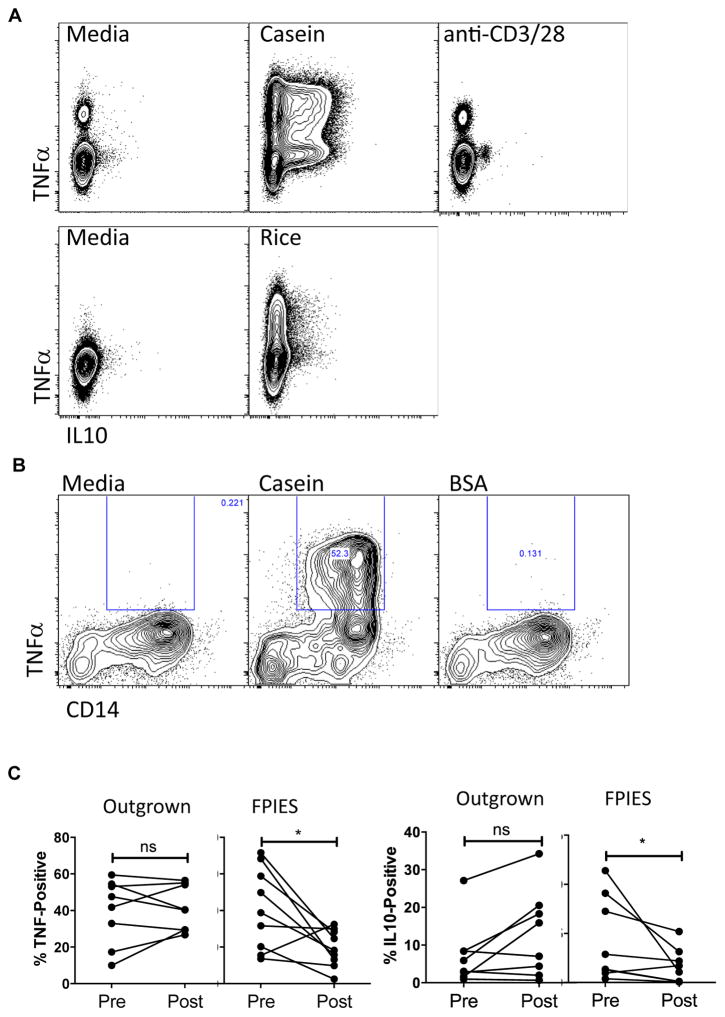
We examined subsets other than CD3+CD4+ lymphocytes as a source of TNF-α. We did not observe activation of CD8+ T cells by cytokine production. Unexpectedly, we observed that stimulation of PBMCs with milk or rice antigen induced a significant production of both TNF-α and IL-10 from a CD3negCD4neg population with a higher side scatter consistent with monocytes (Fig 2, A; see Fig E3 in this article’s Online Repository at www.jacionline.org). Monocyte markers were not included in our original CD154 panel, but in additional experiments we observed that casein antigen-induced TNF-α and IL-10 production was localized to a CD14+ monocyte population (Fig 2, B). BSA as a control antigen did not induce cytokine production (Fig 2, B). This response was not unique to FPIES, and was also true for healthy controls (data not shown), demonstrating an innate immune response to these food antigens. Despite the similar innate response to these antigens before the food challenge, we observed a significant reduction in TNF-α and IL-10 production from non–T-cell sources in subjects with active FPIES, but not subjects who passed their food challenge, in blood obtained postchallenge (Fig 2, C). This was not antigen specific, as we observed the same pattern of decreased responsiveness to milk or rice antigen postchallenge in a subject who reacted to food challenge with banana (data not shown). This reduced responsiveness of monocytes postchallenge suggested that these cells may be activated in vivo during food-elicited reactions in FPIES.
FIG. 2.
Monocyte hyporesponsiveness after FPIES reactions. A, TNF-α and IL-10 secretion from CD3neg CD4neg SSCMed cells 6 hours after stimulation with casein, rice, or anti-CD3/CD28 stimulator beads. B, Expression of TNF-α in CD14+ monocytes after stimulation with casein, but not BSA as control. C, Quantification of TNF-α and IL-10 expression in CD3neg CD4neg SSCMed cells 6 hours after stimulation with casein or rice in those who reacted to challenge (FPIES) and those who did not (Outgrown), before and 4 to 6 hours after food challenge. ns, Nonsignificant. *P < .05.
CyTOF-based profiling of the hematopoietic response to food challenge
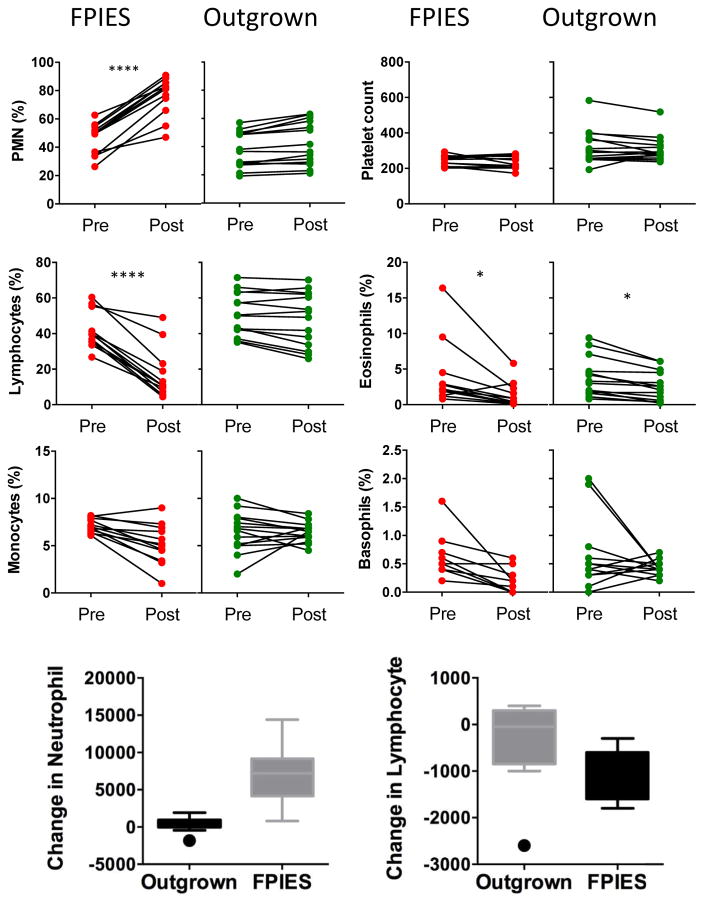
It is well established that FPIES reactions are associated with an increase in circulating neutrophils, which is part of Powell’s diagnostic criteria for FPIES.14 As shown in Fig 3, we confirmed a significant increase in circulating neutrophils in subjects who had reactions to food challenge, but not in those who had outgrown their FPIES. We also observed a significant decrease in lymphocytes (Fig 3) postchallenge in those with active FPIES, but not in those with outgrown FPIES. This was observed for proportion of cells as shown as well as absolute counts. Monocytes, basophils, and platelets were unchanged, whereas eosinophils were significantly lower after food challenge in both active and outgrown FPIES.
FIG. 3.
Impact of FPIES reactions on peripheral blood cells. Frequency of neutrophils (PMN), lymphocytes, monocytes, platelets, eosinophils, and basophils before (pre) and 4 to 6 hours after (post) food challenge. FPIES indicates subjects with reactions to foods, Outgrown indicates subjects who did not react to challenge. Bottom graphs summarize the change in circulating neutrophil and lymphocyte number (post-pre) in the 2 groups. *P < .05 and ****P < .0001.
To determine whether activation status rather than just cell number was altered during a food challenge in vivo, we developed a panel (Table II) for profiling innate immune activation in whole blood by mass cytometry (CyTOF). We used a barcoding approach that allowed matched pre- and postchallenge samples from multiple subjects to be pooled, stained, and analyzed as a single sample, thereby minimizing experimental variability and permitting evaluation of subtle changes in marker expression patterns across cell types.18 In addition to markers to identify all major hematopoietic subsets, we included activation markers of monocytes, neutrophils, natural killer (NK) cells, γd T cells, and eosinophils. Pre- and postchallenge blood samples were analyzed using 2 subjects challenged to milk, and 2 subjects challenged to cereals (oat/wheat), with 1 of each reacting to challenge with typical FPIES symptoms. Sample number was limited because we began to collect specimens for CyTOF analysis (requiring different sample preparation) at the end of the study based on the previous findings from flow cytometry analysis of PBMCs.
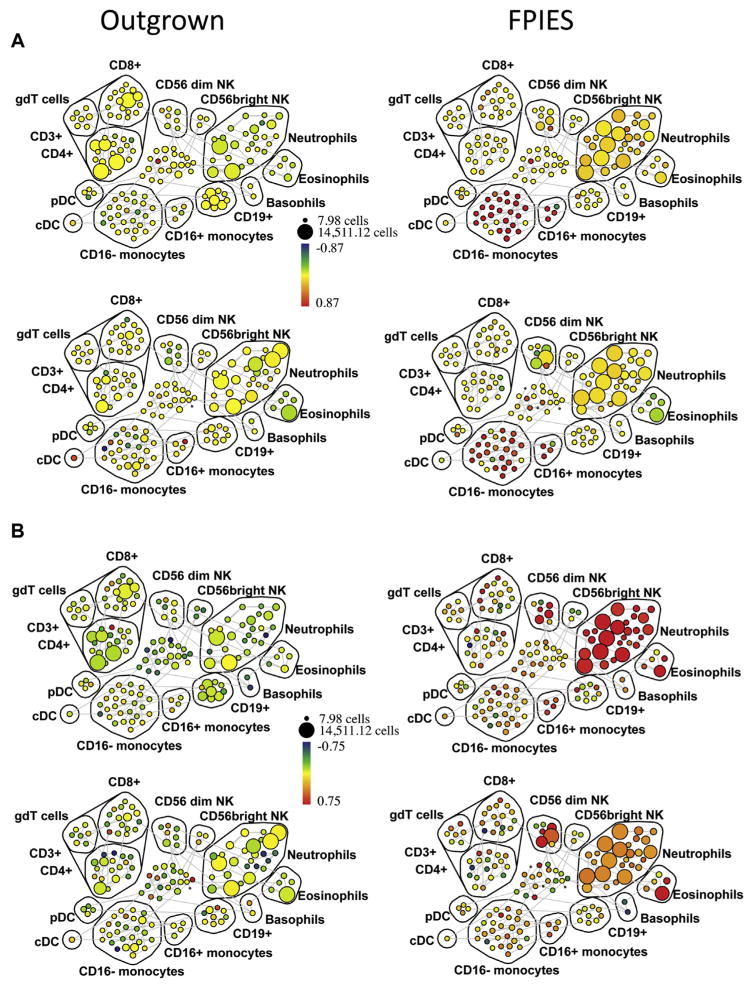
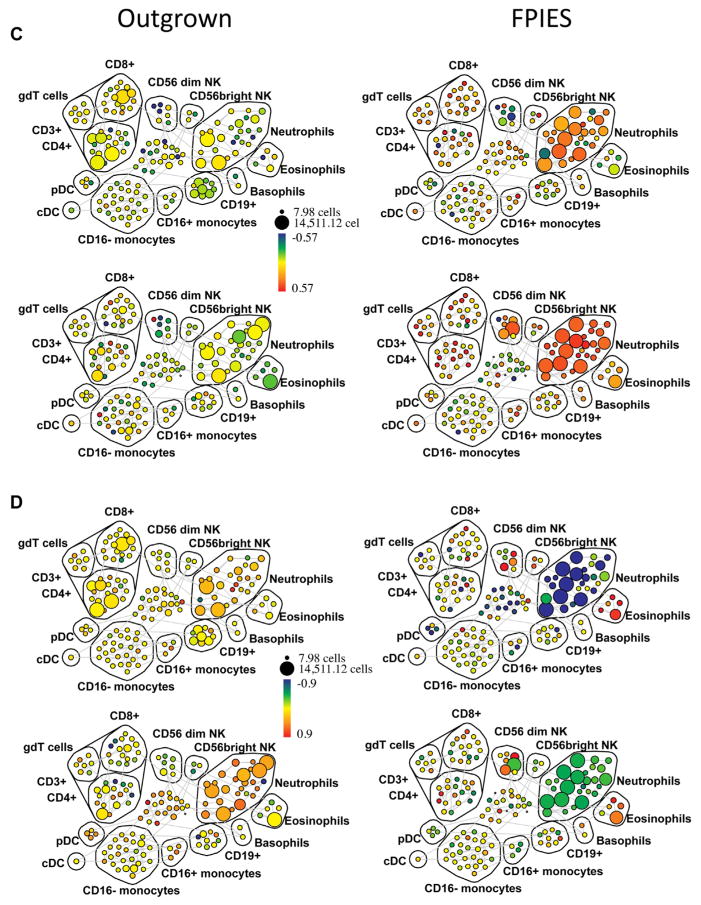
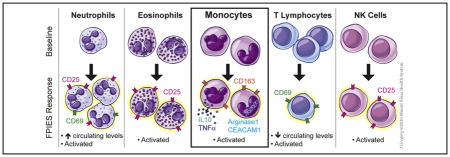
We used spanning-tree progression analysis of density-normalized events (SPADE) analysis to examine the change in expression (postchallenge compared with prechallenge) of a number of activation markers across all hematopoietic populations. Cell populations were identified on the basis of positive and negative expression of surface markers (see Fig E4 in this article’s Online Repository at www.jacionline.org). We observed an expansion of neutrophils and CD56dim NK cells, and a loss of CD4+ and CD8+ T cells and CD56bright NK cells postchallenge in those with active FPIES but not in those with outgrown FPIES (see Fig E5 in this article’s Online Repository at www.jacionline.org). We found evidence for global activation of monocytes, neutrophils, eosinophils, and NK cells in those with active FPIES but not in those with outgrown FPIES. As shown in Fig 4, A (as fold change, with median intensity shown in Fig E6 in this article’s Online Repository at www.jacionline.org), the monocyte activation marker CD163 was markedly upregulated after challenge in CD16+CD14+ and CD16−CD14+ monocytes in subjects who reacted to food challenge, but not in those without symptoms. The activation marker CD25 was upregulated on a number of immune subsets (Fig 4, B; see Fig E7 in this article’s Online Repository at www.jacionline.org), most strikingly eosinophils and CD56dim NK cells but also neutrophils. Activated neutrophils downregulate FcγRIII, which was observed after challenge in those with active FPIES (Fig 4, D; see Fig E9 in this article’s Online Repository at www.jacionline.org). Neutrophils were also found to upregulate expression of CD69, which has been reported to occur in response to cytokine stimulation.19 CD69 was also increased throughout the CD3+ cell compartment, which also showed a loss of cell numbers (Fig 4, C; see Fig E8 in this article’s Online Repository at www.jacionline.org). These data indicate a broad activation of innate immune cells during adverse reactions to foods in FPIES, as well as a global loss of T lymphocytes from the circulation.
FIG. 4.
Innate cell activation in peripheral blood measured by CyTOF. Peripheral blood was obtained before and after food challenge in 4 subjects, 2 with active FPIES and 2 with outgrown FPIES. Shown are SPADE plots indicating fold change (postchallenge vs prechallenge) in CD163 (A), CD25 (B), CD69 (C), and CD16 (D) expression across immune subsets. The size of the bubbles represents the cell number in each node, while the color intensity indicates fold change in the expression of the respective marker relative to prechallenge baseline. The cell populations are labeled as identified by pattern of surface marker expression. Note the increased expression of CD163 in the monocyte populations, and increased CD25 in CD56dim NK cells, neutrophils, and eosinophils in subjects with FPIES, but not in outgrown subjects. CD69 expression shows upregulation across multiple immune compartments including the T-lymphocyte populations. SPADE, Spanning-tree progression analysis of density-normalized events.
Innate immune activation in peripheral blood identified by RNA sequencing
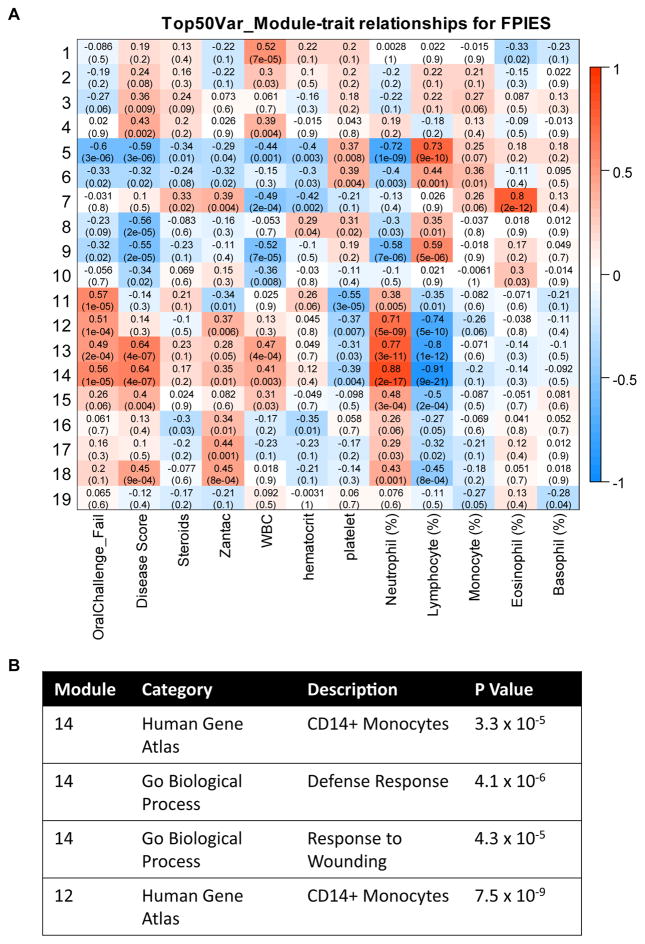
We obtained RNA samples from whole blood of 26 subjects before and 4 to 6 hours after food challenge, including 14 with outgrown FPIES who did not react on challenge, and 12 with active FPIES who reacted on challenge. We performed RNA sequencing to obtain a transcriptional profile of the whole peripheral blood compartment. In addition, we identified coexpressed gene modules, and examined correlation of these with parameters including response to food challenge. Three modules had a high positive correlation with challenge outcome and circulating neutrophils and a negative correlation with circulating lymphocytes (Fig 5). Pathway analysis showed significant enrichment for CD14+ monocytes, despite the lack of correlation with circulating monocyte levels. Furthermore, pathway analysis showed a significant enrichment for genes associated with “Defense Response” and “Response to Wounding.”
FIG. 5.
Relationship between coexpressed gene modules and clinical and immunologic characteristics. A, Association between gene modules and clinical characteristics, including clinical response to challenge, complete blood cell counts, and treatment. Red indicates positive correlation, blue indicates negative correlation, and text in each box indicates correlation with P value in parentheses. B, Table showing selected enrichment analysis results for modules 12 and 14.
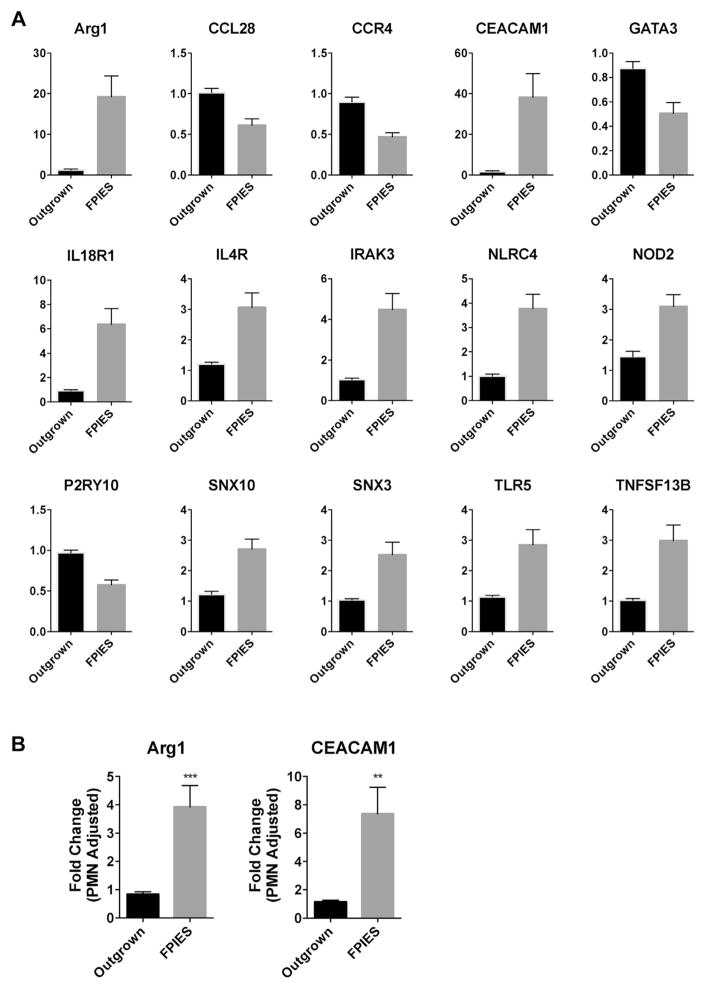
We then examined the expression of innate immunity genes selected from a correlated gene module (Fig 6). We observed significant upregulation and downregulation of a number of key innate immune genes in the active FPIES cohort, but not the outgrown cohort, after challenge (Fig 6). These included arginase 1 (ARG1), CEACAM1, NLRC4, NOD2, TLR5, and BAFF (TNFSF13B). We also observed downregulation of the genes CCL28, CCR4, and GATA3. Several of these genes, such as CEACAM1 (also known as CD66a), are expressed by neutrophils and may reflect changes in neutrophil number. We used the neutrophil marker genes STEAP4, DYSF, and KCNJ15 to adjust for neutrophil number.20 These genes were significantly upregulated after challenge in those with active FPIES but not in outgrown subjects (not shown). Adjustment of CEACAM1 and ARG1 expression with these neutrophil marker genes resulted in a maintained significant upregulation, indicating that increased expression is due to upregulation on activation, as well as increased neutrophil cell number.
FIG. 6.
Challenge-induced changes in innate immune gene expression. A, Fold change in gene expression from whole blood (postchallenge vs prechallenge) for candidate immune genes selected from module 14 in Fig 5. Only candidate genes with significant differences (with False Discovery Rate correction of 0.01 for multiple comparisons) are shown. Mean + SEM of n = 14 (Outgrown) and 11 (FPIES). B, Adjustment of gene expression using neutrophil-specific genes. **P < .01 and ***P < .001.
DISCUSSION
The immune mechanisms responsible for severe vomiting and shock-like symptoms in response to specific food ingestion in FPIES remain poorly understood. Our data do not provide an immunologic explanation for the antigen specificity of reactions to foods in FPIES as we do not find evidence for either antibodies11 or T-cell responses specific to foods that are outside of the normal range. Clinical responses to challenge with purified milk allergens, including caseins, have been reported.21 This indicates that reactions are not triggered by a nonprotein source. Our lack of detection of an increased frequency or altered phenotype of allergen-responsive T cells does not necessarily rule out a role of T cells in FPIES. One explanation is that antigen-responsive cells with a pathogenic phenotype are localized to the gastrointestinal tract and not found in circulation. In celiac disease, circulating antigen-specific T cells have been identified only 6 days after antigen provocation22,23 and therefore 6 hours postchallenge may be insufficient time for expansion or mobilization of food-specific T cells with a unique pathogenic phenotype into the circulation after activation within the gastrointestinal mucosa. However, in IgE-mediated food allergy and eosinophilic gastroenteritis, food-specific T cells can be readily identified in peripheral blood after ex vivo stimulation.24,25 Another explanation for our lack of detection of increased food-specific T cells is that antigens must be modified in the gastrointestinal tract to elicit recognition, similar to gluten peptides in celiac disease.26 However, elicitation of lower gastrointestinal symptoms has been described in response to rectal administration of cow’s milk,27 indicating that there is some level of immune activation in the absence of exposure to enzymes from stomach or small intestine. Further studies are clearly needed to identify the mechanism of recognition of food antigens by the immune system in FPIES.
In our previous report, we used proliferation-based assays and measurement of cytokines in culture supernatants to profile the immune response in FPIES.11 We previously observed an increase in IL-9 and a decrease in IL-10 from milk-restimulated PBMCs from active versus outgrown FPIES. Using CD154-based approaches, we were unable to identify milk, soy, or rice-responsive T cells expressing these cytokines. This suggests that the source of these cytokines may be non–T cells. We show that IL-10 is produced by CD14+ monocytes in response to milk or rice allergen stimulation in vitro, and that IL-10 as well as TNF-α production was suppressed after reactions to food challenge. We observed a broad systemic innate immune activation associated with positive food challenges. We first observed that monocytes were less responsive to allergen stimulation when obtained after a positive food challenge, and based on this observation we used CyTOF profiling to identify immune activation that occurred in vivo during a positive food challenge. This was observed not just on monocytes, but also on neutrophils, eosinophils, and CD56dim NK cells. We also observed changes in gene expression consistent with innate immune activation, with CD14+ monocytes being identified through pathway analysis. This systemic innate immune activation may contribute to shock-like symptoms of FPIES including hypotension and pallor. Interestingly, innate immune activation featuring NK cell activation and enrichment of pathways consistent with TLR4- and TREM1-activated monocytes has been identified through transcriptional profiling of IgE-mediated food allergy. Stone et al28 identified these pathways as upregulated in vivo in patients presenting to the emergency department with anaphylaxis, and we recently found the same pathways to be induced by egg stimulation in patients with IgE-mediated egg allergy.29 The mechanism triggering this innate immune activation in FPIES is not clear. Although we observed direct activation of monocytes by milk and rice allergens in vitro, this was not a response that was unique to subjects with FPIES. Activated cells in vivo could potentially be responding to systemic release of a cytokine. In a previous report, we had measured cytokines in the serum of subjects undergoing food challenge for FPIES. In blood obtained 4 hours after symptom onset, we did not observe a significant increase in proinflammatory cytokines such as TNF-α, IL-1, or IL-6, but we did observe a significant increase in serum IL-10 as well as IL-8 in those who had FPIES reactions,11 likely reflecting the innate cell activation in vivo that we report here. A more detailed kinetic analysis of systemic mediators, including cytokines, is needed to understand the relationship between systemic mediator release, systemic immune cell activation, and symptoms. Of particular importance is to identify immune activation that precedes the onset of symptoms.
Although we could not identify an antigen-specific T-cell response in FPIES, we observed a global loss of lymphocytes from the peripheral circulation following a positive food challenge. Using CyTOF analysis, we observed a broad activation of CD4+, CD8+, and γδ lymphocytes in addition to innate cell activation. The mechanism of this global lymphocyte activation may be in response to cytokines or other circulating mediators. It has been shown in mice that pan–T-cell activation using anti-CD3 antibodies leads to gastrointestinal homing of TH17 cells resulting in intestinal damage,30 suggesting a potential link between acute reactions in FPIES and enteropathy observed in response to chronic allergen exposure.
A limitation of these studies is the use of peripheral blood to study immune mechanisms of adverse reactions to foods. Because FPIES manifestations are systemic, leading to shock-like symptoms, it is reasonable to think that peripheral blood would be an appropriate site for examination of immune activation. However, important eliciting events may be restricted to the gastrointestinal tract. Intestinal biopsy is not required for clinical care, and therefore there is a need for minimally invasive approaches of profiling the gastrointestinal mucosa during FPIES challenges. Other limitations include the difference in timing of blood draw between those who passed versus failed food challenge (4 vs ~6 hours). We cannot rule out a contribution of this difference in timing. The imbalance in sex between groups is also a factor that we were not able to control for and could contribute to differences found.
In summary, we show that adverse reactions to foods in subjects with FPIES are associated with a broad systemic innate activation as well as activation and redistribution of lymphocytes from the circulation. We have not yet identified the upstream triggering mechanism of specific recognition of foods, as there is a marked absence of abnormal or elevated antigen-specific B- or T-cell responses. Further studies are needed to study whether innate immune activation precedes symptom onset, as well as to identify the mechanism of food antigen recognition in the gastrointestinal mucosa.
Supplementary Material
Key messages.
FPIES reactions after food challenge are associated with a systemic activation of innate cells including neutrophils, monocytes, eosinophils, and NK cells, and a redistribution of T cells from the peripheral circulation.
Food allergen-specific T cells are detected in the peripheral blood of subjects with FPIES, but are within the range found in healthy controls.
Acknowledgments
M.C.B. was supported by the National Institute of Allergy and Infectious Diseases (grant nos. NIAID R01AI093577 and NIAID U24AI118644).
Abbreviations used
- FPIES
Food protein–induced enterocolitis syndrome
- NK
Natural killer
- OFC
Oral food challenge
Footnotes
Disclosure of potential conflict of interest: M. C. Berin receives grant support from the National Institutes of Health and travel support from the American Academy of Allergy, Asthma & Immunology. A. Rahman receives grant support from the National Institute of Allergy and Infectious Diseases. A. Nowak-We grzyn serves as a consultant for Nestle, Nutricia, and Aimmune; received grant support from DBV, FARE, Nestle, and Nutricia; received payments for lectures from Thermofisher; received royalties from UpToDate; and received payments for lectures from Annenberg Center. The rest of the authors declare that they have no relevant conflicts of interest.
References
- 1.Nowak-Wegrzyn A, Katz Y, Mehr SS, Koletzko S. Non-IgE-mediated gastrointestinal food allergy. J Allergy Clin Immunol. 2015;135:1114–24. doi: 10.1016/j.jaci.2015.03.025. [DOI] [PubMed] [Google Scholar]
- 2.Caubet JC, Ford LS, Sickles L, Jarvinen KM, Sicherer SH, Sampson HA, et al. Clinical features and resolution of food protein-induced enterocolitis syndrome: 10-year experience. J Allergy Clin Immunol. 2014;134:382–9. doi: 10.1016/j.jaci.2014.04.008. [DOI] [PubMed] [Google Scholar]
- 3.Berin MC. Immunopathophysiology of food protein-induced enterocolitis syndrome. J Allergy Clin Immunol. 2015;135:1108–13. doi: 10.1016/j.jaci.2014.12.1948. [DOI] [PMC free article] [PubMed] [Google Scholar]
- 4.Ruffner MA, Ruymann K, Barni S, Cianferoni A, Brown-Whitehorn T, Spergel JM. Food protein-induced enterocolitis syndrome: insights from review of a large referral population. J Allergy Clin Immunol Pract. 2013;1:343–9. doi: 10.1016/j.jaip.2013.05.011. [DOI] [PubMed] [Google Scholar]
- 5.Ludman S, Harmon M, Whiting D, du Toit G. Clinical presentation and referral characteristics of food protein-induced enterocolitis syndrome in the United Kingdom. Ann Allergy Asthma Immunol. 2014;113:290–4. doi: 10.1016/j.anai.2014.06.020. [DOI] [PubMed] [Google Scholar]
- 6.Sopo SM, Giorgio V, Dello Iacono I, Novembre E, Mori F, Onesimo R. A multicentre retrospective study of 66 Italian children with food protein-induced enterocolitis syndrome: different management for different phenotypes. Clin Exp Allergy. 2012;42:1257–65. doi: 10.1111/j.1365-2222.2012.04027.x. [DOI] [PubMed] [Google Scholar]
- 7.Savilahti E. Immunochemical study of the malabsorption syndrome with cow’s milk intolerance. Gut. 1973;14:491–501. doi: 10.1136/gut.14.6.491. [DOI] [PMC free article] [PubMed] [Google Scholar]
- 8.McDonald PJ, Goldblum RM, Van Sickle GJ, Powell GK. Food protein-induced enterocolitis: altered antibody response to ingested antigen. Pediatr Res. 1984;18:751–5. doi: 10.1203/00006450-198408000-00016. [DOI] [PubMed] [Google Scholar]
- 9.Shek LPC, Bardina L, Castro R, Sampson HA, Beyer K. Humoral and cellular responses to cow milk proteins in patients with milk-induced IgE-mediated and non-IgE-mediated disorders. Allergy. 2005;60:912–9. doi: 10.1111/j.1398-9995.2005.00705.x. [DOI] [PubMed] [Google Scholar]
- 10.Konstantinou GN, Ramon B, Grishin A, Caubet JC, Bardina L, Sicherer SH, et al. The role of casein-specific IgA and TGF-beta in children with food protein-induced enterocolitis syndrome to milk. Pediatr Allergy Immunol. 2014;25:651–6. doi: 10.1111/pai.12288. [DOI] [PMC free article] [PubMed] [Google Scholar]
- 11.Caubet JC, Bencharitiwong R, Ross A, Sampson HA, Berin MC, Nowak-Wegrzyn A. Humoral and cellular responses to casein in patients with food protein-induced enterocolitis to cow’s milk. J Allergy Clin Immunol. 2017;139:572–83. doi: 10.1016/j.jaci.2016.02.047. [DOI] [PubMed] [Google Scholar]
- 12.Heyman M, Darmon N, Dupont C, Dugas B, Hirribaren A, Blaton MA, et al. Mononuclear cells from infants allergic to cow’s milk secrete tumor necrosis factor alpha, altering intestinal function. Gastroenterology. 1994;106:1514–23. doi: 10.1016/0016-5085(94)90405-7. [DOI] [PubMed] [Google Scholar]
- 13.Morita H, Nomura I, Orihara K, Yoshida K, Akasawa A, Tachimoto H, et al. Antigen-specific T-cell responses in patients with non-IgE-mediated gastrointestinal food allergy are predominantly skewed to T(H)2. J Allergy Clin Immunol. 2013;131:590–2. e1–6. doi: 10.1016/j.jaci.2012.09.005. [DOI] [PubMed] [Google Scholar]
- 14.Powell GK. Milk- and soy-induced enterocolitis of infancy: clinical features and standardization of challenge. J Pediatr. 1978;93:553–60. doi: 10.1016/s0022-3476(78)80887-7. [DOI] [PubMed] [Google Scholar]
- 15.Rahman AH, Tordesillas L, Berin MC. Heparinreduces nonspecific eosinophil staining artifacts in mass cytometry experiments. Cytometry A. 2016;89:601–7. doi: 10.1002/cyto.a.22826. [DOI] [PMC free article] [PubMed] [Google Scholar]
- 16.Qiu P, Simonds EF, Bendall SC, Gibbs KD, Jr, Bruggner RV, Linderman MD, et al. Extracting a cellular hierarchy from high-dimensional cytometry data with SPADE. Nat Biotechnol. 2011;29:886–91. doi: 10.1038/nbt.1991. [DOI] [PMC free article] [PubMed] [Google Scholar]
- 17.Langfelder P, Horvath S. WGCNA: an R package for weighted correlation network analysis. BMC Bioinformatics. 2008;9:559. doi: 10.1186/1471-2105-9-559. [DOI] [PMC free article] [PubMed] [Google Scholar]
- 18.Behbehani GK, Thom C, Zunder ER, Finck R, Gaudilliere B, Fragiadakis GK, et al. Transient partial permeabilization with saponin enables cellular barcoding prior to surface marker staining. Cytometry A. 2014;85:1011–9. doi: 10.1002/cyto.a.22573. [DOI] [PMC free article] [PubMed] [Google Scholar]
- 19.Atzeni F, Schena M, Ongari AM, Carrabba M, Bonara P, Minonzio F, et al. Induction of CD69 activation molecule on human neutrophils by GM-CSF, IFN-gamma, and IFN-alpha. Cell Immunol. 2002;220:20–9. doi: 10.1016/s0008-8749(03)00002-9. [DOI] [PubMed] [Google Scholar]
- 20.Liu SM, Xavier R, Good KL, Chtanova T, Newton R, Sisavanh M, et al. Immune cell transcriptome datasets reveal novel leukocyte subset-specific genes and genes associated with allergic processes. J Allergy Clin Immunol. 2006;118:496–503. doi: 10.1016/j.jaci.2006.04.040. [DOI] [PubMed] [Google Scholar]
- 21.Kuitunen P, Visakorpi JK, Savilahti E, Pelkonen P. Malabsorption syndrome with cow’s milk intolerance: clinical findings and course in 54 cases. Arch Dis Child. 1975;50:351–6. doi: 10.1136/adc.50.5.351. [DOI] [PMC free article] [PubMed] [Google Scholar]
- 22.Raki M, Fallang LE, Brottveit M, Bergseng E, Quarsten H, Lundin KE, et al. Tetramer visualization of gut-homing gluten-specific T cells in the peripheral blood of celiac disease patients. Proc Natl Acad Sci U S A. 2007;104:2831–6. doi: 10.1073/pnas.0608610104. [DOI] [PMC free article] [PubMed] [Google Scholar]
- 23.du Pre MF, van Berkel LA, Raki M, van Leeuwen MA, de Ruiter LF, Broere F, et al. CD62L(neg)CD38(+) expression on circulating CD4(+) T cells identifies mucosally differentiated cells in protein fed mice and in human celiac disease patients and controls. Am J Gastroenterol. 2011;106:1147–59. doi: 10.1038/ajg.2011.24. [DOI] [PMC free article] [PubMed] [Google Scholar]
- 24.DeLong JH, Simpson KH, Wambre E, James EA, Robinson D, Kwok WW. Ara h 1-reactive T cells in individuals with peanut allergy. J Allergy Clin Immunol. 2011;127:1211–8. e3. doi: 10.1016/j.jaci.2011.02.028. [DOI] [PMC free article] [PubMed] [Google Scholar]
- 25.Prussin C, Lee J, Foster B. Eosinophilic gastrointestinal disease and peanut allergy are alternatively associated with IL-5+ and IL-5(−) T(H)2 responses. J Allergy Clin Immunol. 2009;124:1326–32. e6. doi: 10.1016/j.jaci.2009.09.048. [DOI] [PMC free article] [PubMed] [Google Scholar]
- 26.Abadie V, Sollid LM, Barreiro LB, Jabri B. Integration of genetic and immunological insights into a model of celiac disease pathogenesis. Annu Rev Immunol. 2011;29:493–525. doi: 10.1146/annurev-immunol-040210-092915. [DOI] [PubMed] [Google Scholar]
- 27.Freier S, Kletter B, Gery I, Lebenthal E, Geifman M. Intolerance to milk protein. J Pediatr. 1969;75:623–31. doi: 10.1016/s0022-3476(69)80458-0. [DOI] [PubMed] [Google Scholar]
- 28.Stone SF, Bosco A, Jones A, Cotterell CL, van Eeden PE, Arendts G, et al. Genomic responses during acute human anaphylaxis are characterized by upregulation of innate inflammatory gene networks. PLoS One. 2014;9:e101409. doi: 10.1371/journal.pone.0101409. [DOI] [PMC free article] [PubMed] [Google Scholar]
- 29.Kosoy R, Agashe C, Grishin A, Leung DY, Wood RA, Sicherer SH, et al. Transcriptional profiling of egg allergy and relationship to disease phenotype. PLoS One. 2016;11:e0163831. doi: 10.1371/journal.pone.0163831. [DOI] [PMC free article] [PubMed] [Google Scholar]
- 30.Esplugues E, Huber S, Gagliani N, Hauser AE, Town T, Wan YY, et al. Control of TH17 cells occurs in the small intestine. Nature. 2011;475:514–8. doi: 10.1038/nature10228. [DOI] [PMC free article] [PubMed] [Google Scholar]
Associated Data
This section collects any data citations, data availability statements, or supplementary materials included in this article.


