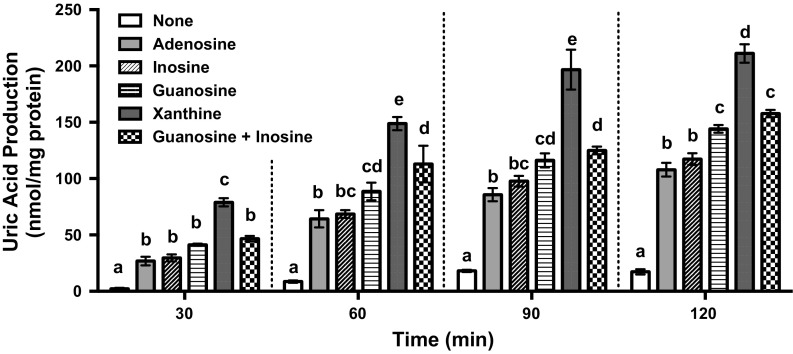
Fig. 3.
Time-course of uric acid production in AML12 cells after addition of its precursors. AML12 cells were treated with various UA precursors in 300 µl of BSS with 100 µM adenosine, 100 µM inosine, 100 µM guanosine, 100 µM xanthine, guanosine + inosine (100 µM each), and BSS alone (control). Uric acid production was measured by the uricase method at 30, 60, 90 and 120 min after treatment of the precursors, Each value represents mean ± SEM four wells (single measurement per well). Values not sharing a common letter are significantly different at P < 0.05 (Tukey test)

