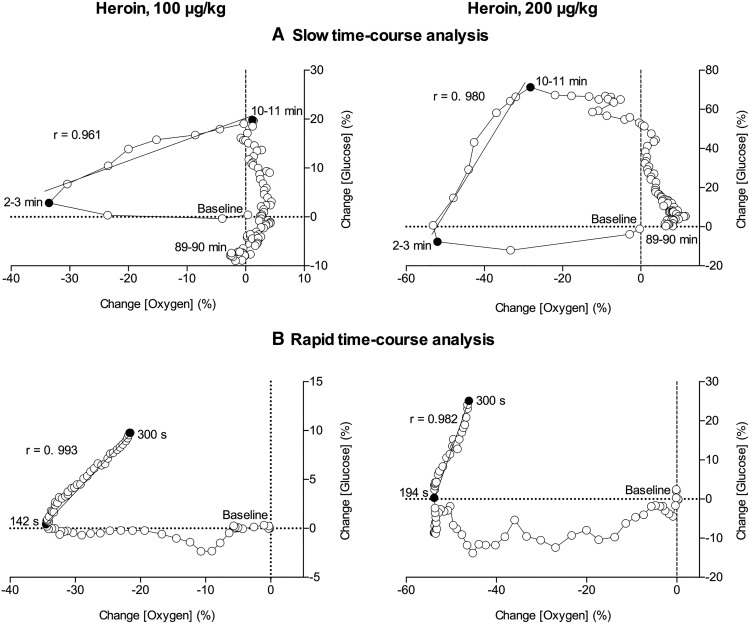
Figure 3.
Correlative relationships between slow (A, 1-min bin) and rapid (B, 4-s bin) changes in oxygen and glucose induced by iv heroin at 100 and 200 μg/kg doses. Initial value immediately preceding heroin injection (0 for both oxygen and glucose) is marked as baseline. The period assessed for correlation is shown as the period between filled black circles. A line of best fit is shown with the correlation coefficient (r). Data are shown as percentage change from baseline. For details, see Results.

