

Abstract
BACKGROUND
CatWalk is one of the most popular tools for evaluating gait recovery in preclinical research, however, there is currently no consensus on which of the many gait parameters captured by CatWalk can reliably model recovery. There are conflicting interpretations of results, along with many common but seldom reported problems such as heel walking and poor compliance.
NEW METHOD
We developed a systematic manual classification method that overcomes common problems such as heel walking and poor compliance. By correcting automation errors and removing inconsistent gait cycles, we isolated stretches of recordings that are more reliable for analysis. Recovery outcome was also assessed by quantitative histomorphometric analysis of myelinated axons.
RESULTS
While 40–60% of runs were erroneously classified without manual intervention, we corrected all errors with our new method, and showed that Stand Time, Duty Cycle, and Swing Speed are able to track significant differences over time and between experimental groups (all p<0.05). The usability of print area and intensity parameters requires further validation beyond the capabilities of CatWalk.
COMPARISON WITH EXISTING METHOD(S)
There is currently no strategy that addresses problems such as heel walking and poor compliance, and therefore no standard set of parameters that researchers can rely on to report their findings.
CONCLUSION
Manual classification is a crucial step to generate reliable CatWalk data, and Stand Time, Duty Cycle, and Swing Speed are suitable parameters for evaluating gait recovery. Static parameters such as print area and intensity should be used with extreme caution.
Keywords: CatWalk, Peripheral Nerve, Rat, Functional Recovery, Gait, Heel Walking
1. INTRODUCTION
Peripheral nerve injury is a major burden to healthcare systems worldwide, affects 1.4 million patients, and costs over $150 billion dollars every year (Jia et al., 2014; Jiang et al., 2017; Jones et al., 2016; Taylor et al., 2008). Preclinical rodent studies are particularly valuable due to low cost and high translational potential (Kizilay et al., 2016; Wang et al., 2016), however, researchers must rely on postmortem pathological evaluation with only limited ways to evaluate functional recovery (Bervar, 2000; de Medinaceli et al., 1982). CatWalk has become a popular tool in rodent preclinical studies for evaluating functional recovery due to its ability to acquire a wide variety of gait parameters with its automatic “Auto Classify” function, and it is now widely used in mainstream research protocols in a wide variety of fields including peripheral nerve injury (Bozkurt et al., 2008; Deumens et al., 2007; Deumens et al., 2014; Johnson and Jia, 2016), spinal cord injury (Kjell et al., 2015; Salewski et al., 2015), traumatic brain injury (Kizilay et al., 2016), neurodegenerative diseases (Neckel, 2015) etc.. Google Scholar generated 1520 search results with the search term “CatWalk Gait” and 490 results with “CatWalk Sciatic” since 2006.
While CatWalk is now a widely used tool, it has significant drawbacks. Researchers often choose from wide variety of gait parameters to report their findings without justification of selection preference (Freria et al., 2016; Fujimaki et al., 2016; Hausner et al., 2014; Huang et al., 2012), and there are conflicting interpretations of results across different injury models (Bozkurt et al., 2008; Hamers et al., 2006). The lack of a standard set of parameters and interpretations may due to common but seldom mentioned problems following rat sciatic nerve injury such as preferential heel walking (Deumens et al., 2007; Deumens et al., 2014) and poor compliance (Neckel, 2015). While these problems significantly impair the ability of CatWalk to reliably automatically collect and analyze data, current literature has yet to propose any strategies on how to address them. Therefore, a standard method that effectively addresses these problems must first be established in order to properly identify a standard set of reliable CatWalk gait parameters.
The goal of this study is to establish a standard data processing method to account for and address inherent problems such as heel walking and poor compliance, and to identify a set of CatWalk parameters that is capable of consistently evaluating injury and recovery. Current literature evaluating CatWalk only employ a single injury group and a sham group, so to emulate current research practices, we employed three experimental groups, each receiving nerve resection injury followed by different interventions leading to different levels of recovery: one with an autologous nerve graft (clinical gold standard) to serve as positive control, one with an empty nerve conduit to serve as negative control, and one with human neural crest stem cell (NCSC) implantation to serve as the study target (Bozkurt et al., 2008), which leads to improvements in recovery that is superior to empty nerve conduits but not as effective as autologous nerve grafts (Georgiou et al., 2015; Ni et al., 2013; Wang et al., 2015).
2. METHODS AND MATERIALS
2.1 Animals
All animals were maintained according to NIH guidelines, and experimental protocols approved by the IACUC of the University of Maryland School of Medicine. Every attempt was made to minimize the total number of animals used and their discomfort and pain. In this study, 36 athymic nude rats were used. Rats were individually housed in a controlled temperature (21 ± 1 °C) and humidity (50 ± 15%) throughout this study with a 12:12h light/dark cycle to reduce stress. All rats had free access to food and water throughout this study except the pre-surgery training period.
2.2 CatWalk training and recordings
Research protocols involving CatWalk were described in our previous studies (Johnson et al., 2015; Zhen et al., 2013). The CatWalk XT (Noldus Information Technology, The Netherlands) system includes a 1.0 meter enclosed walkway on which rats to traverse from side to side and recordings are made. For our experiment, one week prior to surgery, animals were trained daily on the CatWalk system until they were able to consistently make uninterrupted runs. Animals were placed under food-restriction 12 hours before the training, and food pellet rewards were used to motivate animals to cross the CatWalk runway during training. Training was considered complete when animals were able to make five consecutive uninterrupted runs within 1.0s and 2.0s. One day prior to surgery, five baseline runs were performed and recorded for each rat. Post-surgery measurements were taken at 2, 6, and 12 weeks. Each rat was placed on the CatWalk system and repeatedly performed runs until they were able to complete five uninterrupted runs.
2.3 Surgical Procedure, Euthanasia, Histomorphometric Analysis, and Wet Muscle Weight Measurements
Surgical procedures have been described in our previous studies (Johnson et al., 2015; Lewitus et al., 2011). In brief, Athymic nude rats (200–250g) were anesthetized with isoflurane, and a 15mm segment of the sciatic nerve was removed and repaired with one of three implants: A) inverted autologous nerve graft, B) empty nerve guide conduit, and C) human neural crest stem cell (NCSC) filled nerve guide conduit (12 rats each). NCSCs were derived from embryonic stem cells (ESCs, H9 line from WiCell, Madison, WI), and for each conduit, we injected 2×10⁶ NCSCs suspended in 15μl mixture of growth medium and Collagen I Rat Tail (Life Technologies, NY). For each group, half was euthanized at 6 weeks, and the other at 12 weeks. We used postmortem histomorphometric analysis as a reference to justify results derived from the CatWalk system since histomorphometric analysis is widely used in current studies as a gold standard for evaluating recovery following sciatic nerve injury (Gan et al., 2016; Kabiri et al., 2015; Lin et al., 2013). We have described the methods of histomorphometric analysis in past studies (Johnson et al., 2015). In brief, rats were perfused, and the middle section of the repair site was harvested and mounted in embedding resin. Sets of 0.5 μm thick specimens were sectioned on an Ultracut E microtome, stained with toluidine blue, and imaged via light microscopy at 40x magnification. The number of myelinated axon fibers were counted with ImageJ (National Institutes of Health, Bethesda, MD). After euthanization, rat gastrocnemius muscles were retrieved from the injured limbs and compared between groups at different time points.
2.4 Automated Data Collection
Print area (the total print area (cm2) for given paw), mean intensity (average pressure of print for given paw), stand time (time spent bearing weight per step for given paw), duty cycle (percentage of time spent bearing weight in each walk cycle for given paw), swing speed (the speed (cm/s) of the limb between steps for given paw), and stride length (the distance (cm) between steps for given paw) for both hindlimbs were collected from the CatWalk XT system after performing the “Auto Classify” function. Then, the Right Hindlimb (RH, injured) to Left Hindlimb (LH, healthy) ratios were calculated, and standardized against the baseline RH/LH ratio. Standardization with the contralateral hindlimb accounts for the variance due to weight and run calibration, and standardization with baseline ratios accounts for the natural tendency of each rat to bear weight on a particular side (Boyd et al., 2007). These standardized ratios were then averaged for a given rat at a given time point. These parameters were chosen due to their prevalence in recent studies. Due to the arithmetic involved in the standardization process, results are represented as percentage values. The number of runs with erroneous classifications was recorded for each group after injury at the 2-week, 6-week and 12-week time points. The number of rats walking on heels instead of paws were also recorded at all time points.
2.5 Manual Classification
We developed a manual processing method which involves thorough error correction and selection criteria to qualify runs. First, any unclassified steps are properly assigned. Second, all non-paw signals (genitals, tail, abdomen, nose etc.) are manually marked as “junk,” and all steps are properly assigned to the correct limbs. Third, single steps that are erroneously classified as multiple steps are combined to correctly represent single steps. Fourth, only consistent walk cycles during which the animal does not change direction, turn its head, or change its walking speed are preserved, and all inconsistent walk cycles are manually removed. Finally, we identified runs in which the animals showed at least two “consistent” step cycles. Consistent cycles are defined as cycles in which the stand time parameter for each individual limb has an SEM less than 10% of the mean for the run. All runs without at least two consistent step cycles are removed from analysis. The reasoning behind selecting two steps as a threshold is that the calculation of dynamic data such as duty cycle, swing speed, and stride length require at least two steps per limb.
2.6 Heel and paw print analysis
After manual classification of runs, prints of the injured hindlimb were further evaluated. First, heel prints are isolated manually for analysis by removing paw prints for all runs, then paw prints are manually isolated by removing heel prints, and finally, heel and paw prints are both included for combined analysis. On all 450 run recordings from our experiment, all runs were analyzed, and each step in each run recording were manually processed three separate times for the three analyses described above. A more detailed array of 11 print area and intensity related metrics (max contact at (%), max contact area, max contact max intensity, max contact mean intensity, print length, print width, print area, max intensity at, max intensity, min intensity, and mean intensity) were taken into consideration. Data for heel prints, paw prints, and the average of heel and paw prints were independently collected, normalized to the contralateral hindlimb, and evaluated. Since not all rats showed paw prints, the number of rats showing paw prints were also recorded for each group at each time point.
2.7 Forelimb Data Processing
In most sciatic nerve injury models, gait analysis is done exclusively on the hindlimbs. While hindlimb parameters are more direct in assessing injury and recovery compared to forelimb parameters, the ability of CatWalk to capture subtle changes makes it possible for us to observe minute alterations in forelimb gait parameters. Previous studies have shown that forelimb behavior is also affected by hindlimb injury (Boyd et al., 2007). Since forelimbs are not affected by common confounding factors such heel-walking, we have elected to evaluate forelimb intensity in our model to see if it is possible to evaluate injury and recovery using forelimb data. The mean intensities of both forelimbs are recorded after the carrying out the manual processing protocol described above, and data are processed and analyzed using the same methods. Results are reported as right to left ratios (R/L) normalized to baseline R/L values.
2.8 Statistical Methods
Data are expressed as mean ± SEM. Repeated Measures ANOVA was performed within groups to model recovery, and Univariate ANOVA tests were used to compare parameters across groups. Least-Significance Difference (LSD) post hoc test was conducted for pairwise comparisons, and Fisher’s Exact test was used when appropriate. P-values of less than 0.05 were deemed significant. All statistical tests are performed on SPSS 20.0 (SPSS Inc., Chicago, IL, USA).
3. RESULTS
3.1 Histomorphometric Analysis and Gastrocnemius Muscle Weight Showed Differentiated Recovery across Experimental Groups Over Time
Overall, there was a significant difference in cell count per 100 um2 when considering all groups and time points (p<0.001 for all). See Figure 1.
Figure 1.

Results from Histomorphometric Analysis using Toluidine Blue staining (A) Representative light microscopy images of sciatic nerve cross sections 6 weeks (a, c, e) and 12 weeks (b, d, f) post operation in conduit only group (a, b), NCSC group (c, d), and Autograft group (e, f). (B) Number of myelinated axons per 100 μm2 counted from the light microscopy images using Image J showed significant improvements from 6 weeks to 12 weeks for both the NCSC and Autograft groups. Data represented as Mean ± SEM. Significance: ***p<0.001, **p<0.01
At 6 weeks, the cell count per 100 um2 was statistically significantly greater for the autograft group (57.17 ± 9.84) than the conduit group (4.00 ± 1.67, p < 0.001) and the NCSC group (8.33 ± 1.76, p < 0.001). The NCSC group showed no significant difference with the conduit only group. Similarly, the cell count was statistically significantly greater for the autograft group (87.83 ± 10.54) at 12 weeks than the conduit group (10.50 ± 1.95, p < 0.001) and the NCSC group (54.33 ± 5.32, p = 0.004). The NCSC group had a significantly larger cell count than the conduit only group (p < 0.001). The Autograft group and NCSC group also showed significant improvements from 6 weeks to 12 weeks (p < 0.001 for both).
Gastrocnemius muscle weight also revealed differentiated recovery across groups. At 6 weeks, the Autograft group had higher gastrocnemius muscle weights (0.31g ± 0.05) than the NCSC group (0.23g ± 0.05, p > 0.05) and the Conduit group (0.17g ± 0.03, p = 0.048). At 12 weeks, the Autograft group also had higher gastrocnemius muscle weight (0.34g ± 0.04) than the NCSC group (0.21g ± 0.35, p = 0.010) and the Conduit group (0.19g ± 0.01, p = 0.003).
3.2 Automated Processing Was Unable to Produce Meaningful Data
At two weeks after injury, 40% of runs (22 out of 55) were impacted by automation errors in the autograft group, along with 57% (34 out of 60) in the NCSC group and 61% (36 out of 59) in the conduit group. These errors were various, and each required specific considerations (See figure 2). First, not all step signals are properly classified, and manual intervention is required to assign unclassified prints properly. Second, there are often junk particles that interfere with proper step characterization which need to be characterized as “JUNK.” Third, some steps are recorded as two, and therefore need to be manually merged. Finally, subtle changes of the direction of the rat during the walk are not taken into account, so inconsistent gait cycles needed to be manually identified and removed from analysis. This high error rate was also observed at 6 weeks (38 out of 60, 33 out of 59, and 34 out of 55 for the autograft, NCSC and conduit groups, respectively) and 12 weeks (16 out of 30, 13 out of 30, and 16 out of 29 for the autograft, NCSC and conduit groups, respective). All rats (36 out of 36) walked on heels instead of paws at all time points. There were no significant differences within the autograft group across time points or between groups at the 6- and 12-week time points for all six investigated gait parameters (all p>0.05).
Figure 2.

Representative screen shots of common mistakes made by the CatWalk “Auto Classify” function and the results of manual correction and adjustment. (A) Right Hind steps were unclassified. Corrected by assigning the correct classification. (B) Junk particles was classified as part of a step, resulting in an incorrect run classification. Corrected by correctly classifying junk particle as “JUNK.” (C) Single steps were classified as two steps. Corrected by merging the steps into one. (D) Animal changed direction and pivoted off the left hind limb to turn to the right. Corrected by removing steps that are affected by poor compliance.
3.3 Manual Classification Improved Data Usability
After manual processing, all errors were corrected, and significant differences across groups were found for stand time, duty cycle, and swing speed.
Stand Time
The stand time metric represents the amount of time per step each limb is contacting the glass and bearing weight during a run (Fig 3). There was an overall significant difference across time points within the Autograft group (p = 0.005), with a significant increase from 6 weeks to 12 weeks (p = 0.012) and from 2 weeks to 12 weeks (p = 0.005). There were no significant differences across time points within the NCSC treated group, however, there was a sizeable increase from 6 week to 12 week (p = 0.06).
Figure 3.
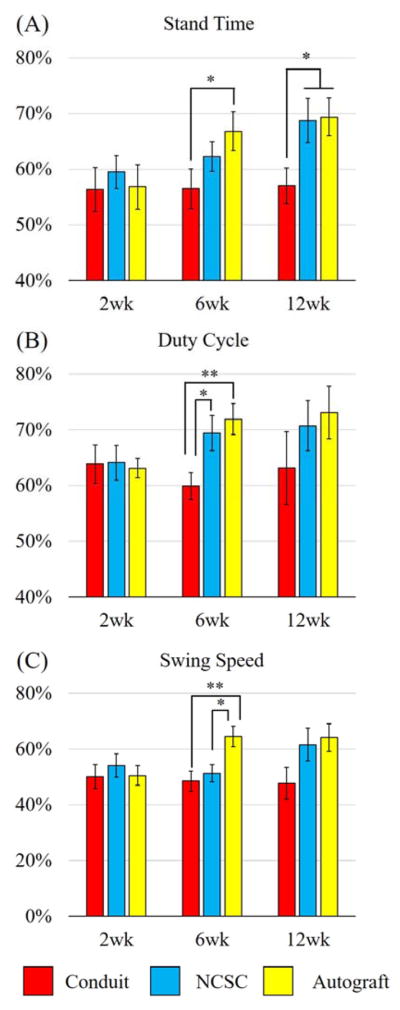
Comparing (A) Stand Time, (B) Duty Cycle, and (C) Swing Speed between experimental groups at the 2wk, 6wk, and 12wk time points. Data represented as Mean ± SEM. Significance: **p<0.01, *p<0.05
Overall comparisons between treatment groups at 6 weeks showed no significant differences, however, stand time for the autograft group (66.83 ± 3.46 %) was significantly longer than the conduit group (56.51 ± 3.53 %, p = 0.031). At 12 weeks, there was an overall significant difference between groups (p = 0.044), with the autograft group (69.4 ± 3.35 %) and the NCSC group (68.74 ± 3.99 %) showing significantly longer stand times than the conduit only group (57.04 ± 3.22 %, p = 0.026, p = 0.034, respectively). There was no statistically significant difference between the autograft and NCSC groups.
Duty Cycle
The duty cycle metric measures the percentage of time a limb is bearing weight during a walk cycle (Fig 3). There was an overall significant difference across time points within the Autograft group (p = 0.016), with a significant increase from 2 week to 12 week (p = 0.043). There were no significant differences across time points within the NCSC treated group.
Overall comparisons between groups at 6 weeks showed a significant difference (p = 0.011), with the autograft group (71.91 ± 2.79 %) and the NCSC group (69.4 ± 3.19 %) showing significantly greater duty cycle figures than the conduit only group (59.91 ± 2.40 %, p = 0.004, p = 0.023, respectively). There was no statistically significant difference between the autograft and NCSC groups. At 12 weeks, there was no significant difference between groups.
Swing Speed
The swing speed metric measures the speed at which limbs travel between steps (Fig 3). There were significant differences across time points within the Autograft group (p = 0.001), with significant improvements from the 2 weeks to 6 weeks (p = 0.001), and from 2 weeks to 12 weeks (p = 0.013). However, there was no significant difference between the 6 week and 12 week time points. There were no significant differences across time points within the NCSC treated group, however, there was a sizeable increase in Swing Speed within the NCSC group from 6 weeks to 12 weeks (p = 0.087).
Overall comparisons between groups at 6 weeks showed a significant difference (p = 0.006), with the autograft group (64.57 ± 3.73 %) showing faster swing speeds than the conduit group (48.56 ± 3.66 %, p = 0.003) and the NCSC group (51.27 ± 3.08 %, p = 0.013). The NCSC group showed no significant difference with the conduit only group at 6 weeks. At 12 weeks, there was no significant difference between groups.
Print Area, Hindlimb Print Intensity, and Stride Length
After manual data processing, there were no significant differences across time points within the autograft group for Print Area, Print Intensity and Stride Length. There was also no overall significant difference between groups at 2 week, 6 week, and 12 week time points, but stride length was significantly longer in the NCSC group than the Conduit Only group at 2 weeks (p = 0.031) and 12 weeks (p = 0.044).
3.4 Heel and Paw Print Analyses Reveal Complicated Effects of Heel Walking on Print Area and Intensity
We manually processed all step data individually for a total of 450 run recordings three separate times to further analyze the effects of heel walking (Figure 4). Heel print analysis revealed that while the mean intensity for the Autograft group increased from 2 to 6 weeks, it decreased from 6 to 12 weeks (90.97 ± 3.82%, 107.89 ± 3.10% and 101.09 ± 3.52%, for 2, 6, and 12 weeks respectively), and the same general trend was seen for the conduit group as well (96.51 ± 1.89%, 103.15 ± 4.52%, 99.6 ± 2.20% for 2, 6, and 12 weeks respectively). The NCSC group showed an increasing trend from 2 to 6 weeks and from 6 to 12 weeks (94.20 ± 4.22%, 107.85 ± 3.07%, 111.95 ± 6.80% for 2, 6, and 12 weeks respectively). At 6 weeks, all three groups showed similar intensities, however, at 12 weeks, the NCSC group showed larger intensities than the conduit and autograft groups. Print Area of the heel prints, along with the rest of the metrics that were considered, showed no observable or statistically significant differences over time or between groups. Paw print analysis and combined heel and paw print analysis did not reveal meaningful data for all 11 metrics.
Figure 4.

Representative prints for the right hind limb. (A) Before injury, prints were complete. After injury, animals utilized their heels to walk, but some animals also used paws along with heels. (B) Heel prints are isolated by marking paw print as junk. (C) Paw prints are isolated by marking Heel prints as junk. (D) Both heel and paw prints are classified as right hind limb. Each print in 450 experimental runs were processed three times to show heel prints, paw prints, and both combined.
While conducting the paw print analysis, we found that not all rats showed paw prints, and when they do, the size and shape of the prints vary greatly. Therefore, intensity and print area figures were meaningless with very large SEMs due to small sample size. However, we were able to count the number of rats that showed paw prints for each group at each time point, and revealed that at 6 weeks, 9 of 12 rats showed paw prints for the autograft group, compared to 4 of 12 for the NCSC group (p > 0.05), and 1 of 12 for the conduit group (p = 0.003). At 12 weeks, there were also more rats (5 of 6) showing paw prints for the autograft group compared to the NCSC and conduit groups (both 3 of 6).
3.5 Forelimb Intensity Results Consistent with Recovery
This metric measures the intensity of the forelimb steps, and is represented as R/L ratio standardized with baseline (Fig 5). There were significant differences across time points within the Autograft group (p < 0.001), with significant improvement in forelimb intensity from the 2 weeks to 6 weeks (p = 0.039), 6 weeks to 12 weeks (p = 0.016), and from 2 weeks to 12 weeks (p = 0.001). There were no significant differences across time points within the NCSC treated group, however, there was a sizeable increase from 2 weeks to the 12 weeks (p = 0.071).
Figure 5.

Showing (A) between groups and (B) within groups comparisons of forelimb intensity. Data represented as Mean ± SEM, **p<0.01, *p<0.05
Overall comparisons between groups at 6 weeks showed no significant differences, however, at 12 weeks, there was significant difference between groups (p = 0.046). More specifically, the autograft group (101.90 ± 1.26 %) was significantly different from the conduit group (107.78 ± 1.41 %, p = .017). The NCSC group (103.35 ± 1.90 %), however, showed no significant difference with the conduit only group or the autograft group.
4. DISCUSSION
CatWalk is a very popular tool for evaluating functional recovery following sciatic nerve injuries in rats, however, due to inherent problems such as heel walking and poor compliance, CatWalk is prone to error and fails to generate consistent and trustable results without extensive manual intervention. We tested and established a manual classification process that overcomes the limitations of CatWalk to address inherent problems, and were able to reliably model injury and recovery following sciatic nerve resection and repair using Stand Time, Duty Cycle, and Swing Speed parameters.
To validate that our injury and recovery model was effective and to provide a reliable reference to validate CatWalk results, we performed post mortem histomorphometric analysis with toluidine-blue staining. This method is currently popular in peripheral nerve regeneration research, and is widely considered as the gold standard evaluative tool (Gan et al., 2016; Kabiri et al., 2015; Lin et al., 2013). As expected, our results very clearly showed differences in recovery between experimental groups, and the Autograft and NCSC groups both showed improvements over time. We also measured wet gastrocnemius muscle mass to further evaluate recovery, and these results showed consistent differences among groups with the histomorphometric results.
While CatWalk automation is convenient in ideal experimental settings, it is not trustable in practice, especially with more complicated injury and repair models such as sciatic nerve resection. All rats preferentially walked on their heels and showed poor compliance after severe peripheral nerve injury, and these phenomena significantly compromised the accuracy of automated classification, giving rise to a high error rate. After injury, the prevalence of automation errors remained unacceptably high throughout the study. Therefore, while CatWalk is equipped to capture gait data of normal rats, we were not able to produce meaningful data without extensive manual intervention after injury. Several factors impacted the accuracy of automated step characterization. For the first time, we demonstrated that manual classification of CatWalk recordings, by manually editing and removing sections of runs that are inconsistent or inappropriately characterized, can overcome the negative impacts of heel walking and poor compliance, and is therefore a crucial step to greatly improve the usability and accuracy of recovery assessment.
After manually processing the CatWalk data using a strict protocol described in the methods section of this study, we found that dynamic gait data, namely Stand Time, Duty Cycle, and Swing Speed, can effectively evaluate functional recovery of large sciatic nerve injuries. These parameters showed significant improvements over time within the autograft group, and sizeable improvements within the NCSC group, agreeing with our histomorphometric results. Automation errors due to preferential heel walking occur largely because the CatWalk system is less able to classify heel walking than normal prints, and the significantly different shape and intensity profile of heel prints gave rise to many misclassifications that require manual correction. Rats also do not walk with constant speed and compliance after injury despite strict training regimens (Neckel, 2015). Thus, rats often pivoted, hesitated, and changed walking speed throughout the run, and when entire runs were classified and analyzed, the results were not reliable. Our method included corrections of classification errors and isolation of consistent walk cycles, and was able to generate reliable results because we were able to correct the negative impacts of heel walking and poor compliance.
Not only were stand time, duty cycle, and swing speed able to reliably model recovery over time, these parameters were also able differentiate recovery between experimental groups. For our study design, we chose to employ three experimental groups to emulate current research practices, and these parameters were able to show significant differences between our experimental groups at various recovery time points. However, unlike histomorphometric results, the rather large variance of the data makes it difficult to consistently and clearly differentiate the three groups at all time points with CatWalk. While this may due to different sensitivities with different measurements, increasing the sample sizes for each group may improve the results.
Despite strenuous efforts to isolate and analyze only consistent gait cycles, we were still unable to model recovery using static parameters such as print area and print intensity. This is due mostly to the common but seldom recognized phenomenon of preferential heel-walking, which affected all of our rats after injury. Peripheral nerve injuries lead to an initial loss followed by a slow gradual recovery of the injured limb’s ability to plantar flex (Varejao et al., 2004). Thus, after injury, rats tend to bear the majority of weight on the heels instead of the paws of their feet after sciatic nerve injury (Bozkurt et al., 2011; Deumens et al., 2007). This phenomenon is seldom reported, and there is still no consensus on how to account for its impact on CatWalk parameters (Deumens et al., 2014).
We attempted to characterize heel walking further by separating heel prints and paw prints of 450 run recordings for individual analysis. We found that from 6 weeks to 12 weeks, the autograft group showed an increase in the number of rats showing recordable paw prints, and a decrease in heel print mean intensity. These findings suggest that the autograft group may have recovered some ability to plantar flex, and were able to divert more weight from the heel to the paws. Studies have shown that the ability of plantar flex is impaired after sciatic injury, and full recovery reverses this affect, however, with more complicated injuries such as nerve resection, 12 weeks may not have been enough for full recovery (Varejao et al., 2004).
The prevalence and effect of heel-walking have been reported in the past, which is generally thought to be a specific phenomenon caused by impairment of the sciatic nerve and unrelated to the central nervous system (Deumens et al., 2007). Previous studies have shown that spinal cord injuries may lead to an increase in the print area of affected limbs (Hamers et al., 2001; Hendriks et al., 2006), however, sciatic nerve injuries generally lead to heel-walking which presents as a general decrease in print area. Given the results of this study, we hypothesize that there may be an interplay of several effects from different injury mechanisms, such as the inability to plantar flex (which causes heel-walking in our model) or neuropathic pain in other models (Bozkurt et al., 2008; Vrinten and Hamers, 2003). While heel print intensity decreased from 6 to 12 weeks in our study possibly due to an increased ability to plantarflex, it increased from 2 to 6 weeks. The increase of intensity over time during recovery is a finding that has been reported, and is thought to represent an increased ability to bear weight on the injured limb, possibly related to gradual post-surgical recovery. Unfortunately, it is not possible to separately evaluate animals’ ability to plantar flex and bear weight using CatWalk since this system is not able to provide thorough insight on how weight is distributed across injured limbs or how much total weight is placed on them.
While hindlimb intensity is compromised by heel walking, forelimb intensity is not, making it potentially more consistent and reliable. Our results also showed that forelimb intensity data concurred with histomorphometric analysis results and other CatWalk data. Changes in forelimb behavior due to sciatic nerve injury has been reported before, and CatWalk is able to detect subtle changes in forelimb intensity following injury which coincides with recovery over time (Boyd et al., 2007). After manual classification, we found that rats compensate for their injury by placing more weight on the ipsilateral forelimb, causing a shift in intensity between the forelimbs to the side of the hindlimb injury. This effect was so evident that significant improvements can be drawn between all three time points within the autograft group.
Through this study, we identified Stand Time and Duty Cycle as suitable metrics for recovery evaluation following rat sciatic nerve injuries. Future studies may be needed to further elucidate the compensatory behavior of the forelimbs, since our preliminary results seem to suggest that changes in compensatory forelimb behavior may be a reliable and sensitive way to evaluate functional recovery. Furthermore, the inability of CatWalk to adequately evaluate the heel-walking phenomenon compromises our ability to evaluate functional recovery using intensity, and marks another potential study target for future research. Additional improvements on the CatWalk system targeted at better evaluation of the heel-walking phenomenon and further investigation of CatWalk in other injury models, such as those involving the CNS, will also be helpful.
5. CONCLUSION
CatWalk is a popular system able to automatically detect many parameters of gait, however, it has many inherent problems that needed to be addressed. Though the automation feature of the software is convenient for researchers, it should not be trusted and relied upon. Further manual processing is a necessary step to improve the usability of results and generate meaningful data. We successfully established a manual processing method that yields reliable dynamic parameters of gait, namely Stand Time, Duty Cycle, and Swing Speed, for recovery evaluation and differentiation across experimental groups. However, due to preferential heel walking after injury, the static parameters of gait (such as Print Area and Mean Intensity) needs further validation and should be used with extreme caution.
Acknowledgments
Supported by Maryland Stem Cell Research Fund (2013-MSCRFE-146-00) (to XJ), and R01HL118084 from NIH (to XJ).
References
- Bervar M. Video analysis of standing--an alternative footprint analysis to assess functional loss following injury to the rat sciatic nerve. Journal of neuroscience methods. 2000;102:109–16. doi: 10.1016/s0165-0270(00)00281-8. [DOI] [PubMed] [Google Scholar]
- Boyd BS, Puttlitz C, Noble-Haeusslein LJ, John CM, Trivedi A, Topp KS. Deviations in gait pattern in experimental models of hindlimb paresis shown by a novel pressure mapping system. Journal of neuroscience research. 2007;85:2272–83. doi: 10.1002/jnr.21366. [DOI] [PubMed] [Google Scholar]
- Bozkurt A, Deumens R, Scheffel J, O’Dey DM, Weis J, Joosten EA, Fuhrmann T, Brook GA, Pallua N. CatWalk gait analysis in assessment of functional recovery after sciatic nerve injury. Journal of neuroscience methods. 2008;173:91–8. doi: 10.1016/j.jneumeth.2008.05.020. [DOI] [PubMed] [Google Scholar]
- Bozkurt A, Scheffel J, Brook GA, Joosten EA, Suschek CV, O’Dey DM, Pallua N, Deumens R. Aspects of static and dynamic motor function in peripheral nerve regeneration: SSI and CatWalk gait analysis. Behavioural brain research. 2011;219:55–62. doi: 10.1016/j.bbr.2010.12.018. [DOI] [PubMed] [Google Scholar]
- de Medinaceli L, Freed WJ, Wyatt RJ. An index of the functional condition of rat sciatic nerve based on measurements made from walking tracks. Experimental neurology. 1982;77:634–43. doi: 10.1016/0014-4886(82)90234-5. [DOI] [PubMed] [Google Scholar]
- Deumens R, Jaken RJ, Marcus MA, Joosten EA. The CatWalk gait analysis in assessment of both dynamic and static gait changes after adult rat sciatic nerve resection. Journal of neuroscience methods. 2007;164:120–30. doi: 10.1016/j.jneumeth.2007.04.009. [DOI] [PubMed] [Google Scholar]
- Deumens R, Marinangeli C, Bozkurt A, Brook GA. Assessing motor outcome and functional recovery following nerve injury. Methods in molecular biology. 2014;1162:179–88. doi: 10.1007/978-1-4939-0777-9_15. [DOI] [PubMed] [Google Scholar]
- Freria CM, Bernardes D, Almeida GL, Simoes GF, Barbosa GO, Oliveira AL. Impairment of toll-like receptors 2 and 4 leads to compensatory mechanisms after sciatic nerve axotomy. Journal of neuroinflammation. 2016;13:118. doi: 10.1186/s12974-016-0579-6. [DOI] [PMC free article] [PubMed] [Google Scholar]
- Fujimaki H, Uchida K, Inoue G, Miyagi M, Nemoto N, Saku T, Isobe Y, Inage K, Matsushita O, Yagishita S, Sato J, Takano S, Sakuma Y, Ohtori S, Takahashi K, Takaso M. Oriented collagen tubes combined with basic fibroblast growth factor promote peripheral nerve regeneration in a 15 mm sciatic nerve defect rat model. Journal of biomedical materials research. Part A. 2016 doi: 10.1002/jbm.a.35866. [DOI] [PubMed] [Google Scholar]
- Gan L, Zhao L, Zhao Y, Li K, Tong Z, Yi L, Wang X, Li Y, Tian W, He X, Zhao M, Li Y, Chen Y. Cellulose/soy protein composite-based nerve guidance conduits with designed microstructure for peripheral nerve regeneration. Journal of neural engineering. 2016;13:056019. doi: 10.1088/1741-2560/13/5/056019. [DOI] [PubMed] [Google Scholar]
- Georgiou M, Golding JP, Loughlin AJ, Kingham PJ, Phillips JB. Engineered neural tissue with aligned, differentiated adipose-derived stem cells promotes peripheral nerve regeneration across a critical sized defect in rat sciatic nerve. Biomaterials. 2015;37:242–51. doi: 10.1016/j.biomaterials.2014.10.009. [DOI] [PubMed] [Google Scholar]
- Hamers FP, Koopmans GC, Joosten EA. CatWalk-assisted gait analysis in the assessment of spinal cord injury. Journal of neurotrauma. 2006;23:537–48. doi: 10.1089/neu.2006.23.537. [DOI] [PubMed] [Google Scholar]
- Hamers FP, Lankhorst AJ, van Laar TJ, Veldhuis WB, Gispen WH. Automated quantitative gait analysis during overground locomotion in the rat: its application to spinal cord contusion and transection injuries. Journal of neurotrauma. 2001;18:187–201. doi: 10.1089/08977150150502613. [DOI] [PubMed] [Google Scholar]
- Hausner T, Marvaldi L, Marton G, Pajer K, Hopf R, Schmidhammer R, Hausott B, Redl H, Nogradi A, Klimaschewski L. Inhibition of calpains fails to improve regeneration through a peripheral nerve conduit. Neuroscience letters. 2014;566:280–5. doi: 10.1016/j.neulet.2014.03.009. [DOI] [PMC free article] [PubMed] [Google Scholar]
- Hendriks WT, Eggers R, Ruitenberg MJ, Blits B, Hamers FP, Verhaagen J, Boer GJ. Profound differences in spontaneous long-term functional recovery after defined spinal tract lesions in the rat. Journal of neurotrauma. 2006;23:18–35. doi: 10.1089/neu.2006.23.18. [DOI] [PubMed] [Google Scholar]
- Huang W, Begum R, Barber T, Ibba V, Tee NC, Hussain M, Arastoo M, Yang Q, Robson LG, Lesage S, Gheysens T, Skaer NJ, Knight DP, Priestley JV. Regenerative potential of silk conduits in repair of peripheral nerve injury in adult rats. Biomaterials. 2012;33:59–71. doi: 10.1016/j.biomaterials.2011.09.030. [DOI] [PubMed] [Google Scholar]
- Jia X, Romero-Ortega MI, Teng YD. Peripheral nerve regeneration: mechanism, cell biology, and therapies. Biomed Res Int. 2014;2014:145304. doi: 10.1155/2014/145304. [DOI] [PMC free article] [PubMed] [Google Scholar]
- Jiang L, Jones S, Jia X. Stem Cell Transplantation for Peripheral Nerve Regeneration: Current Options and Opportunities. International journal of molecular sciences. 2017:18. doi: 10.3390/ijms18010094. [DOI] [PMC free article] [PubMed] [Google Scholar]
- Johnson BN, Jia X. 3D printed nerve guidance channels: computer-aided control of geometry, physical cues, biological supplements and gradients. Neural Regen Res. 2016;11:1568–9. doi: 10.4103/1673-5374.193230. [DOI] [PMC free article] [PubMed] [Google Scholar]
- Johnson BN, Lancaster KZ, Zhen G, He J, Gupta MK, Kong YL, Engel EA, Krick KD, Ju A, Meng F, Enquist LW, Jia X, McAlpine MC. 3D Printed Anatomical Nerve Regeneration Pathways. Adv Funct Mater. 2015;25:6205–17. doi: 10.1002/adfm.201501760. [DOI] [PMC free article] [PubMed] [Google Scholar]
- Jones S, Eisenberg HM, Jia X. Advances and Future Applications of Augmented Peripheral Nerve Regeneration. Int J Mol Sci. 2016;17:1494. doi: 10.3390/ijms17091494. [DOI] [PMC free article] [PubMed] [Google Scholar]
- Kabiri M, Oraee-Yazdani S, Shafiee A, Hanaee-Ahvaz H, Dodel M, Vaseei M, Soleimani M. Neuroregenerative effects of olfactory ensheathing cells transplanted in a multi-layered conductive nanofibrous conduit in peripheral nerve repair in rats. Journal of biomedical science. 2015;22:35. doi: 10.1186/s12929-015-0144-0. [DOI] [PMC free article] [PubMed] [Google Scholar]
- Kizilay Z, Erken HA, Cetin NK, Aktas S, Abas BI, Yilmaz A. Boric acid reduces axonal and myelin damage in experimental sciatic nerve injury. Neural regeneration research. 2016;11:1660–5. doi: 10.4103/1673-5374.193247. [DOI] [PMC free article] [PubMed] [Google Scholar]
- Kjell J, Finn A, Hao J, Wellfelt K, Josephson A, Svensson CI, Wiesenfeld-Hallin Z, Eriksson U, Abrams M, Olson L. Delayed Imatinib Treatment for Acute Spinal Cord Injury: Functional Recovery and Serum Biomarkers. Journal of neurotrauma. 2015;32:1645–57. doi: 10.1089/neu.2014.3863. [DOI] [PMC free article] [PubMed] [Google Scholar]
- Lewitus D, Vogelstein RJ, Zhen G, Choi YS, Kohn J, Harshbarger S, Jia X. Designing tyrosine-derived polycarbonate polymers for biodegradable regenerative type neural interface capable of neural recording. IEEE Trans Neural Syst Rehabil Eng. 2011;19:204–12. doi: 10.1109/TNSRE.2010.2098047. [DOI] [PubMed] [Google Scholar]
- Lin YC, Oh SJ, Marra KG. Synergistic lithium chloride and glial cell line-derived neurotrophic factor delivery for peripheral nerve repair in a rodent sciatic nerve injury model. Plastic and reconstructive surgery. 2013;132:251e–62e. doi: 10.1097/PRS.0b013e31829588cf. [DOI] [PubMed] [Google Scholar]
- Neckel ND. Methods to quantify the velocity dependence of common gait measurements from automated rodent gait analysis devices. Journal of neuroscience methods. 2015;253:244–53. doi: 10.1016/j.jneumeth.2015.06.017. [DOI] [PMC free article] [PubMed] [Google Scholar]
- Ni HC, Tseng TC, Chen JR, Hsu SH, Chiu IM. Fabrication of bioactive conduits containing the fibroblast growth factor 1 and neural stem cells for peripheral nerve regeneration across a 15 mm critical gap. Biofabrication. 2013;5:035010. doi: 10.1088/1758-5082/5/3/035010. [DOI] [PubMed] [Google Scholar]
- Salewski RP, Mitchell RA, Li L, Shen C, Milekovskaia M, Nagy A, Fehlings MG. Transplantation of Induced Pluripotent Stem Cell-Derived Neural Stem Cells Mediate Functional Recovery Following Thoracic Spinal Cord Injury Through Remyelination of Axons. Stem cells translational medicine. 2015;4:743–54. doi: 10.5966/sctm.2014-0236. [DOI] [PMC free article] [PubMed] [Google Scholar]
- Taylor CA, Braza D, Rice JB, Dillingham T. The incidence of peripheral nerve injury in extremity trauma. American journal of physical medicine & rehabilitation. 2008;87:381–5. doi: 10.1097/PHM.0b013e31815e6370. [DOI] [PubMed] [Google Scholar]
- Varejao AS, Melo-Pinto P, Meek MF, Filipe VM, Bulas-Cruz J. Methods for the experimental functional assessment of rat sciatic nerve regeneration. Neurological research. 2004;26:186–94. doi: 10.1179/016164104225013833. [DOI] [PubMed] [Google Scholar]
- Vrinten DH, Hamers FF. ‘CatWalk’ automated quantitative gait analysis as a novel method to assess mechanical allodynia in the rat; a comparison with von Frey testing. Pain. 2003;102:203–9. doi: 10.1016/s0304-3959(02)00382-2. [DOI] [PubMed] [Google Scholar]
- Wang XP, Wu M, Guan JZ, Wang ZD, Gao XB, Liu YY. Pre-degenerated peripheral nerves co-cultured with bone marrow-derived cells: a new technique for harvesting high-purity Schwann cells. Neural regeneration research. 2016;11:1653–9. doi: 10.4103/1673-5374.193246. [DOI] [PMC free article] [PubMed] [Google Scholar]
- Wang Y, Li ZW, Luo M, Li YJ, Zhang KQ. Biological conduits combining bone marrow mesenchymal stem cells and extracellular matrix to treat long-segment sciatic nerve defects. Neural regeneration research. 2015;10:965–71. doi: 10.4103/1673-5374.158362. [DOI] [PMC free article] [PubMed] [Google Scholar]
- Zhen G, Wen C, Jia X, Li Y, Crane JL, Mears SC, Askin FB, Frassica FJ, Chang W, Yao J, Carrino JA, Cosgarea A, Artemov D, Chen Q, Zhao Z, Zhou X, Riley L, Sponseller P, Wan M, Lu WW, Cao X. Inhibition of TGF-beta signaling in mesenchymal stem cells of subchondral bone attenuates osteoarthritis. Nature medicine. 2013;19:704–12. doi: 10.1038/nm.3143. [DOI] [PMC free article] [PubMed] [Google Scholar]