

Abstract
Background
An association has been suggested between gout and erectile dysfunction (ED), however studies quantifying the risk of ED amongst gout patients are lacking. We aimed to precisely determine the population-level absolute and relative rate of ED reporting among men with gout over a decade in England.
Methods
We utilised the UK-based Clinical Practice Research Datalink to identify 9653 men with incident gout age- and practice-matched to 38,218 controls. Absolute and relative rates of incident ED were calculated using Cox regression models. Absolute rates within specific time periods before and after gout diagnosis were compared to control using a Poisson regression model.
Results
Overall, the absolute rate of ED post-gout diagnosis was 193 (95% confidence interval (CI): 184–202) per 10,000 person-years. This corresponded to a 31% (hazard ratio (HR): 1.31 95%CI: 1.24–1.40) increased relative risk and 0.6% excess absolute risk compared to those without gout. We did not observe statistically significant differences in the risk of ED among those prescribed ULT within 1 and 3 years after gout diagnosis. Compared to those unexposed, the risk of ED was also high in the year before gout diagnosis (relative rate = 1.63 95%CI 1.27–2.08). Similar findings were also observed for severe ED warranting pharmacological intervention.
Conclusions
We have shown a statistically significant increased risk of ED among men with gout. Our findings will have important implications in planning a multidisciplinary approach to managing patients with gout.
Keywords: Gout, Erectile dysfunction, Incidence rate, Epidemiology
Background
Gout is the most prevalent type of inflammatory arthritis, affecting 2.4% of adults in the UK. It is largely managed in primary care [1] and is associated with a number of comorbidities [2, 3]. Erectile dysfunction (ED) is also a common problem in the general population affecting 2% of men aged under 40 years rising to 86% of those aged over 80 years [4]. Recently, an association between gout and ED had been suggested based on one small hospital-based cross-sectional study [5] and two cohort studies from Southeast Asia [6, 7]. Whilst the latter studies were based on large administrative data, their findings can only be generalised to western countries with caution, given the large variation in the reporting of ED by region [4]. Furthermore, the causal relationship between gout and ED demonstrated in one previous study failed to account for important factors including body mass index (BMI), smoking status and alcohol consumption, which may have confounded the association [6]. Finally, to our knowledge no previous study has quantified the incidence of ED warranting pharmacological intervention or assessed ED reporting both before and after gout diagnosis, which may be important in understanding disease mechanisms. Knowledge about gout-associated comorbidities is crucial for planning multidisciplinary approaches to disease management. Therefore, the aim of this study was to precisely determine the population level absolute and relative rates of ED reporting among men with gout over a decade in the UK.
Methods
The Clinical Practice Research Datalink (CPRD) [8] is a large longitudinal UK database that contains computerised primary care (i.e. general practice) records of anonymised patients. Approximately 98% of the England and Wales population are registered with general practitioners (GPs), who are responsible for almost the entirety of a patient’s medical care, including coordination of their health care from a hospital or other secondary care facilities. The CPRD includes practices that have received training to record information using Vision software and that have consented to be included in the database. All patients within a consented practice are automatically included. CPRD is subjected to various quality checks and a practice’s data is only used when it is of the highest quality to be used for research. This is denoted by defining an up-to-standard (UTS) time period for each practice. For the purpose of this study, we utilised a subset of CPRD linked to Hospital Episode Statistics, which records England’s secondary care data. The HES-linked CPRD have been compared to the Office of National Statistics (ONS) data showing similar age and sex distribution [9].
We identified men aged 18–64 years with a first-ever recorded diagnosis of gout from general practice between 1998 and 2004 who were then followed up until 2015. The study start date was defined as the latest of study start date (1 January 1998), date of patient registration with the practice and UTS date. The study end date was defined as the earliest of the date of last data collection from the practice, date patient transferred out from practice or died, and the study end date (31 August 2015). Gout diagnosis was based on a medical code assigned by the physician which has been previously validated in CPRD with a positive predictive value of 90% [10]. Each patient was assigned an index date corresponding to the date of their gout diagnosis and randomly matched to four controls on age (±3 years) without gout or a prescription for urate-lowing therapy (ULT) who were registered at the same practice, and were alive and contributing data at the index date. Controls were assigned the same index date as their matched gout case. Those with less than a year of follow-up, history of prior ED diagnosis, or prescribed ED-specific medication in the absence of a diagnostic code during the study period were excluded. For our primary analysis, we looked at the rate of ED reporting after the index date (for cases and controls). In order to assess how ED reporting rates varied in relation to the time of gout diagnosis, we also analysed all available person-time before the index date. Thus we were able to look at patients who developed ED before their gout diagnosis and subsequently excluded from our primary analysis.
Incident ED reporting was based on medical codes assigned by the physician during the study period. In order to ensure incident reporting, those assigned an ED code in the first 6 months of their registration with the practice were classified as prevalent cases and were excluded from our post-gout analysis. We only assessed the incidence of the first ED and therefore any subsequent ED events (along with the follow-up time) were excluded from the study. We defined pharmacologically treated ED based on those who were prescribed pharmacological treatment for ED any time after their initial diagnosis.
We extracted information on lifestyle-related characteristics (BMI, smoking status and alcohol consumption) and specific comorbidities (ischemic heart disease, hypertension, diabetes mellitus, depression and chronic renal disease) for both cases and controls. BMI was categorised as normal weight (18.5–25 kg/m2), underweight (≤18.5 kg/m2), overweight (>25– 29.9 kg/m2) and obese (≥30 kg/m2). Covariate information was ascertained using the most recent measure before the outcome or study end date.
Patient characteristics were compared between cases and controls using frequencies and percentages. Chi-squared tests were conducted to quantify statistically significant differences between cases and controls. We calculated the incidence of ED as the number of first-recorded ED diagnoses per 10,000 person-years. Adjusted hazard ratio (HR) and 95% confidence interval (CI) was calculated using a Cox regression model to compare the hazard rate between cases and controls. Robust standard errors were used to account for matching. To explore potential interaction by lifestyle-related characteristics and comorbidities, we stratified our analyses by those covariates. Those with missing information on BMI were categorised as a separate category and were included in the analysis. We assessed the timing of ED reporting in relation to gout diagnosis by comparing the absolute rate of ED before and after gout diagnosis among cases and controls in terms of incidence rate ratios using a Poisson regression model. We utilised landmark analysis to examine the effect of ULT on the risk of ED [11]. This method deals with immortal time bias which biases the results in favour of the treatment under study by granting a spurious survival advantage to the treated group. In landmark analysis [12], a fixed time after the initiation of therapy is selected a priori for conducting survival analysis. Only patients alive and contributing data at landmark time were included in the analysis. The exposure was evaluated between the index date and the landmark time whereas the incidence of ED was only considered after the landmark time point. Two landmark points were considered in the analysis (1 and 3 years after diagnosis) based on a previously published study [13]. Only patients prescribed more than 6 months of ULT were considered to be exposed. Finally, we repeated our analyses for pharmacologically treated ED. All statistical analyses were carried out using STATA MP 14 (StataCorp LP, College Station, TX, USA).
Results
Our gout cohort consisted of 9653 patients matched to 38,218 controls representing 90,036 and 302,814 person-years of follow-up, respectively. The median follow-up from index to study end date was calculated to be 10 years (IQR = 5–13 years). Compared to controls, men with gout were less likely to smoke (15% versus 22%; p < 0.001), more likely to drink ≥ 10 alcohol units/week (49% versus 32%, p value < 0.001), and more likely to be overweight or obese (Table 1). Gout cases also had a higher prevalence of diabetes mellitus, hypertension, ischemic heart disease, chronic renal disease and depression compared to their matched controls.
Table 1.
Basic characteristics of the study population
| Variable | Controls N = 38,218 |
Gout cases N = 9653 |
p value* | ||
|---|---|---|---|---|---|
| N | % | N | % | ||
| Age in years | |||||
| ≤ 34 | 2774 | 7.3 | 712 | 7.4 | 0.800 |
| 35–44 | 8900 | 23.3 | 2206 | 22.9 | |
| 45–54 | 12,887 | 33.7 | 3256 | 33.7 | |
| 55–64 | 13,649 | 35.7 | 3479 | 36.0 | |
| Never/ex-smokers | 30,010 | 78.5 | 8210 | 85.1 | <0.001 |
| Current smoker | 8200 | 21.5 | 1443 | 14.9 | |
| Never/ex-drinkers | 10,703 | 28.0 | 1578 | 16.3 | <0.001 |
| Current drinkers (1–9 units/week) | 15,420 | 40.4 | 3381 | 35.0 | |
| Current drinkers (≥10 units/week) | 12,087 | 31.6 | 4694 | 48.6 | |
| Body mass index | |||||
| Normal | 10203 | 26.7 | 1376 | 14.3 | <0.001 |
| Underweight | 332 | 0.9 | 42 | 0.4 | |
| Overweight | 13,224 | 34.6 | 3753 | 38.9 | |
| Obese | 6952 | 18.2 | 3598 | 37.3 | |
| Missing | 7499 | 19.6 | 884 | 9.2 | |
| Comorbidities | |||||
| Ischemic heart disease | 2893 | 7.6 | 1180 | 12.2 | <0.001 |
| Diabetes | 3084 | 8.1 | 1470 | 15.2 | <0.001 |
| Hypertension | 8210 | 21.5 | 4191 | 43.4 | <0.001 |
| Chronic renal disease | 1026 | 2.7 | 802 | 8.3 | <0.001 |
| Depression | 6242 | 16.3 | 1894 | 19.6 | <0.001 |
*Chi-squared test
A total of 5860 incident ED events were recorded during the study period after the index date (Table 2). The absolute rate (AR) of ED reporting among men with gout was calculated to be 193 (95%CI; 184–202) per 10,000 person-years. This corresponded to a 0.6% excess absolute risk and a 31% increased adjusted relative risk (HR = 1.31; 95%CI 1.24–1.40) compared to those without gout. Our results remained consistent when we stratified our analyses by patient characteristics. The absolute rate of pharmacologically treated ED among men with gout was 107 per 10,000 person years (95%CI 107–121) with the excess absolute risk of 0.3% compared with controls (Table 3). However, the risk of pharmacologically treated ED was not statistically different between cases and controls among younger population (<45 years) or those with a recorded diagnosis of diabetes mellitus or chronic renal failure.
Table 2.
Absolute and relative rate of ED reporting by patient characteristics and comorbidities
| Variable | Controls | Gout cases | Adjusteda HR | 95% CI | Absolute risk differenceb | |||||||
|---|---|---|---|---|---|---|---|---|---|---|---|---|
| N | Rateb | 95% CI | N | Rateb | 95% CI | |||||||
| Overall | 4124 | 136.2 | 132.1 | 140.4 | 1736 | 192.8 | 184.0 | 202.1 | 1.31 | 1.24 | 1.40 | 56.6 |
| Age | ||||||||||||
| ≤ 34 | 68 | 34.6 | 27.3 | 43.9 | 42 | 61.4 | 45.4 | 83.1 | 1.20 | 0.79 | 1.83 | 26.8 |
| 35–44 | 548 | 76.2 | 70.1 | 82.8 | 251 | 112.6 | 99.5 | 127.4 | 1.18 | 1.01 | 1.39 | 36.4 |
| 45–54 | 1551 | 146.0 | 138.9 | 153.5 | 653 | 211.7 | 196.1 | 228.6 | 1.28 | 1.16 | 1.41 | 65.7 |
| 55–64 | 1957 | 186.3 | 178.3 | 194.8 | 790 | 262.8 | 245.1 | 281.8 | 1.37 | 1.25 | 1.49 | 76.5 |
| Smoking status | ||||||||||||
| Never/ex-smokers | 3281 | 132.8 | 128.4 | 137.5 | 1487 | 191.2 | 181.7 | 201.1 | 1.32 | 1.24 | 1.41 | 58.3 |
| Current smoker | 843 | 151.1 | 141.2 | 161.6 | 249 | 203.2 | 179.5 | 230.1 | 1.29 | 1.11 | 1.50 | 52.2 |
| Alcohol consumption | ||||||||||||
| Never/ex-drinkers | 834 | 112.3 | 104.9 | 120.2 | 283 | 206.7 | 183.9 | 232.2 | 1.77 | 1.53 | 2.05 | 94.4 |
| Current drinkers (1–9 units/week) | 1716 | 132.6 | 126.5 | 139.1 | 601 | 184.2 | 170.1 | 199.5 | 1.29 | 1.17 | 1.42 | 51.6 |
| Current drinkers (≥10 units/week) | 1574 | 158.7 | 151.1 | 166.8 | 852 | 194.9 | 182.2 | 208.4 | 1.21 | 1.11 | 1.32 | 36.2 |
| Body mass index | ||||||||||||
| Normal | 943 | 117.4 | 110.1 | 125.1 | 201 | 157.8 | 137.4 | 181.1 | 1.34 | 1.14 | 1.57 | 40.4 |
| Underweight | 18 | 67.5 | 42.5 | 107.2 | - | - | - | - | - | - | - | - |
| Overweight | 1659 | 146.5 | 139.6 | 153.7 | 696 | 196.5 | 182.4 | 211.6 | 1.33 | 1.21 | 1.45 | 50.0 |
| Obese | 1068 | 170.0 | 160.1 | 180.5 | 712 | 204.2 | 189.7 | 219.7 | 1.23 | 1.11 | 1.35 | 34.1 |
| Missing | 436 | 99.6 | 90.7 | 109.4 | 126 | 189.5 | 159.1 | 225.6 | 1.71 | 1.37 | 2.14 | 89.8 |
| Comorbidities | ||||||||||||
| Congestive heart disease | 443 | 174.2 | 158.7 | 191.2 | 253 | 227.6 | 201.2 | 257.5 | 1.26 | 1.07 | 1.47 | 53.4 |
| Diabetes | 946 | 343.6 | 322.4 | 366.2 | 514 | 349.4 | 320.4 | 380.9 | 1.05 | 0.94 | 1.74 | 5.8 |
| Hypertension | 1347 | 173.4 | 164.4 | 183.0 | 852 | 206.8 | 193.4 | 221.2 | 1.18 | 1.09 | 1.29 | 33.4 |
| Chronic renal disease | 122 | 106.3 | 89.0 | 127.0 | 129 | 149.5 | 125.8 | 177.7 | 1.41 | 1.10 | 1.81 | 43.2 |
| Depression | 872 | 168.5 | 157.7 | 180.0 | 381 | 216.1 | 195.4 | 238.9 | 1.26 | 1.11 | 1.43 | 47.6 |
ED erectile dysfunction, CI confidence interval
aMutually adjusted unless stratified
bPer 10,000 person-years
Table 3.
Absolute and relative rate of pharmacologically treated ED by patient characteristics and comorbidities
| Variable | Controls | Gout cases | Adjusteda HR | 95% CI | Absolute risk differenceb | |||||||
|---|---|---|---|---|---|---|---|---|---|---|---|---|
| N | Rateb | 95% CI | N | Rateb | 95% CI | |||||||
| Overall | 2429 | 80.2 | 77.1 | 83.5 | 1024 | 113.7 | 107.0 | 120.9 | 1.36 | 1.26 | 1.47 | 33.5 |
| Age | ||||||||||||
| ≤ 34 | 32 | 16.3 | 11.5 | 23.0 | 23 | 33.6 | 22.4 | 50.6 | 1.24 | 0.67 | 2.29 | 17.3 |
| 35–44 | 329 | 45.7 | 41.1 | 51.0 | 139 | 62.4 | 52.8 | 73.6 | 1.11 | 0.89 | 1.37 | 16.6 |
| 45–54 | 925 | 87.1 | 81.6 | 92.9 | 391 | 126.8 | 114.8 | 140.0 | 1.30 | 1.15 | 1.47 | 39.7 |
| 55–64 | 1143 | 108.8 | 102.7 | 115.3 | 471 | 156.7 | 143.2 | 171.5 | 1.46 | 1.30 | 1.64 | 47.9 |
| Smoking status | ||||||||||||
| Never/ex-smokers | 1955 | 79.1 | 75.7 | 82.7 | 891 | 114.5 | 107.3 | 122.3 | 1.39 | 1.27 | 1.51 | 35.4 |
| Current smoker | 474 | 84.9 | 77.6 | 92.9 | 133 | 108.5 | 91.6 | 128.7 | 1.23 | 1.01 | 1.51 | 23.6 |
| Alcohol consumption | ||||||||||||
| Never/ex-drinkers | 484 | 65.2 | 59.6 | 71.2 | 154 | 112.5 | 96.0 | 131.7 | 1.82 | 1.49 | 2.21 | 47.3 |
| Current drinkers (1–9 units/week) | 992 | 76.7 | 72.0 | 81.6 | 321 | 98.4 | 88.2 | 109.8 | 1.27 | 1.11 | 1.44 | 21.7 |
| Current drinkers (≥10 units/week) | 953 | 96.1 | 90.2 | 102.4 | 549 | 125.6 | 115.5 | 136.5 | 1.31 | 1.17 | 1.46 | 29.5 |
| Body mass index | ||||||||||||
| Normal | 589 | 73.3 | 67.6 | 79.5 | 116 | 91.0 | 75.9 | 109.2 | 1.27 | 1.03 | 1.56 | 17.7 |
| Underweight | 10 | 37.5 | 20.2 | 69.7 | - | - | - | - | - | - | - | |
| Overweight | 971 | 85.8 | 80.5 | 91.3 | 419 | 118.3 | 107.5 | 130.2 | 1.36 | 1.21 | 1.53 | 32.5 |
| Obese | 581 | 92.5 | 85.3 | 100.3 | 399 | 114.4 | 103.7 | 126.2 | 1.28 | 1.12 | 1.46 | 21.9 |
| Missing | 278 | 63.5 | 56.5 | 71.4 | 89 | 133.8 | 108.7 | 164.7 | 1.88 | 1.43 | 2.48 | 70.3 |
| Comorbidities | ||||||||||||
| Congestive heart disease | 199 | 78.2 | 68.1 | 89.9 | 123 | 110.7 | 92.7 | 132.1 | 1.34 | 1.06 | 1.70 | 32.4 |
| Diabetes | 488 | 177.3 | 162.2 | 193.7 | 264 | 179.4 | 159.1 | 202.4 | 1.04 | 0.89 | 1.21 | 2.2 |
| Hypertension | 737 | 94.9 | 88.3 | 102.0 | 486 | 118.0 | 107.9 | 128.9 | 1.24 | 1.10 | 1.39 | 23.1 |
| Chronic renal disease | 51 | 44.4 | 33.8 | 58.5 | 52 | 60.3 | 45.9 | 79.1 | 1.34 | 0.90 | 1.99 | 15.8 |
| Depression | 479 | 92.6 | 84.6 | 101.2 | 219 | 124.2 | 108.8 | 141.8 | 1.37 | 1.16 | 1.62 | 31.6 |
ED erectile dysfunction, HR hazard ratio, CI confidence interval
aMutually adjusted unless stratified
bPer 10,000 person-years
As shown in Table 4, 1616 patients in the 1-year landmark analysis and 1091 patients in the 3-year landmark analysis reported ED during the follow-up period. We did not find statistically significant differences in the risk of ED by ULT. Similar findings were also reported for pharmacologically treated ED. Those with gout had 1.77 times (95%CI 1.38–2.26) higher relative risk of reporting ED compared to controls within the second year of gout diagnosis. The adjusted relative risk decreased in the years following diagnosis to 1.16 after 5 years of diagnosis but was also 1.63 times higher (95%CI 1.24-2.08) within the year preceding diagnosis (Fig. 1). These estimates remained broadly similar for pharmacologically treated ED (Fig. 2).
Table 4.
Absolute and relative rate of ED among those ever prescribed urate-lowering therapy (ULT)
| 1-year landmark analysis Total patients = 9322 ULT exposed = 1249 |
3-year landmark analysis Total patients = 8650 ULT exposed = 1787 |
|||||
|---|---|---|---|---|---|---|
| Gout cases | ED events | Absolute rateb (95% CI) | Adjusted HR (95% CI)a | ED events | Absolute rateb (95% CI) | Adjusted HR (95% CI)a |
| For overall ED reporting | ||||||
| Not treated | 1364 | 194.8 (184.7–205.4) | 1.00 | 797 | 196.9 (184.9–209.6) | 1.00 |
| Treated with ULT | 252 | 237.1 (209.6–268.3) | 1.14 (0.99–1.30) | 294 | 229.1 (204.4–256.9) | 1.07 (0.94–1.22) |
| Pharmacologically treated ED | ||||||
| Not treated | 797 | 113.8 (106.2–122.0) | 1.00 | 548 | 110.3 (101.5–120) | 1.00 |
| Treated with ULT | 141 | 132.8 (112.5–156.5) | 1.12 (0.93–1.34) | 161 | 125.5 (107.5–146.4) | 1.08 (0.90–1.29) |
ED erectile dysfunction, CI confidence interval, HR hazard ratio
aAdjusted for age, BMI, smoking status, alcohol consumption, ischemic heart disease, chronic renal disease, depression, hypertension and diabetes
bPer 10,000 person-years
Fig. 1.
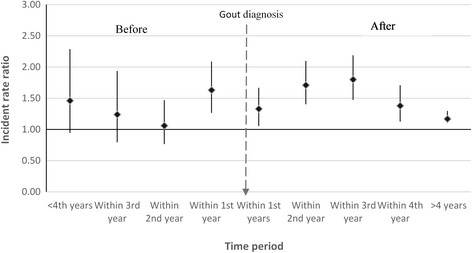
Timing of ED reporting in relation to gout diagnosis compared to controls
Fig. 2.
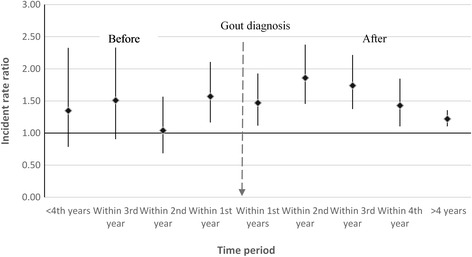
Timing of pharmacologically treated ED reporting in relation to gout diagnosis compared to controls
Discussion
In this large nationally representative cohort of men with gout with more than 10 years of follow-up, we have provided contemporary, generalisable and population-based estimates of the absolute risk of ED reporting in England. Overall we found the risk of ED post-diagnosis to be 2% per year. Whilst those with gout were 31% more likely to consult their general practitioner for ED compared to those without gout, the excess absolute risk was 0.6% per year. The risk of pharmacologically treated ED was not statistically different between cases and controls among the younger population (<45 years) or those with a recorded diagnosis of diabetes or chronic renal failure. Having more than 6 months of ULT within 1 and 3 years from initial gout diagnosis had no impact ED reporting. The risk of consulting a GP for ED was also higher within the year preceding the initial gout diagnosis.
We have conducted one of the largest studies to precisely determine the risk of ED among men with gout. Our study used an open cohort approach, with prospectively recorded data utilising information from primary care from across England, covering 3% of the total UK population with similar age and sex distribution to the population as a whole. Thus these findings are not only generalisable to England but also to other developed nations with comparable health care systems. Our use of primary care data allowed us to adjust our estimates for important confounding factors such as smoking status, alcohol consumption and BMI, which had not been done in previous studies on the subject. Furthermore, prospective data allowed us to look at the timing of ED in relation to gout diagnosis, which also has not been previously demonstrated.
A potential limitation is the use of anonymised data with no direct link to the patient record and our reliance on general practitioners entering data accurately. However, gout diagnosis has been externally validated in CPRD with a high degree of accuracy [10] so it is unlikely that there is any major error in our study due to the misclassification of gout diagnosis. Similarly, validity and under-reporting of ED due to the reluctance of patients to seek medical advice may be a concern, however, our study provides estimates which reflect contemporary ED reporting and screening practices in primary care, which form the basis of management. Nonetheless, our absolute rates of ED are much higher compared to most studies on the subject [6, 7].
There may be potential ascertainment bias as gout patients may be more aware of associated comorbidities and consequently, report more ED compared to those without gout. However, we believe the impact of this may be minimal as higher relative risk of ED was also observed among those with pharmacologically treated ED and also within the year preceding gout diagnosis. We also acknowledge the lack of complete data on BMI which could bias our estimates. Nonetheless, we treated patients with missing data as a separate category and included them in our analysis. The fact that we were able to adjust for BMI and other lifestyle-related characteristics is an advantage over other large studies on the topic. Finally, the use of 1- and 3-year landmarks for our ULT analysis means that our findings are only generalisable to those alive and contributing data at those landmark points and prescribed at least 6 months of ULT after their initial gout diagnosis.
The absolute rate of ED reporting among gout patients in our cohort was calculated to be 2% per year. This is much higher than the rate previously reported by two large registry-based studies from Taiwan (0.1–0.2% per year) utilising Health Insurance Research Database [6, 7]. This may be because treatment for ED in Taiwan is not covered by their National Health Insurance program leading to under-ascertainment of ED. Furthermore, differences in study population and cultural norms may also have contributed to ED under-reporting. Overall we observed a 31% increased relative risk of ED among gout patients compared to controls. Whilst these estimates are in line with those reported in Southeast Asian studies [6, 7], a US-based study reported around threefold higher risk of ED among gout cases [5]. The latter study was based on a cross-sectional survey of men aged 18–89 years attending a rheumatology clinic with any form of arthritis, which may be prone to selection and recall bias. Furthermore, the finding of this previous study may not be generalisable to the majority of patients with gout who are managed exclusively in primary care.
Whilst our study supports most of the findings from the Taiwanese studies, it is important to note that the excess absolute risk of ED among gout patients compared to controls is less than 0.6%. Furthermore, we reported no increased risk of ED reporting among those with diabetes and chronic renal disease, which suggests stronger influence of those conditions on ED than gout. Our findings support the likely physiological influence of hyperuricaemia on vasculature including induction of vascular smooth muscle proliferation, oxidative stress, and activation of the renin-angiotensin axis in vascular beds [14] which begins in asymptomatic hyperuricaemia before the clinical diagnosis of gout.
Conclusions
Our study has important clinical implications. First, we have found that men with gout are at a higher risk of ED compared to the general population. The increased relative risk is broadly similar when stratified by comorbidities suggesting limited interaction with those factors. These findings may have important implications in planning a multidisciplinary approach to managing patients with gout. Second, we observed increased relative risk of ED within the year before gout diagnosis. Therefore it may be more reasonable to suspect hyperuricaemia as one of the underlying cause of ED among men with asymptomatic hyperuricaemia but are yet to develop clinically apparent gout.
Acknowledgements
Not applicable.
Funding
This project was funded by Christian Mallen’s NIHR Research Professorship in General Practice. The sponsor had no role in study design and analysis.
Availability of data and materials
The data that support the findings of this study are available from CPRD but restrictions apply to the availability of these data, which were used under license for the current study, and so are not publicly available. Data are however available from the authors upon reasonable request and with permission of CPRD.
Authors’ contributions
CM contributed to study concept and design, analysis and interpretation of data, drafting of the manuscript, critical revision of the manuscript for important intellectual content, obtaining funding and study supervision, ER contributed to study concept and design, analysis and interpretation of data, drafting of the manuscript, critical revision of the manuscript for important intellectual content and study supervision. SM contributed to study concept and design, acquisition of data and critical revision of the manuscript for important intellectual content. RW contributed to study concept and design, acquisition of data and critical revision of the manuscript for important intellectual content. RH contributed to study concept and design and critical revision of the manuscript for important intellectual content. AAS contributed to analysis and interpretation of data, drafting of the manuscript and statistical analysis. MH contributed to critical revision of the manuscript for important intellectual content. All authors read and approved the final manuscript.
Competing interests
The authors declare that they have no competing interests.
Consent for publication
Not applicable.
Ethics approval and consent to participate
No consent was needed.
This study was approved by CPRD’s Independent Scientific Advisory Committee (ISAC) reference number 15_225.
Publisher’s Note
Springer Nature remains neutral with regard to jurisdictional claims in published maps and institutional affiliations.
Abbreviations
- AR
Absolute rate
- CI
Confidence interval
- CPRD
Clinical Practice Research Datalink
- ED
Erectile dysfunction
- GP
General practitioner
- HR
Hazard ratio
- ULT
Urate-lowering therapy
Contributor Information
Alyshah Abdul Sultan, Email: a.abdul.sultan@keele.ac.uk.
Christian Mallen, Email: c.d.mallen@keele.ac.uk.
Richard Hayward, Email: r.hayward@keele.ac.uk.
Sara Muller, Email: s.muller@keele.ac.uk.
Rebecca Whittle, Email: r.l.whittle@keele.ac.uk.
Matthew Hotston, Email: matthotston@gmail.com.
Edward Roddy, Email: e.roddy@keele.ac.uk.
References
- 1.Kuo CF, Grainge MJ, Mallen C, Zhang W, Doherty M. Rising burden of gout in the UK but continuing suboptimal management: a nationwide population study. Ann Rheum Dis. 2015;74(4):661–7. doi: 10.1136/annrheumdis-2013-204463. [DOI] [PMC free article] [PubMed] [Google Scholar]
- 2.Choi HK, Ford ES, Li C, Curhan G. Prevalence of the metabolic syndrome in patients with gout: the Third National Health and Nutrition Examination Survey. Arthritis Rheum. 2007;57(1):109–15. doi: 10.1002/art.22466. [DOI] [PubMed] [Google Scholar]
- 3.Clarson LE, Chandratre P, Hider SL, Belcher J, Heneghan C, Roddy E, Mallen CD. Increased cardiovascular mortality associated with gout: a systematic review and meta-analysis. Eur J Prev Cardiol. 2015;22(3):335–43. doi: 10.1177/2047487313514895. [DOI] [PMC free article] [PubMed] [Google Scholar]
- 4.Prins J, Blanker MH, Bohnen AM, Thomas S, Bosch JL. Prevalence of erectile dysfunction: a systematic review of population-based studies. Int J Impot Res. 2002;14(6):422–32. doi: 10.1038/sj.ijir.3900905. [DOI] [PubMed] [Google Scholar]
- 5.Schlesinger N, Radvanski DC, Cheng JQ, Kostis JB. Erectile dysfunction is common among patients with gout. J Rheumatol. 2015;42(10):1893–7. doi: 10.3899/jrheum.141031. [DOI] [PubMed] [Google Scholar]
- 6.Chen YF, Lin HH, Lu CC, Hung CT, Lee MH, Hsu CY, Chung WS. Gout and a subsequent increased risk of erectile dysfunction in men aged 64 and under: a nationwide cohort study in Taiwan. J Rheumatol. 2015;42(10):1898–905. doi: 10.3899/jrheum.141105. [DOI] [PubMed] [Google Scholar]
- 7.Hsu CY, Lin CL, Kao CH. Gout is associated with organic and psychogenic erectile dysfunction. Eur J Intern Med. 2015;26(9):691–5. doi: 10.1016/j.ejim.2015.06.001. [DOI] [PubMed] [Google Scholar]
- 8.Clinical Practice Research Database. http://www.cprd.com/intro.asp. Accessed 2 Jan 2017.
- 9.Crooks C. Epidemiology of upper gastrointestinal bleeding studying its causes and outcomes using case control studies and surivival analyses. Ph.D. Thesis. University of Nottingham; 2013.
- 10.Meier CR, Jick H. Omeprazole, other antiulcer drugs and newly diagnosed gout. Br J Clin Pharmacol. 1997;44(2):175–8. doi: 10.1046/j.1365-2125.1997.00647.x. [DOI] [PMC free article] [PubMed] [Google Scholar]
- 11.Dafni U. Landmark analysis at the 25-year landmark point. Circ Cardiovasc Qual Outcome. 2011;4(3):363–71. doi: 10.1161/CIRCOUTCOMES.110.957951. [DOI] [PubMed] [Google Scholar]
- 12.Giobbie-Hurder A, Gelber RD, Regan MM. Challenges of guarantee-time bias. J Clin Oncol. 2013;31(23):2963–9. doi: 10.1200/JCO.2013.49.5283. [DOI] [PMC free article] [PubMed] [Google Scholar]
- 13.Kuo CF, Grainge MJ, Mallen C, Zhang W, Doherty M. Effect of allopurinol on all-cause mortality in adults with incident gout: propensity score-matched landmark analysis. Rheumatology (Oxford) 2015;54(12):2145–50. doi: 10.1093/rheumatology/kev246. [DOI] [PubMed] [Google Scholar]
- 14.Gelber AC. Gout and association with erectile dysfunction. J Rheumatol. 2015;42(10):1731–3. doi: 10.3899/jrheum.150814. [DOI] [PubMed] [Google Scholar]
Associated Data
This section collects any data citations, data availability statements, or supplementary materials included in this article.
Data Availability Statement
The data that support the findings of this study are available from CPRD but restrictions apply to the availability of these data, which were used under license for the current study, and so are not publicly available. Data are however available from the authors upon reasonable request and with permission of CPRD.