Abstract
Adequate protein folding is necessary for normal cell function and a tightly regulated process that requires proper intracellular ionic strength. In many cell types, imbalance between protein synthesis and degradation can induce endoplasmic reticulum (ER) stress, which if sustained, can in turn lead to cell death. In nematodes, osmotic stress induces massive protein aggregation coupled with unfolded protein response and ER stress. In clinical practice, patients sustaining rapid correction of chronic hyponatremia are at risk of osmotic demyelination syndrome. The intense osmotic stress sustained by brain cells is believed to be the major risk factor for demyelination resulting from astrocyte death, which leads to microglial activation, blood-brain barrier opening, and later, myelin damage. Here, using a rat model of osmotic demyelination, we showed that rapid correction of chronic hyponatremia induces severe alterations in proteostasis characterized by diffuse protein aggregation and ubiquitination. Abrupt correction of hyponatremia resulted in vigorous activation of both the unfolded protein response and ER stress accompanied by increased autophagic activity and apoptosis. Immunofluorescence revealed that most of these processes occurred in astrocytes within regions previously shown to be demyelinated in later stages of this syndrome. These results identify osmotic stress as a potent protein aggregation stimuli in mammalian brain and further suggest that osmotic demyelination might be a consequence of proteostasis failure on severe osmotic stress.
Keywords: hyponatremia, osmolality, malfolding proteins
Proper cell function requires a strict balance between protein synthesis and protein degradation.1 That tight equilibrium is maintained by an intimate collaboration between the protein synthesis, maturation, and folding pathways, which take place in the endoplasmic reticulum (ER) and the Golgi apparatus, and protein degradation pathways consisting of mainly the ubiquitin proteasome system (UPS) and autophagy.2 Many conditions, such as hypoxia, oxidative stress, nutrient deprivation, and genetic mutation, can challenge the proteome integrity through either deficient protein synthesis/folding machinery or malfunctioning protein degradation pathways.3–5 Recently, osmotic stress has been linked to both pathologic protein aggregation and cell death in vivo6–8 as well as increased autophagy and UPS activation in vitro.9 Indeed, proteins require a proper ionic strength to maintain an adequate structure,10 and macromolecular crowding is affected by the regulatory volume changes elicited by aniosmolarity. In mammals, renal and extrarenal mechanisms collaborate to maintain plasma osmolarity around 290–300 mosM/kg water. The brain is one of the most vulnerable organs to abrupt changes in plasma osmolarity, and it is affected by both hypotonicity and hypertonicity. Osmotic demyelination syndrome (ODS), however, represents a very unique pattern of pathologic brain reaction to osmotic imbalance. In this syndrome, which is caused by too abrupt correction of chronic hyponatremia, neither brain dehydration nor brain edema occur; instead, discrete and symmetrical areas of demyelination are seen within the brain a few days after correction of serum sodium is achieved.11–15
It is now accepted that, during rapid correction of chronic hyponatremia, there is a massive astrocyte death16–18 but that the intracellular mechanisms leading to astrocyte death and demyelination have not yet been fully characterized. Here, using a rat model of rapid correction of chronic hyponatremia, we wanted to investigate the effect of osmotic stress on proteostasis in mammalian brain and its potential relevance to osmotic demyelination.
Results
Biochemical Parameters and Outcome of Animals before and after Rapid Correction of Hyponatremia
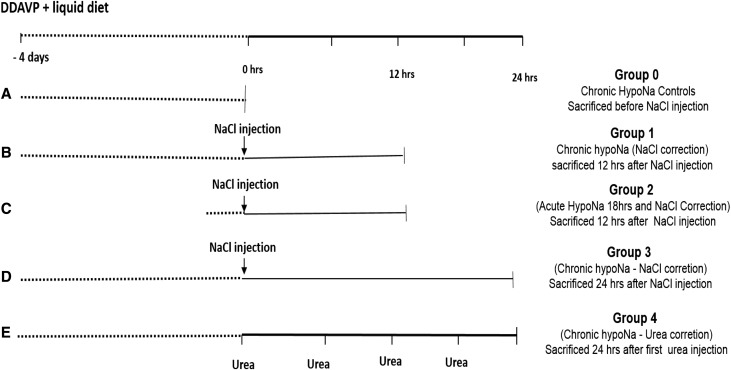
Severe hyponatremia was successfully induced in rats by administration of 1-deamino-8-d-arginine vasopressin (DDAVP; Minirin) and liquid diet in several groups of animals (Figure 1 shows the experimental design). On correction of hyponatremia, serum sodium rapidly increased with an increment above the value previously associated with brain damage in this experiment model (Supplemental Figures 1 and 2, Supplemental Table 1). Correction of chronic hyponatremia with hypertonic saline resulted in a high mortality in contrast to correction of acute hyponatremia with hypertonic saline or treatment of chronic hyponatremia with urea. Histologic analysis confirmed previously described astrocyte loss and demyelination in animals after rapid correction of chronic hyponatremia with hypertonic saline (Supplemental Figure 2) and the absence of demyelination or astrocyte loss after treatment of acute hyponatremia.
Figure 1.
Experimental design used for the study. In A, chronic hyponatremia (HypoNa) was induced and maintained for 4 days through subcutaneous continuous infusion of DDAVP delivered by osmotic minipump and liquid diet. Group 0 (uncorrected chronic HypoNa was used for controls animals for Western blot and IHC studies). (B) In group 1 (n=5), chronic HypoNa was rapidly corrected with a single intraperitoneal injection of hypertonic saline, and animals were euthanized 12 hours after the injection of hypertonic saline (which was 12 hours after the initiation of the correction). Animals from groups 0 and 1 were used to study the early effect of rapid correction of chronic HypoNa on brain proteostasis. (C) In group 2 (n=5), acute HypoNa of 18 hours in duration was induced, and animals were corrected with single intraperitoneal injection of hypertonic saline. Animals were euthanized 12 hours after the injection of hypertonic saline. Those animals were used to study the effect of acute correction of acute HypoNa on brain proteostasis. (D) In group 3 (n=5), chronic HypoNa was corrected with hypertonic NaCl as in group 1, and animals were euthanized 24 hours after NaCl injection. (E) In group 4 (n=5), chronic HypoNa was corrected with four intraperitoneal injections of urea, and animals were euthanized 24 hours after the first injection of urea. Groups 3 and 4 were used to study the differential effect of urea versus hypertonic saline treatment of chronic HypoNa on brain proteostasis. In addition (not shown), five rats from groups 3 and 4 and group 2 (with serum sodium measured before and at 24 hours after initiation correction of HypoNa) were studied up to 5 days after the initiation of HypoNa correction for late clinical and histologic outcomes. NaCl, sodium chloride.
Rapid Correction of Chronic Hyponatremia Induces an Increase in the Amount of Insoluble Proteins and Accumulation of Ubiquitin-Tagged Protein Aggregates
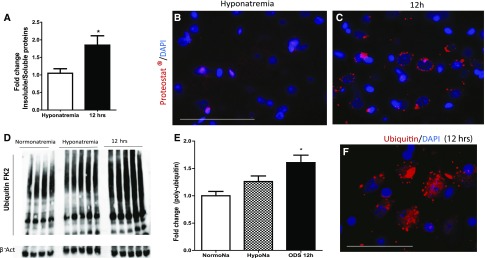
Hypertonic stress increases the amount of insoluble proteins and induces protein aggregation in worms.6 Because rapid treatment of hyponatremia proceeds by a brisk hypertonic stress, we wanted to know if the amount of insoluble proteins increased during rapid correction of hyponatremia in the brain. In treated animals, 12 hours after the correction of SNa had started, we found that the ratio of insoluble to soluble protein was almost doubled compared with controls (Figure 2A).
Figure 2.
Rapid correction of chronic hyponatremia induces accumulation of tagged ubiquitin-insoluble aggregates in the rat brain. In A, the bar graph represents the ratio of RIPA-insoluble proteins to RIPA-soluble proteins, which is increased after rapid correction of chronic hyponatremia (P=0.02 by unpaired t test; n=5 for each group). B shows limited staining for insoluble aggregates (stained by proteostat marker in red; DAPI stains the nuclei in blue) in hyponatremic controls, whereas (C) 12 hours after the correction of chronic hyponatremia, insoluble protein aggregates accumulate around the nuclei. D is a representative image of Western blot for polyubiquitin-tagged protein (polyubiquitin antibody, clone FK2) and actin. (E) Quantification of the amount of insoluble proteins tagged with ubiquitin shows that there are more ubiquitinated insoluble proteins 12 hours after rapid correction of chronic hyponatremia started. ANOVA test followed by Bonferonni post-test; n=4–5 animals in each group. F is a representative image of polyubiquitin-tagged proteins (red) and nuclei (blue) in the brain of an animal 12 hours after rapid correction of chronic hyponatremia showing perinuclear inclusions of ubiquitin-tagged proteins. NormoNa, Normonatremia; HypoNa, Hyponatremia. *P<0.05 for normonatremia/hyponatremia versus 12 hours after initiation of hyponatremia correction. Scale bar, 100 μm.
Using fluorescence imaging of aggregated protein, we determined that aggregated proteins in the brain of corrected animals appeared as small punctate perinuclear structures, which were absent or scarce in hyponatremic controls (Figure 2, B and C). Coimmunofluorescence of aggregated protein and markers for astrocytes, oligodendrocytes, and neurons (glutamine synthase [GS], olig2, and NeuN, respectively) showed no aggregates in oligodendrocytes. However, aggregate staining was present in few neurons and mostly, many cells surrounded by irregular and discontinuous bead, like GS staining (Supplemental Figure 3).
Having shown that protein aggregates were more abundant after correction of chronic hyponatremia, we hypothesized that there would be an increase in protein ubiquitination as a first step to degradation through either UPS or autophagy,19 which both proceed by ubiquitination of protein aggregates. We found that, in the insoluble extracts, more ubiquitinated proteins were present in animals corrected with hypertonic saline compared with hyponatremic controls (P<0.05) (Figure 2, D and E). Ubiquitinated proteins displayed a perinuclear staining, like aggregated proteins (Figure 2F).
Rapid Correction of Chronic Hyponatremia Induces Upregulation of ER Resident Chaperones and Upregulates ER Stress Markers
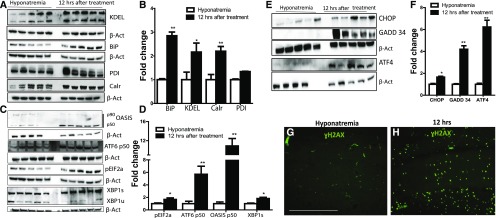
Overload of unfolded proteins in the ER is associated with an increase in the amount of ER resident chaperones and in some cases, triggers the so-called unfolded protein response (UPR) and ER stress response.20 Because we observed an increase of protein aggregation and ubiquitination during early ODS, we wanted to assess the presence of UPR and ER stress in this model of osmotic stress in the brain. We analyzed the levels of ER stress chaperones GRP94, calreticulin, and protein disulfide isomerase (PDI) and the UPR sensor GRP78 (BiP), which correlates with the load of unfolded protein in the ER. We found that BiP and calreticulin were increased in the brains of animals treated with hypertonic saline as early as 12 hours after the treatment was initiated compared with hyponatremic controls (Figure 3, A and B). We also found that there was an increase in the 94-kD band of KDEL, which recognizes the chaperone GRP94. PDI expression was also increased, although only modestly.
Figure 3.
UPR and ER stress are activated during rapid correction of chronic hyponatremia. A and B are (A) representative images and (B) semiquantitative densitometric analysis of Western blot for ER stress and ERAD-related proteins from brain extract of animals in chronic hyponatremia and 12 hours after the correction of chronic hyponatremia. As shown by B, protein levels of KDEL (GRP94 and GRP78), BiP (GRP78), and calreticulin (Calr) significantly increased 12 hours after the correction of chronic hyponatremia. P=0.20 for PDI in B. C and D show (C) images of Western blot and (D) densitometric quantification for OASIS, ATF6, peIF2α, XBP1 spliced (XBP1s), and unspliced (XBP1u) in the brains of chronic hyponatremic control animals compared with chronic hyponatremic animals treated with hypertonic saline 12 hours after the beginning of the treatment. E shows representative images of Western blot of brain homogenates for ER stress effectors of cell death (CHOP, GADD34, and ATF4) in uncorrected hyponatremia controls and 12 hours after rapid correction of chronic hyponatremia. Quantification of protein expression is depicted in F, showing significant increase in the expressions of CHOP, GADD34, and ATF4 on correction of chronic hyponatremia. *P<0.05 for CHOP; **P<0.01 for GADD34 and ATF4. G shows an image of the hippocampus of an uncorrected hyponatremia control animal stained with DNA damage marker ɣH2AX in green; only background and intravascular staining is present, in contrast to D, which shows strong cellular staining in the hippocampus of an animal 12 hours after treatment with hypertonic saline was initiated. β-actin (β-Act) was used as loading control. GADD34, growth arrest and DNA damage protein 34; XBP1, X-box-binding protein. *P<0.05 by unpaired t test (n=4–5 in each group); **P<0.01 by unpaired t test (n=4–5 in each group). Scale bar, 200 μm.
During UPR, protein BiP dissociates from ER membrane transducers PERK, IRE-α, and activating transcription factor 6 (ATF6). This leads to the activation of PERK, causing phosphorylation of eukaryotic translation initiation factor 2α (eIF2α). On BiP dissociation, transphosphorylation of IRE-α will activate its exonuclease activity and generate the spliced form of X-box-binding protein, and finally, ATF6 will migrate to the Golgi and undergo cleavage into a p50 active fragment. The phosphorylation of the eIF2α leads to decrease protein synthesis, whereas IRE-α and ATF6 upregulation will increase the transcription of several ER stress effectors, such as activating transcription factor 4 (ATF4) and C/EBP homologous protein also know as DDIT3 (CHOP).21 Additionally, recent reports have suggested that, in astrocytes, a CREB/ATF4 family member similar to ATF6 called old astrocyte specifically induced substance is another ER transluminal protein that can be activated during ER stress.22 We examined the amounts of phosphorylated eIF2α, p50 cleavage product of ATF6, cleaved OASIS, and spliced X-box-binding protein in corrected animals compared with controls and found that all of these proteins were more abundant in the brain of treated animals than in hyponatremic controls (Figure 3, C and D). This shows that, during ODS, the three different pathways of ER stress are activated.
Rapid Correction of Chronic Hyponatremia Induces Astrocytic DNA Damage and Cycle Arrest and Alters the Apoptotic Balance
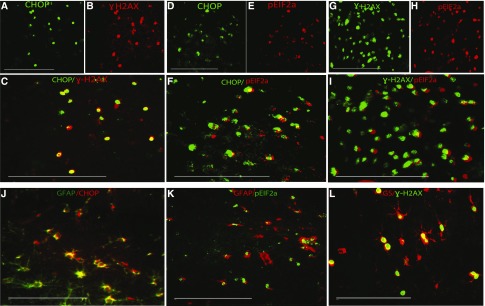
ER stress acts as a normal physiologic phenomenon to maintain normal proteostasis. However, excessive ER stress has been linked to cell death.23 One of the mechanisms linking sustained ER stress to cell death involves the activation of the ER stress–induced cell death mediators ATF4, CHOP, and growth arrest and DNA damage protein 34.24,25 We, therefore, sought to determine if the activation of UPR and ER stress was accompanied by the induction of these molecules. We found that CHOP, ATF4, and growth arrest and DNA damage protein 34 protein were strongly upregulated 12 hours after the rapid correction of chronic hyponatremia started (Figure 3, E and F). Next, we looked at the expression of the G2M arrest marker phospho-H2AX (ɣH2AX), a cell death marker known to be induced in response to DNA damage in various circumstances, including excessive ER stress.26,27 The brains of animals that sustained brisk increase of their serum sodium displayed a robust staining for ɣH2AX, whereas no staining was observed in uncorrected controls (Figure 3G). Moreover, there was a colocalization between CHOP and ɣH2AX, ɣH2AX and peIF2α, and finally, CHOP and eIF2α (Figure 4, A–I). This suggests that, first, ER stress is excessive and irreversible after the osmotic stress and second, cells displaying signs of DNA damage are precisely those suffering from ER stress.
Figure 4.
ER stress marker and DNA damage marker ɣH2AX are expressed in astrocytes during experimental ODS. A–C show representative microphotographs of animals brain (subcortical region) stained with (A) CHOP protein in green and (B) the DNA damage marker ɣH2AX in red. (C) The merged panel reveals that cells expressing CHOP also express ɣH2AX, suggesting that ER-stressed cells exhibit signs of DNA damage. D–F show staining for (D) CHOP in green and (E) peIF2α in red 12 hours after correction of chronic hyponatremia. In F, the merged image shows colocalization between the two markers, which shows that UPR induced by rapid correction of chronic hyponatremia is associated with expression of ER-induced cell death mediator CHOP. G–I show that peIF2α and ɣH2AX are also expressed in the same cells. In J–L, astrocytes markers (GFAP and GS) colocalize with CHOP, peIF2α, and ɣH2AX, respectively, showing that, during ODS-induced UPR, ER stress and DNA damage occur in astrocytes. GFAP, glial fibrillary acidic protein. Scale bar, 200 μm.
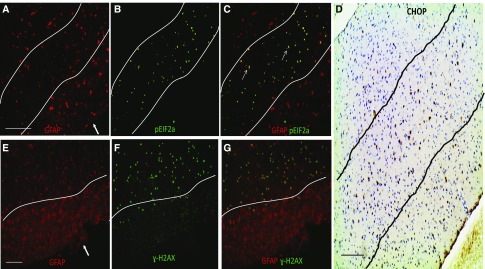
To gain more insight into the involvement of ER stress–induced cell death in ODS, we looked at the distribution of peIF2α, CHOP, and ɣH2AX within the brain of ODS animals. In the murine model of ODS, brain demyelination is accompanied by early astrocyte death in the region in which myelin damage will occur.16,17 In human ODS, astrocyte damage is also an important histopathologic finding.28,29 We postulated that, if the astrocyte loss heralding demyelination was related to ER stress, then ER stress markers and ER stress–mediated cell death markers would be restricted to demyelination-prone regions, with preferential expression in astrocytes. We, therefore, performed colocalization studies with CHOP, peIF2α, ɣH2AX, and specific brain cell markers. We found that CHOP-, peIF2α-, and ɣH2AX-positive signals were restricted to cell-expressing glial fibrillary acidic protein or GS, which are known markers of astrocytes (Figure 4, J–L). Positive staining was limited to regions previously described as vulnerable to demyelination (Figure 5), and no CHOP, prIF2α, and ɣH2AX were found in neurons or oligodendrocytes (Supplemental Figures 4–6). These results suggest that cell cycle arrest, DNA break, and ER stress–related cell death are induced in astrocytes from demyelination-prone regions after rapid correction of chronic hyponatremia.
Figure 5.
UPR/ER stress and DNA damage markers are expressed preferentially in demyelination-prone regions after rapid correction of chronic hyponatremia. Representative microphotographs of the brains of animals 12 hours after correction of hyponatremia is started after staining with (A and E) GFAP (astrocytes) and (B) peIF2α or (F) ɣH2AX. B and F illustrate the regional pattern of expression of peIF2α and ɣH2AX, which is limited to the subcortical regions (delineated with lines). Additionally, the merged image of GFAP and peIF2α staining in C shows that ER stress marker peIF2α staining is limited to regions with reduced GFAP staining. (G) In the merged image of GFAP staining in red and ɣH2AX, costaining confirms that DNA damage marker ɣH2AX is strongly expressed only in subcortical regions with reduced GFAP staining. Expression of CHOP was analyzed by IHC in D, revealing that CHOP expression is limited to the subcortical region as well (dashed lines). Arrows in A and E point to the pia mater. GFAP, glial fibrillary acidic protein. Scale bar, 100 μm.
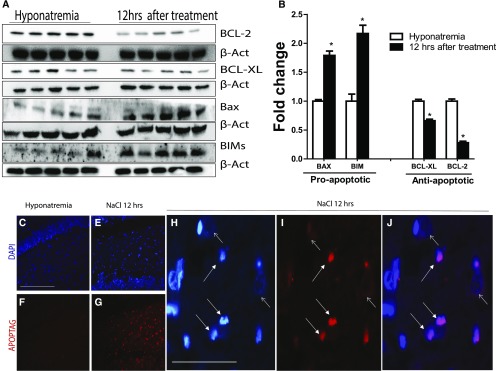
Finally, ER stress and UPR have been shown to modulate the apoptotic balance by altering expression of pro- and antiapoptotic proteins.24,30 We looked at the expressions of antiapoptotic proteins BCL-2 and BCL-XL and their proapoptotic counterparts BAX and BIM. Compared with controls, we observed a significant upregulation of BIM and BAX, whereas BCL-2 and BCL-XL were downregulated 12 hours after hyponatremia correction (Figure 6, A and B). Apoptosis was confirmed by the analysis of the nucleus morphology and APOPTAG staining (Figure 6, C–J).
Figure 6.
Rapid correction of chronic hyponatremia induces apoptosis. In A, Western blot images of pro- and antiapoptotic proteins before and 12 hours after the correction of chronic hyponatremia show that there is a significant increase in proapoptotic proteins (BAX and BIM) in treated animals along with a decrease in antiapoptotic proteins BCL-XL and BCL-2 (quantification shown in B; n=4–5 in each group of animals). *P<0.05 by unpaired t test. In C and F, in situ oligonucleotide ligation assay (Apoptag) staining (which marks apoptotic nuclei; red) and nuclear counterstaining (blue) were performed in the hippocampus of control animals, showing no nuclear condensation and no apoptotic nuclei (no positive staining for Apoptag). In contrast, as shown in E and G, positive Apoptag staining showing cells undergoing apoptosis is seen 12 hours after correction of chronic hyponatremia. In H, higher-magnification images show typical nuclear condensation (small white arrow) seen in apoptotic cells (nonapoptotic nuclei show dispersed chromatin [larger white arrow]). (I) Apoptag staining and (J) merged images confirm that cells with nuclear condensation also stain positive for the Apoptag marker. Scale bar, 200 μm in C–G; 50 μm in H–J.
Increased Autophagy Is Observed after Rapid Correction of Chronic Hyponatremia
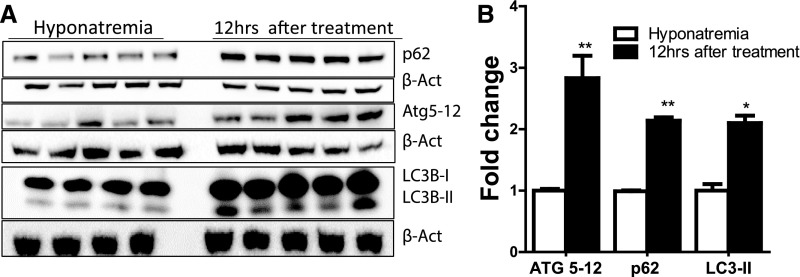
Along with the UPS, macroautophagy can alleviate the toxic effects of protein aggregation in the central nervous system.31 To know if autophagy, which is involved in astrocyte response to hypertonic stress, could play a role in the astrocyte demise that results from the rapid correction of chronic hyponatremia, we looked at the expression of known autophagy markers p62, LC3B, and ATG5–ATG12 conjugates. Compared with hyponatremic animals, we found a significant increase in all of these proteins in the brains of animals treated with hypertonic saline (Figure 7). Immunohistochemistry (IHC) revealed that p62 appeared as punctate perinuclear aggregates (Supplemental Figure 7A). Autophagic cell death in astrocytes is accompanied by specific morphologic cell changes known as clasmatodendrosis, which includes beading of astrocyte processes and vacuolization of the cytoplasm. We confirmed that those morphologic alterations were present in the brains of animals that sustained rapid correction of chronic hyponatremia and restricted to demyelination-prone regions (Supplemental Figure 7B).
Figure 7.
Rapid correction of chronic hyponatremia induces alteration in key autophagy proteins. A shows Western blot images of autophagy-related proteins in the brain of chronic hyponatremic rats (controls) and animals 12 hours after starting correction of chronic hyponatremia. Densitometric quantification depicted in B reveals that there is an increase in the autophagic flux as evidenced by higher protein levels of p62, ATG5–ATG12 conjugates, and LC3BII band; n=4–5 in each group of animals. *P<0.05 by unpaired t test; **P<0.01 by unpaired t test.
Compared with Hypertonic Saline, Correction of Chronic Hyponatremia with Urea Decreases the Amount of Ubiquitinated Proteins and Reduces UPR and ER Stress Markers
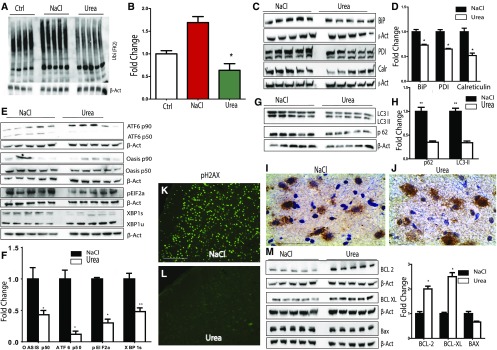
The cellular response to hypertonic stress caused by urea is notably different from hypertonic saline,32 and correction of chronic hyponatremia with urea can alleviate neuropathologic manifestations of ODS.33–35 Therefore, we wanted to investigate the effect of correction of hyponatremia with urea as opposed to hypertonic saline with regards to the proteostasis machinery in the murine brain. Correction of chronic hyponatremia with urea resulted in significantly less protein ubiquitination than after treatment with hypertonic saline (Figure 8, A and B). Treatment with urea resulted in a reduction of UPR as evidenced by reduced amounts of GRP78 (BiP), calreticulin, and PDI (Figure 8, C and D) and reductions in ER stress markers eIF2α, ATF6, and OASIS (Figure 8, E and F).
Figure 8.
Compared with hypertonic saline, rapid correction of chronic hyponatremia with urea partially abrogates alterations in proteostasis. A and B show Western blot images and densitometric quantification for ubiquitinated proteins (poly-Ubiquitin antibody, clone FK2) in the brains of rats with uncorrected chronic hyponatremia (Ctrl), animals corrected with hypertonic saline (NaCl), and animals corrected with urea, respectively. Animals corrected with urea had fewer ubiquitinated proteins compared with animals corrected with hypertonic saline. In C and D, Western blot and quantification of protein expression for ER chaperones BiP (GRP78), PDI and calreticulin (Calr) show that, compared with animals corrected with hypertonic saline, correction of chronic hyponatremia with urea results in a decreased expression of ER stress chaperones. In E and F, protein expression of ER stress proteins ATF6, OASIS, peIF2α, and XBP1 after correction of chronic hyponatremia with hypertonic saline or urea shows that correction with urea significantly decreases the expression of markers of three branches of the UPR/ER stress. In G and H, autophagic protein p62 and LC3II expressions are significantly decreased in animals treated with urea compared with hypertonic saline. (I) IHC for p62 shows that p62 staining appears as punctate perinuclear aggregates in animals corrected with hypertonic saline, whereas (J) fewer aggregates are seen after correction with urea. In K and L, pH2AX expression was analyzed by IHC in animals treated with urea and hypertonic saline, and no expression of pH2Ax was seen in urea-treated animals compared with animals treated with hypertonic saline that display a vigorous pH2Ax staining. In M urea treatment results in a nonsignificant decrease in protein expression of proapoptotic BAX but a significant increased expression of antiapoptotic BCL-2 and BCL-XL. For Western blot quantification, n=4–5 in each group of animals. NaCl, sodium chloride; XBP1, X-box-binding protein. *P<0.05 by unpaired t test; **P<0.01 by unpaired t test.
Compared with Hypertonic Saline, Correction of Hyponatremia with Urea Decreases Autophagy Markers, Partially Restores Expression of Pro- and Antiapoptotic Proteins, and Abrogates H2AX Phosphorylation
We next analyzed the expression of autophagy markers LC3B and p62 in animals treated with hypertonic saline and animals treated with urea. Compared with hypertonic saline, correction of chronic hyponatremia with urea resulted in a reduction of autophagy markers (Figure 8, G–J), and morphologically, astrocytes in the hippocampus, basal ganglia, and subcortical regions of animals treated with urea did not display signs of autophagic cell death or clamatodendrosis (Supplemental Figure 8). Animals treated with urea also had higher expressions of antiapoptotic BCL-2 and BCL-XL, with lower expression of proapoptotic BAX (Figure 8M). Finally, no expression of the DNA damage marker ɣH2AX was found in urea-treated animals (Figure 8, K and L).
Correction of Acute Hyponatremia Does Not Induce UPR and ER Stress Markers
Brain depletion of organic osmolytes that occurs as hyponatremia becomes chronic plays a significant role in the vulnerability of the brain to osmotic demyelination.36 We investigated the effect of rapid correction of acute hyponatremia on ER stress and UPR markers and its relation with clinical and histologic outcome. We confirmed that rapid correction of acute hyponatremia carries a significantly lower mortality than when hyponatremia is chronic. This translated into the absence of astrocyte loss and the absence of demyelination 12 hours and 5 days, respectively, after the correction was achieved (Supplemental Figure 2). We also found no difference in the insoluble versus soluble proteins ratio, no difference in the expression of cardinal markers of UPR and ER stress (OASIS, BiP, eIF2α, and CHOP), and no signs of autophagic cell death or DNA damage between these animals and chronically hyponatremic animals (Supplemental Figure 9). Collectively, these results suggest that rapid correction of acute hyponatremia, which does not induce demyelination, is not accompanied by astrocyte damage, an increase in insoluble protein aggregation, or UPR/ER stress.
Discussion
Cells constantly maintain a tight balance between protein synthesis and folding on one side and protein degradation on the other side. This balance is challenged by several insults that might lead to the development of diseases. Osmotic stress, which induces widespread deleterious protein aggregation, UPR, ER stress, and autophagy, is now recognized as a potent disruptor of proteostasis.6,7,9,37 The potential implications of proteostasis alterations induced by osmotic stress are not yet determined. In the experiments reported here, we used a model of rapid correction of chronic hyponatremia, which leads to myelin loss in the central nervous system, to show that abrupt correction of chronic hyponatremia at similar magnitude as that encountered in human ODS results in dramatic changes of numerous proteostasis mechanisms in mammalian brain and that these alterations are directly linked to development of ODS. We show that, on osmotic stress that results from rapid correction of chronic hyponatremia, astrocytes accumulate a huge load of insoluble proteins in forms of perinuclear aggregates, exhibit markers of UPR and ER stress response, and display an increased autophagy flux along with signs of widespread DNA damage. DNA damage markers and ER stress–induced cell death markers both colocalized in astrocytes, and the regional distribution of all of these markers suggests that ER stress, autophagy, and cell death specifically occur in astrocyte-vulnerable regions, which have also been shown to be the demyelination-prone regions. We and others have recently shown that astrocyte death was a key pathologic feature in the genesis of the demyelination on rapid correction of chronic hyponatremia,16,17 and these new results shed light into the pathophysiologic processes leading to astrocyte death provoked by osmotic stress.
An important limitation of this study is in the fact that we did not provide evidences of a direct causal relationship linking astrocyte loss and demyelination to dysregulated proteostasis. Indeed, another interpretation of these results is that dysregulated proteostasis might occur during the process of astrocyte death but with no mechanistic relationship between the two events. To unequivocally dissect the role of altered proteostasis in ODS, it will be necessary to investigate the effect of specific drugs that can modulate the protein aggregation machinery in ODS, such as anisomycin, or autophagy modulators, like rapamycin and sirolimus. It is, however, interesting to note that the changes elicited by correction of chronic hyponatremia were not found after acute hyponatremia was corrected. It is possible that, during acute hyponatremia, the brain, which is not yet depleted from protective organic osmolytes, retains all of its adaptative capabilities to face acute osmotic changes.
Another finding of this study that is worth a comment is that urea treatment could mitigate many alterations in proteostasis in astrocytes. Azotemic animals are virtually protected from osmotic demyelination after rapid correction of chronic hyponatremia,34 and rapid correction of hyponatremia in animals with urea results in less demyelination and only minimal astrocyte loss.34 Hyperosmotic stress caused by urea as opposed to hypertonic saline does not increase protein aggregation in worms. Here, we found that urea treatment, compared with hypertonic saline, significantly reduced UPR/ER stress markers, downregulated autophagy markers, and turned the apoptotic protein balance into a prosurvival profile. A significant shortcoming of this study on this regard is the fact that, although the final increment of serum sodium at 24 hours was similar in both groups, we have previously shown that animals corrected with hypertonic saline having a quicker rate of correction of serum sodium than urea. It is, therefore, possible that the protective effect of urea on proteostasis and the outcome are, in part, related to the slower rate of correction of serum sodium.
A few differences between the model used in this study and the previous studies addressing proteostasis imbalance in osmotic stress are worth mentioning. First, we used a whole-organ model in a mammalian species (i.e., rat CNS), whereas previous studies were done in cell lines or worms. Second, the magnitude of the osmotic challenge that we used in these experiments is at least two- to threefold lower than the osmotic shock used in previous studies,7,9 and such level of osmotic stress is far above the recommended increment of serum sodium during hyponatremia. Evidently, studies using autopsy material from patients with ODS are needed to confirm the alterations in proteostasis that we found in our rat model.
In summary, our findings not only identify osmotic stress as a regulator of proteostasis in mammalian brain but also, further clarify the earliest events leading to astrocyte death and osmotic demyelination on rapid correction of chronic hyponatremia.
Concise Methods
Antibodies and Reagents
Antibodies for IHC and Western blot are listed in Supplemental Table 1. DDAVP was purchased from Ferring (Alost, Belgium), and urea was purchased from the hospital pharmacy of Hopital Erasme (Free University of Brussels, Brussels, Belgium).
Animals, Induction, and Correction of Hyponatremia
Male Sprague–Dawley rats (purchased from Charles River Laboratory) weighing approximately 250–300 g were used for all experiments. Acute hyponatremia was induced by water gavage at 10 ml/100 g body wt given twice 6 hours apart and concomitant liquid diet (AIN 76 purchased from SAFE DIETS, Aubry, France) along with infusion of DDAVP through a osmotic minipump (Model 2001; Alzet). Chronic hyponatremia was induced as previously described with continuous release of DDAVP through a subcutaneous osmotic minipump and maintained for 4 days. Filled minipumps were primed by letting them soak in normosaline for 48 hours to ensure a steady delivery rate right after their insertion. Hyponatremia was corrected with hypertonic saline (2 M sodium chloride) injected intraperitoneally (1 ml/100 g body wt) or urea given by four intraperitoneal injections 6 hours apart at the dose of 0.6 ml/100 g body wt according to the experimental design as described below.
Experimental Design
To study the early effects of rapid correction of chronic hyponatremia, two groups of animals were compared: group 0 included uncorrected hyponatremic animals, and group 1 included animals with chronic hyponatremia, which was corrected with hypertonic saline, that were euthanized 12 hours after the initiation of hyponatremia correction (i.e., 12 hours after the injection of hypertonic saline).
To compare the changes elicited between rapid correction of chronic hyponatremia with urea and hypertonic saline, two groups of animals were used: group 3, in which hyponatremia was induced and corrected with hypertonic saline, and group 4, in which chronic hyponatremia was corrected with urea. Animals in groups 3 and 4 were euthanized 24 hours after the initiation of the correction (24 hours after the first dose of urea or the single dose of hypertonic saline). The time of 24 hours was chosen, because the expected large increment of serum sodium when using urea in our model occurs after 18–24 hours. To compare the study effects of rapid correction of acute hyponatremia, we used animals from group 2, which consisted of acutely hyponatremic animals that underwent rapid treatment with hypertonic saline and were euthanized 24 hours after the initiation of the correction. They were compared with uncorrected chronic hyponatremic controls (group 0). For proteomic studies, all groups of animals consisted of five individuals.
Finally, we performed survival analysis and studied demyelination by analyzing an additional series of five animals each: acute hyponatremia corrected with hypertonic saline, chronic hyponatremia corrected with hypertonic saline, and chronic hyponatremia corrected with urea. All of these animals were studied for up to 5 days after the initiation of rapid correction of hyponatremia. The serum sodium was obtained before and 24 hours after the correction of hyponatremia started.
Serum Electrolytes Analyses
Blood was collected by tail venipuncture at different time points according to the group allocation under light anesthesia. Serum sodium and urea were analyzed through the COBAS Automated System.
At the time of euthanasia, animal brains were dissected, and both hemispheres were collected, flash frozen in liquid nitrogen or fixed with formaldehyde, and stored adequately for downstream applications.
Protein Extraction
Soluble and insoluble brain protein extracts were obtained using the following procedure.37 Approximately 0.250 mg frozen brain for each rat was homogenized in 1 ml RIPA buffer supplemented with protease and phosphatase inhibitor (Complete Kit; Roche); 500 μl homogenate was centrifuged at 15,000×g for 30 minutes, and the supernatant was collected as the initial soluble fraction. The pellet was washed twice with RIPA and centrifuged again, and the resulting supernatant was mixed with the previous supernatant to form the RIPA-soluble fraction S1. The final pellet was mixed with 250 μl solubilization buffer (50 mM Tris and 2% SDS), sonicated, and agitated at 4°C for 1 hour; then, it was centrifuged at 15,000×g for 30 minutes, and the resulting supernatant containing RIPA-insoluble protein was collected as S2.
The protein concentrations of S1 and S2 fractions were assayed after appropriate dilution with the BCA Protein Kit (Pierce), and the fraction of insoluble proteins over soluble proteins (S2/S1) was calculated and normalized to the amount of raw rat brain used for the entire extraction procedure. Aliquots from both soluble and insoluble fractions were stored at −80°C until further use. Because protein aggregation and autophagy proceed by mechanisms involving accumulation of LC3II, p62, ubiquitin, and ATG5–ATG12 in insoluble aggregates and vesicles, we used the insoluble proteins fraction for Western blots procedures involving these proteins. Soluble protein fractions were used for all of the other procedures.
Semiquantitative Western Blot
In total, 10–100 μg protein was loaded into precast gel of different percentages (Trupage Gel; Sigma-Aldrich, Diegem, Belgium) and after electrophoresis, transferred into PVDF or nitrocellulose membrane, which was blocked with 10% (wt/vol) nonfat dry milk or 5% BSA (wt/vol) for 2 hours at room temperature. The membranes were incubated with primary antibody overnight, and after sequential washing, secondary antibody incubation was performed followed by washing and re-evaluation using the ECL technique with ECL Sirius Reagent or Clarity ECL (Bio-Rad Laboratories, Gent, Belgium). Membranes were sequentially stripped and reproped by actin antibody for loading control analysis. Pictures were taken using the Fusion Solo Imaging Apparatus (Vilbert Lourmat, Collegien, France).
The density of each band was calculated with GelQaunt software and divided by the corresponding density of β-actin, which was used as loading/migration and transfer control. The mean density of control was obtained, and the ratio of fold change was calculated by dividing the density of each band by the mean density of control. Western blot experiments were carried out with at least four different biologic replicates (brain proteins homogenates from at least four animals) and repeated at least twice to ensure reproducibility.
IHC and Immunofluorescence and Fluorescent Histochemistry
The IHC procedure was performed on a paraffin-embedded, paraformaldehyde-fixed section of rat brain as previously described using citrate (pH 6) or the Tris⋅EDTA (pH 9) antigen retrieval procedure when appropriate. Antibody information and dilution titer and staining reagents used are listed in Supplemental Table 2. Double-staining indirect immunofluorescence was performed as described previously using appropriate secondary fluorescent secondary antibody with the tyramide amplification procedure if deemed necessary.
Fluorescent Chemistry Detection of Protein Aggregates
Protein aggregates were detected on paraformaldehyde-fixed and paraffin-embedded slides using the Proteostat Amyloid Detection Kit according to the manufacturer’s instructions. When performing double staining with proteostat and another cell marker, immunofluorescence for the cellular antigen was performed first, and after addition of the fluorochrome, slides were washed and incubated for 10 minutes with paraformaldehyde followed by proteostat dye.
Apoptosis Staining by In Situ Ligation Assay
In situ ligation assay for detection of apoptosis was performed by the animal ethic and welfare committee of the Faculty of Medicine, Université Libre de Bruxelles, using the commercially available Apoptag Kit from EMD Millipore (Merck-Millipore) and fluorochrome-linked streptavidin.
Disclosures
None.
Supplementary Material
Acknowledgments
The authors thank Michelle Authelet for her technical assistance, Dr. Rim Kada and Olivier Mat for their help in the logistic preparation of the experiments, and Charles Nicaise and Dr. Kunie Ando for their intellectual input in the design of the experiments.
This research was supported by grant J0137.14 from Fonds National de la Recherche Scientifique and a grant from Fondation Erasme. The study was approved by the animal studies IRB of Université Libre de Bruxelles (Comité d’éthique et de bien être animal-CEBEA) under Protocol number 512N and 511N.
Footnotes
Published online ahead of print. Publication date available at www.jasn.org.
This article contains supplemental material online at http://jasn.asnjournals.org/lookup/suppl/doi:10.1681/ASN.2016050509/-/DCSupplemental.
References
- 1.Labbadia J, Morimoto RI: The biology of proteostasis in aging and disease. Annu Rev Biochem 84: 435–464, 2015 [DOI] [PMC free article] [PubMed] [Google Scholar]
- 2.Hetz C, Chevet E, Oakes SA: Proteostasis control by the unfolded protein response. Nat Cell Biol 17: 829–838, 2015 [DOI] [PMC free article] [PubMed] [Google Scholar]
- 3.Ross CA, Poirier MA: Protein aggregation and neurodegenerative disease. Nat Med 10[Suppl]: S10–S17, 2004 [DOI] [PubMed] [Google Scholar]
- 4.Eizirik DL, Cardozo AK, Cnop M: The role for endoplasmic reticulum stress in diabetes mellitus. Endocr Rev 29: 42–61, 2008 [DOI] [PubMed] [Google Scholar]
- 5.Yoshida H: ER stress and diseases. FEBS J 274: 630–658, 2007 [DOI] [PubMed] [Google Scholar]
- 6.Burkewitz K, Choe K, Strange K: Hypertonic stress induces rapid and widespread protein damage in C. elegans. Am J Physiol Cell Physiol 301: C566–C576, 2011 [DOI] [PMC free article] [PubMed] [Google Scholar]
- 7.Choe KP, Strange K: Genome-wide RNAi screen and in vivo protein aggregation reporters identify degradation of damaged proteins as an essential hypertonic stress response. Am J Physiol Cell Physiol 295: C1488–C1498, 2008 [DOI] [PMC free article] [PubMed] [Google Scholar]
- 8.Lamitina T, Huang CG, Strange K: Genome-wide RNAi screening identifies protein damage as a regulator of osmoprotective gene expression. Proc Natl Acad Sci USA 103: 12173–12178, 2006 [DOI] [PMC free article] [PubMed] [Google Scholar]
- 9.Nunes P, Ernandez T, Roth I, Qiao X, Strebel D, Bouley R, Charollais A, Ramadori P, Foti M, Meda P, Féraille E, Brown D, Hasler U: Hypertonic stress promotes autophagy and microtubule-dependent autophagosomal clusters. Autophagy 9: 550–567, 2013 [DOI] [PMC free article] [PubMed] [Google Scholar]
- 10.Munishkina LA, Ahmad A, Fink AL, Uversky VN: Guiding protein aggregation with macromolecular crowding. Biochemistry 47: 8993–9006, 2008 [DOI] [PMC free article] [PubMed] [Google Scholar]
- 11.Sterns RH, Riggs JE, Schochet SS Jr.: Osmotic demyelination syndrome following correction of hyponatremia. N Engl J Med 314: 1535–1542, 1986 [DOI] [PubMed] [Google Scholar]
- 12.Sterns RH, Cappuccio JD, Silver SM, Cohen EP: Neurologic sequelae after treatment of severe hyponatremia: A multicenter perspective. J Am Soc Nephrol 4: 1522–1530, 1994 [DOI] [PubMed] [Google Scholar]
- 13.Kleinschmidt-DeMasters BK, Norenberg MD: Rapid correction of hyponatremia causes demyelination: Relation to central pontine myelinolysis. Science 211: 1068–1070, 1981 [DOI] [PubMed] [Google Scholar]
- 14.Verbalis JG, Martinez AJ: Neurological and neuropathological sequelae of correction of chronic hyponatremia. Kidney Int 39: 1274–1282, 1991 [DOI] [PubMed] [Google Scholar]
- 15.Gankam Kengne F, Decaux G: CNS manifestations of hyponatremia and its treatment. In: Hyponatremia, edited by Simon EE, New York, Springer, 2013, pp 87–110 [Google Scholar]
- 16.Gankam Kengne F, Nicaise C, Soupart A, Boom A, Schiettecatte J, Pochet R, Brion JP, Decaux G: Astrocytes are an early target in osmotic demyelination syndrome. J Am Soc Nephrol 22: 1834–1845, 2011 [DOI] [PMC free article] [PubMed] [Google Scholar]
- 17.Iwama S, Sugimura Y, Suzuki H, Suzuki H, Murase T, Ozaki N, Nagasaki H, Arima H, Murata Y, Sawada M, Oiso Y: Time-dependent changes in proinflammatory and neurotrophic responses of microglia and astrocytes in a rat model of osmotic demyelination syndrome. Glia 59: 452–462, 2011 [DOI] [PubMed] [Google Scholar]
- 18.Murase T, Sugimura Y, Takefuji S, Oiso Y, Murata Y: Mechanisms and therapy of osmotic demyelination. Am J Med 119[Suppl 1]: S69–S73, 2006 [DOI] [PubMed] [Google Scholar]
- 19.Lecker SH, Goldberg AL, Mitch WE: Protein degradation by the ubiquitin-proteasome pathway in normal and disease states. J Am Soc Nephrol 17: 1807–1819, 2006 [DOI] [PubMed] [Google Scholar]
- 20.Ron D, Walter P: Signal integration in the endoplasmic reticulum unfolded protein response. Nat Rev Mol Cell Biol 8: 519–529, 2007 [DOI] [PubMed] [Google Scholar]
- 21.Hetz C: The unfolded protein response: Controlling cell fate decisions under ER stress and beyond. Nat Rev Mol Cell Biol 13: 89–102, 2012 [DOI] [PubMed] [Google Scholar]
- 22.Kondo S, Murakami T, Tatsumi K, Ogata M, Kanemoto S, Otori K, Iseki K, Wanaka A, Imaizumi K: OASIS, a CREB/ATF-family member, modulates UPR signalling in astrocytes. Nat Cell Biol 7: 186–194, 2005 [DOI] [PubMed] [Google Scholar]
- 23.Xu C, Bailly-Maitre B, Reed JC: Endoplasmic reticulum stress: Cell life and death decisions. J Clin Invest 115: 2656–2664, 2005 [DOI] [PMC free article] [PubMed] [Google Scholar]
- 24.Szegezdi E, Logue SE, Gorman AM, Samali A: Mediators of endoplasmic reticulum stress-induced apoptosis. EMBO Rep 7: 880–885, 2006 [DOI] [PMC free article] [PubMed] [Google Scholar]
- 25.Oyadomari S, Mori M: Roles of CHOP/GADD153 in endoplasmic reticulum stress. Cell Death Differ 11: 381–389, 2004 [DOI] [PubMed] [Google Scholar]
- 26.Cook PJ, Ju BG, Telese F, Wang X, Glass CK, Rosenfeld MG: Tyrosine dephosphorylation of H2AX modulates apoptosis and survival decisions. Nature 458: 591–596, 2009 [DOI] [PMC free article] [PubMed] [Google Scholar]
- 27.Yamamori T, Meike S, Nagane M, Yasui H, Inanami O: ER stress suppresses DNA double-strand break repair and sensitizes tumor cells to ionizing radiation by stimulating proteasomal degradation of Rad51. FEBS Lett 587: 3348–3353, 2013 [DOI] [PubMed] [Google Scholar]
- 28.Gocht A, Löhler J: Changes in glial cell markers in recent and old demyelinated lesions in central pontine myelinolysis. Acta Neuropathol 80: 46–58, 1990 [DOI] [PubMed] [Google Scholar]
- 29.Popescu BFG, Bunyan RF, Guo Y, Parisi JE, Lennon VA, Lucchinetti CF: Evidence of aquaporin involvement in human central pontine myelinolysis. Acta Neuropathol Commun 1: 40, 2013 [DOI] [PMC free article] [PubMed] [Google Scholar]
- 30.Szegezdi E, Macdonald DC, Ní Chonghaile T, Gupta S, Samali A: Bcl-2 family on guard at the ER. Am J Physiol Cell Physiol 296: C941–C953, 2009 [DOI] [PubMed] [Google Scholar]
- 31.Rubinsztein DC: The roles of intracellular protein-degradation pathways in neurodegeneration. Nature 443: 780–786, 2006 [DOI] [PubMed] [Google Scholar]
- 32.Lee SD, Choi SY, Kwon HM: Distinct cellular pathways for resistance to urea stress and hypertonic stress. Am J Physiol Cell Physiol 300: C692–C696, 2011 [DOI] [PMC free article] [PubMed] [Google Scholar]
- 33.Gankam Kengne F, Couturier BS, Soupart A, Decaux G: Urea minimizes brain complications following rapid correction of chronic hyponatremia compared with vasopressin antagonist or hypertonic saline. Kidney Int 87: 323–331, 2015 [DOI] [PubMed] [Google Scholar]
- 34.Soupart A, Penninckx R, Stenuit A, Decaux G: Azotemia (48 h) decreases the risk of brain damage in rats after correction of chronic hyponatremia. Brain Res 852: 167–172, 2000 [DOI] [PubMed] [Google Scholar]
- 35.Soupart A, Schroëder B, Decaux G: Treatment of hyponatraemia by urea decreases risks of brain complications in rats. Brain osmolyte contents analysis. Nephrol Dial Transplant 22: 1856–1863, 2007 [DOI] [PubMed] [Google Scholar]
- 36.Lien YH: Role of organic osmolytes in myelinolysis. A topographic study in rats after rapid correction of hyponatremia. J Clin Invest 95: 1579–1586, 1995 [DOI] [PMC free article] [PubMed] [Google Scholar]
- 37.Burkewitz K, Choe KP, Lee EC, Deonarine A, Strange K: Characterization of the proteostasis roles of glycerol accumulation, protein degradation and protein synthesis during osmotic stress in C. elegans. PLoS One 7: e34153, 2012 [DOI] [PMC free article] [PubMed] [Google Scholar]
Associated Data
This section collects any data citations, data availability statements, or supplementary materials included in this article.


