Abstract
Introduction:
In spite of three decades of neuroimaging, we are unable to find consistent and coherent anatomical or pathophysiological basis for autism as changes are subtle and there are no studies from India.
Aim:
To study the regional cerebral glucose metabolism in children with autism using positron emission tomography (PET) scan and to study the behavior and cognitive functioning among them.
Materials and Methods:
Ten subjects (8–19 years) meeting Diagnostic and Statistical Manual of Mental Disorders, Fourth Edition criteria for autism were evaluated on Childhood Autism Rating Scale (CARS), trail making test (TMT) A and B, Wisconsin card sorting test, Raven's progressive matrices, and PET scan. A control group of 15 matched subjects without any brain pathology or neurological disorder was similarly studied.
Results:
Four out of the ten patients with autism had abnormal PET scan findings, and in contrast, none of the patients in the control group had abnormal PET scan. Of the four patients with abnormality in the PET scan, two patients had findings suggestive of hypometabolism in cerebellum bilaterally; one patient showed bilateral hypometabolism in anterior temporal cortices and cerebellum, and the fourth patient had hypermetabolism in the bilateral frontal cortices and medial occipital cortices. Subjects with autism performed poorly on neuropsychological testing. Patients with abnormal PET scan findings had significantly higher scores on the “body use” domain of CARS indicating more stereotypy.
Conclusion:
Findings of this study support the view of altered brain functioning in subjects with autism.
Keywords: Autism, autism spectrum disorder, neuropsychological functioning, positron emission tomography scan
INTRODUCTION
Autism spectrum disorder (ASD) is a neurodevelopmental disorder with a range of clinical presentations. These presentations vary from mild to severe and children with ASD most commonly present with impairment in the social interaction, which is associated with communication deficits (verbal and nonverbal) and stereotyped and repetitive behaviors. The prevalence of ASD has been reported to vary from 30 to 100/10,000 populations, including 13–30/10,000 for Autism and 3/10,000 for Asperger's disorder.[1]
Since its first clinical description, various theories have been postulated to understand the etiology of ASD. Initially, Kanner[2] gave the concept of “refrigerator mother,” which suggested problems with parenting. Over the years, the understanding about the disorder has changed, and recent conceptualizations suggest that ASD is a “disorder of early brain development.” Studies which have evaluated the neuropsychological functions of children with ASD suggest impairment in the executive functions, information processing, sensory processing and integration, and speech and language processing.[3]
However, no coherent anatomical or pathophysiological theory of autism has been developed so far. Over the last three decades, modern neuroimaging studies such as magnetic resonance imaging (MRI), positron emission tomography (PET), single-photon emission computed tomography (SPECT), and functional MRI have been conducted to understand the neuroanatomical and neurophysiological basis of autism, but still there is lack of consistency in results across various studies. Hence, there is a need to conduct more studies to enhance the neurobiological underpinning of autism. The present study aimed to study the abnormalities in regional cerebral glucose metabolism, an indirect marker of neural activity using PET in children and adolescents with autism and to compare it with that in healthy controls. Further, an attempt was made to study neuropsychological functions and examine associations, if any, of PET findings with behavior and neuropsychological functions. It is hoped that increased understanding of the underlying neurobiological basis of autism can lead to a better characterization of the phenotype of autism and hopefully bring new insights in treatment.
MATERIALS AND METHODS
Subject selection
The study was conducted at PGIMER, Chandigarh, a tertiary care hospital in North India. The study was approved by the Institute Ethical Committee. Participants of the study group (i.e., autism) were recruited from those attending the Child and Adolescent Psychiatry Clinic, Department of Psychiatry. All the participants were recruited after obtaining written informed consent from the parents and assent/consent from the children and adolescent.
The study included ten subjects of autism diagnosed as per the Diagnostic and Statistical Manual of Mental Disorders, Fourth Edition (DSM-IV) criteria and 15 control subjects. To be included in the study, children and adolescents of both the study groups (autism and healthy controls) were required to be aged 8–19 years and of either gender. Those children and adolescents who were uncooperative had profound mental retardation, epilepsy, or other neurological illness were excluded from the study. In addition, children and adolescents with autism were required not to be on any psychotropic medications for at least 1 month before the PET scan. Control group was age- and gender-matched children selected from the cases already committed to undergo PET scan in the Department of Nuclear Medicine for some other medical illness such as Wilm's tumor, hepatoblastoma, rhabdomyosarcoma, retinoblastoma not involving the brain, who were neurodevelopmentally normal and had no neuropsychiatric illness.
Materials used and assessment
The following instruments were used.
Diagnostic and Statistical Manual of Mental Disorders, Fourth Edition criteria for pervasive developmental disorder/autistic spectrum disorder
DSM-IV criteria[4] were used to diagnose autism by a qualified psychiatrist, who had good clinical experience in child and adolescent psychiatry.
Childhood Autism Rating Scale
It is a 15-item behavioral rating scale developed to identify children with ASD and to distinguish them from developmentally handicapped children without ASD. It has high reliability (intrascorer reliability 0.94, interscorer reliability 0.71) and validity (0.84).[5] Ratings are done based on observations during psychological evaluation, parents’ reports, and clinical history. Each item is scored on four-point scale (1–4), with score of 1 indicating normal behavior and 4 indicating severely abnormal behavior. Total score of <30 is suggestive of lack of autism; a score of 30–36.5 indicates mild to moderate autism, and a score of >36.5 is indicative of severe autism.
Self-reporting questionnaire
It is an instrument designed for screening the presence of psychiatric illness in patients contacting primary health-care settings. It can be self-administered or interviewer administered for illiterate or semi-literate patients.[6] The questionnaire consists of 24 items, twenty of which are related to neurotic symptoms and four related to psychotic symptoms. Each of the 24 questions is scored as 1 or 0; score of 1 indicates that symptom was present during the past month and score 0 indicates that symptom was absent. Depending on the criteria, culture and language, different cutoff scores are selected in different studies, but most often the cutoff score is 7 or more indicates the existence of a probable psychiatric illness.[6] The self-reporting questionnaire (SRQ) has been tested in over twenty studies (including the WHO Collaborative Study of Mental Disorders in Primary Health Care)[6] and has been found to be an appropriate, reliable, and valuable case finding tool for use in the primary health-care settings, particularly in developing countries. In this study, it was used to screen healthy controls.
PET-computed tomography (CT) is an imaging device, which combines PET and X-ray CT so that images acquired from both devices can be taken sequentially, in the same session from the patient and combined into a single superposed image. Thus, the image obtained by PET, which depicts the spatial distribution of metabolic or biochemical activity in the body can be more precisely aligned or correlated with anatomic imaging obtained by CT scanning.
The tracer [18 F] 2-deoxyglucose was administered intravenously in a quiet room with dimmed lights, 45 min before PET data acquisition. In all subjects with ASD, PET studies were performed at rest and those who did not cooperate were sedated by premedication with midazolam. As the radionuclide tracer was taken up and fixed by the brain during the waiting period of 45 min, sedating the child before the PET scan did not alter the already fixed tracer. Tomographic PET images of the brain were acquired 45 min after intravenous administration of [18 F] 2-deoxyglucose. The data were reconstructed using iterative reconstruction and display in axial, sagittal, and coronal views.
Psychological tests
Trail making test Part A and B
The test has two parts, Part A and Part B. It tests speed of attention, sequencing, mental flexibility, visual search, and motor function. Time taken on TMT A reflects visual searching ability. Time taken on TMT B reflects processing speed and mental tracking while TMT B error score reflects working memory and executive functioning. The test has been shown to have high reliability and validity. For both TMT Part A and B, scores are expressed in terms of time taken in seconds to complete the test and the number of errors committed by the subjects in each of the subtests.[7]
Raven's progressive matrices
It measures general intelligence factor in individuals’ aged between 6 and 80 years. The scale is designed to provide a reliable estimate of a person's capacity to think clearly when allowed to work steadily at his or her own speed from beginning to end without interruption.[8] The total score provides a measure of individual capacity. It is nonverbal, culture-free test of intelligence. Standard progressive matrices were applied to patients aged 11–19 years and colored progressive matrices were applied to patients from 8 to 11 years of age and patients with subnormal intelligence quotient (IQ) in the current study.
Wisconsin card sorting test
It measures the ability to form abstract concepts, shift and maintain set, ability to utilize feedback, and inhibitory control of interference which are primarily mediated by the dorsolateral prefrontal cortex.[9] The interrater reliability ranges from 0.89 to 1.0 and intra-rater reliability range from 0.82 to 1.0. The test also has high validity.[9]
Procedure of the study
Patients diagnosed as having autism by a consultant psychiatrist, coming to the Child and Adolescent Psychiatry Clinic, PGIMER Chandigarh was approached. A written informed consent was obtained from the parents, and an assent was obtained from the patient. Children and adolescents who provided assent and whose parents consented for participation in the study were assessed on DSM-IV criteria to confirm the diagnosis. Sociodemographic profile sheet and clinical profile sheet containing information about onset, progression, duration of illness, and treatment history were applied by the investigator to collect relevant data. Then, the patients underwent a comprehensive psychological, neurologic, and medical evaluation. Psychological evaluation included assessment on Childhood Autism Rating Scale (CARS), Wisconsin card sorting test (WCST), TMT-A, TMT-B, and Raven's progressive matrices for the study group. Neurologic and medical evaluation included thorough systemic examination with special focus on neurologic examination to rule out primary or secondary neurological problems. The evaluation was carried out not more than 7 days before the PET evaluation. In all subjects with autism, PET studies were performed at rest under the guidance of consultant radiologist and those who did not cooperate were sedated by premedication with midazolam. As the radionuclide tracer was taken up and fixed by the brain during the waiting period of 45 min, sedating the child before the PET scan did not alter the already fixed tracer.
The control group was selected from the cases already committed to undergo PET scan in the Department of Nuclear Medicine, Nehru Hospital, PGIMER, Chandigarh. They were undergoing PET scan for oncological work up not involving the brain as confirmed by clinical evaluation and MRI brain scan. Eight of the control group patients had Wilm's tumor, three had rhabdomyosarcoma, two had retinoblastoma, and two had hepatoblastoma. All these patients were treatment naive. With the permission from concerned consultant referring the patient for PET scan, Children, and adolescents who provided assent and whose parents consented for participation in the study were recruited. Sociodemographic profile sheet and clinical profile sheet containing information about onset, progression, duration of illness, and treatment history were applied by the investigator at the respective wards of the patient to collect relevant data. They were assessed on SRQ to rule out psychiatric illness including mental retardation. The PET procedure for the control group was similar to that followed for the study group.
Statistical analyses
Descriptive analysis was carried out using mean and standard deviation with range for continuous variables and in terms of frequency and percentages for discontinuous sociodemographic and clinical variables. Wechsler Adult Intelligence Scale equivalent IQ from the scores on color progressive matrices, meantime, and errors on TMT A and B and mean scores on WCST were calculated in all subjects. The neuropsychological functions of subjects with and without abnormality on PET were compared using t-test, Mann–Whitney U-test, and Chi-square test.
The glucose metabolism of the respective areas of cerebral hemispheres as obtained on PET scans was compared to global cerebral maximum and visual comparison of both hemispheres was done and compared with controls. Areas of altered metabolism, i.e., hypo/hypermetabolism was visually graded as mild, moderate, and severe (qualitative assessment).
RESULTS
The mean age of the subjects with autism was 13.75 years. They had formal education for an average of about 4.5 years. When compared to the healthy control group as shown in Table 1, subjects with autism had received significantly lower level of formal education. The mean age of the participants with autism at which symptoms of autism were noted for the first time was 1.80 years, and the mean duration of illness at the time of assessment was 11.85 years. The mean duration of treatment either nonpharmacological or pharmacological was 0.75 years. Only four out of ten patients had received some form of psychotropic medication in the past (however, were not on pharmacological treatment at the time of study) for their symptoms such as restlessness and hyperactivity.
Table 1.
Sociodemographic profile of participants and clinical profile of subjects with autism spectrum disorder
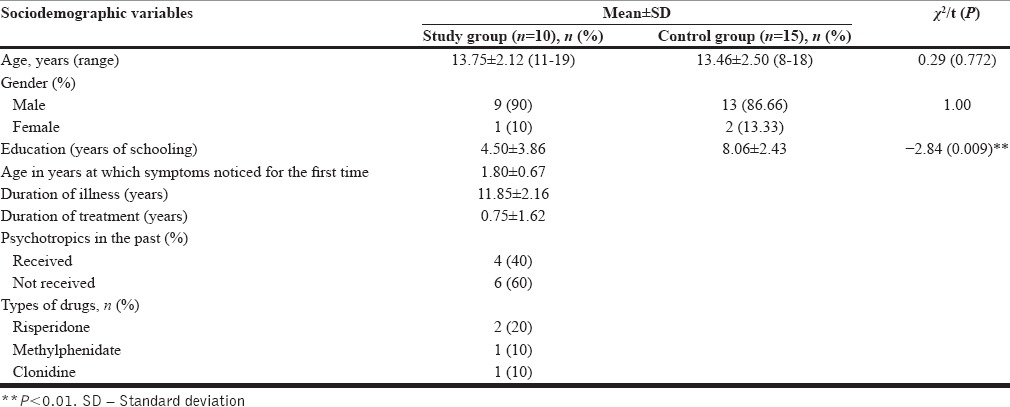
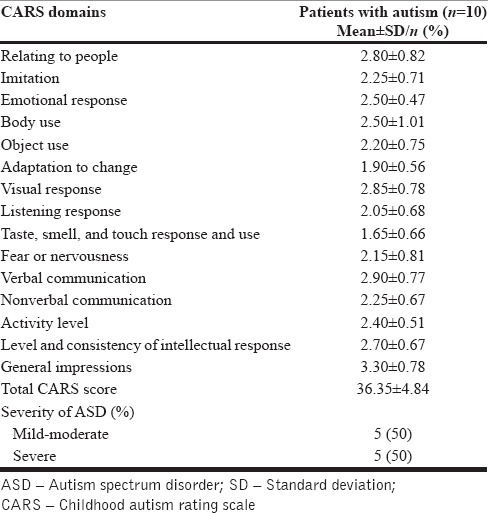
As shown in Table 2, mean CARS score for the study group was 36.35, and half of the patients had severe autism and another half had mild to moderate autism. The mean score was highest for the domain of “General impressions” followed by “verbal communication,” “visual response,” “relating to people”, and “level and consistency of intellectual response.”
Table 2.
Rating on childhood autism rating scale
Neuropsychological profile of the patients with autism
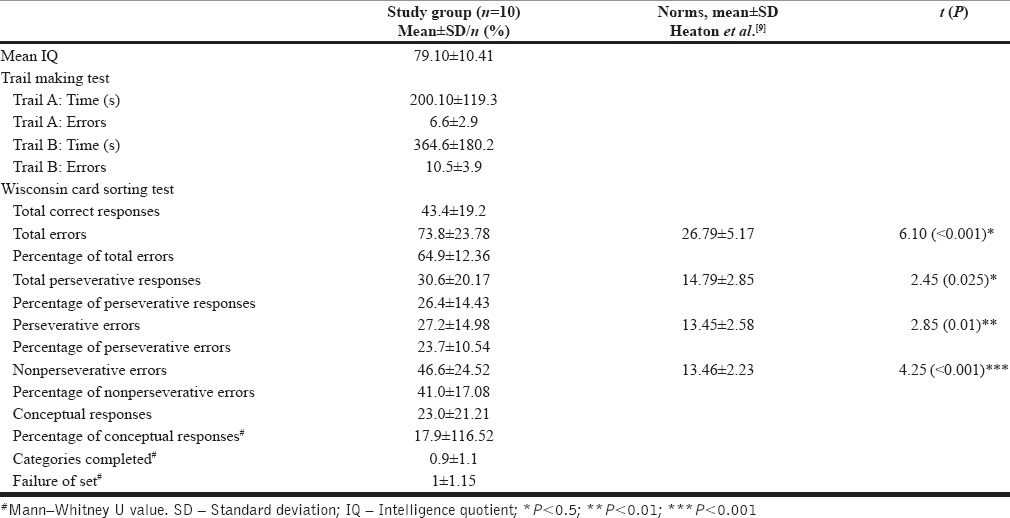
The mean IQ score of the subjects in the autism group was about eighty. In the study group, only one patient had mental subnormality (IQ < 70), eight patients had IQ in the range of 71–90 and one patient had IQ more than ninety. On TMT-A, subjects with autism made 6.6 errors and on TMT-B the mean number of errors was 10.5. As shown in Table 3, when compared with the WCST norms, subjects with autism were found to commit significantly more number of total errors, more perseverative errors, nonperseverative errors, and gave more perseverative responses.
Table 3.
Neuropsychological profile of patient
Positron emission tomography scan findings
Out of ten subjects with autism who underwent PET scan, six had normal PET scan, and four patients had abnormal PET scan. In contrast, none of the patients in the control group had abnormal PET scan [Figure 1]. Of the four patients who had abnormal PET scan, two patients had findings suggestive of hypometabolism in cerebellum bilaterally [Figures 2 and 3] and one patient showed bilateral hypometabolism in anterior temporal cortices and cerebellum [Figure 4] and another patient had hypermetabolism in the bilateral frontal cortices and medial occipital cortices [Figure 5].
Figure 1.
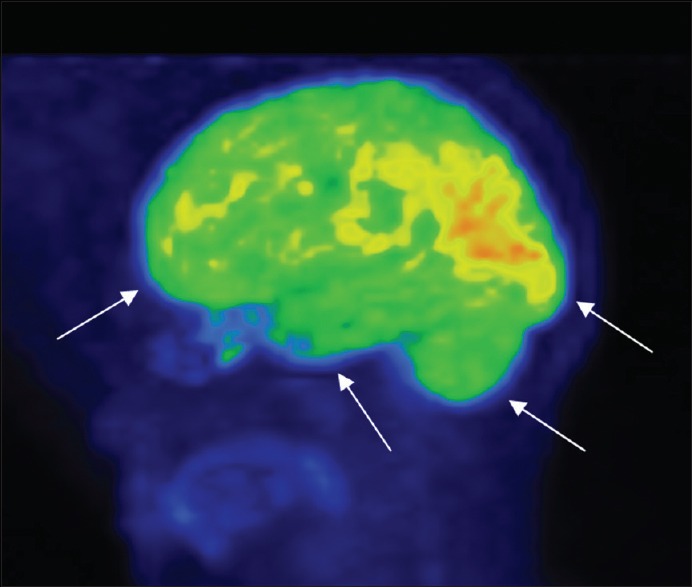
Control with normal frontal, temporal, occipital lobe, and cerebellum
Figure 2.
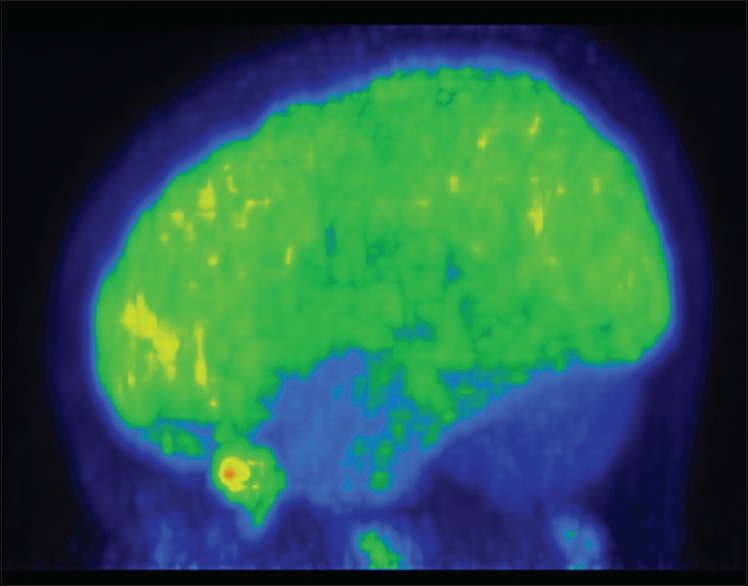
Hypometabolism in bilateral cerebellum
Figure 3.
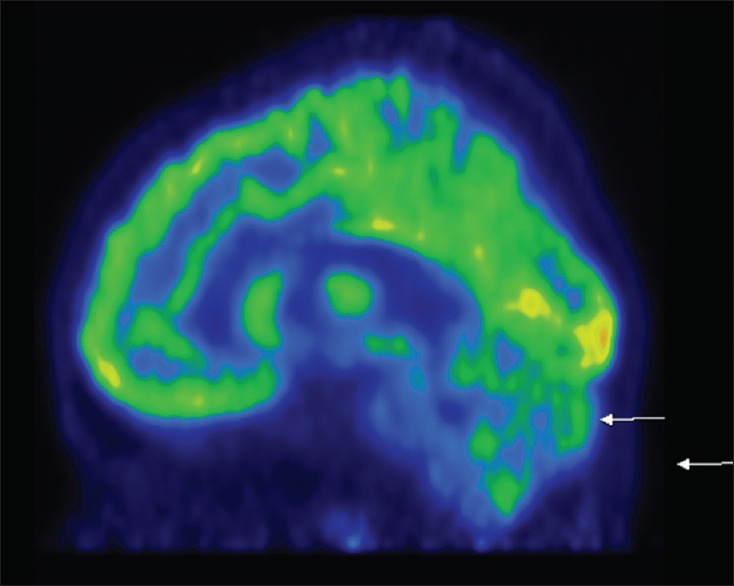
Hypometabolism in bilateral cerebellum
Figure 4.
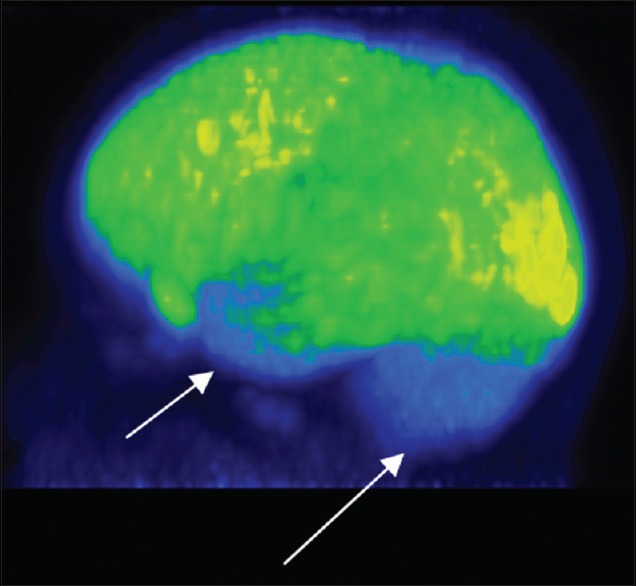
Hypometabolism in bilateral anterior temporal cortices and cerebellum
Figure 5.
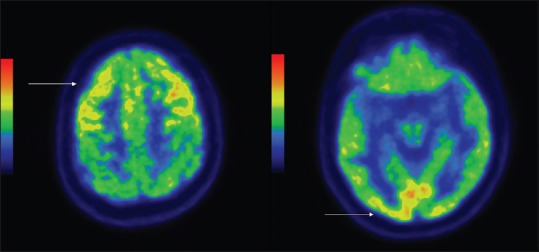
Hypermetabolism in bilateral frontal cortices and bilateral medial occipital cortices
Relationship of positron emission tomography scan findings with sociodemographic and clinical variables and neuropsychological functions
Autism subjects with and without PET abnormality did not differ significantly on age, age at onset, duration of illness, duration of treatment, and history of hospitalization. In terms of severity of autism as assessed by CARS, patients with abnormal PET scan had significantly higher scores on the “body use” domain (t-test value: −2.78; P = 0.024) indicating higher abnormal behavior (in the form of clumsiness, repetitive movements, poor coordination, and strange finger/body movements such as rocking, spinning, and finger-wiggling) and lower scores on the “fear and nervousness” domain (t-test value −2.65; P = 0.029) indicating lower severity of this symptom. No significant difference was noted between those with and without abnormal PET scan in terms of various neuropsychological tests.
DISCUSSION
Autism is a neurodevelopmental disorder with heterogeneous clinical manifestations. The core symptom domains which are predominantly affected in autism-like reciprocal social interaction, verbal and nonverbal communication, and intellectual functions are considered to be under the influence of complex neural structure. Patients with autism in the present study presented with all the core symptoms typical of autism, but only four out of ten have shown metabolic abnormalities in the brain on PET scan in the form of hypometabolism in bilateral cerebellum, bilateral anterior temporal cortices, and hypermetabolism in bilateral frontal cortices and bilateral medial occipital cortices. In contrast, none of the patients in the control group had abnormal PET scan.
Dysfunction in cerebellum in subjects has been the most consistently observed site of pathology in postmortem studies, with cerebellar abnormalities reported in 95% of cases. The most frequent finding was a reduction in number of Purkinje neurons[10,11,12] which is also found in diffusion MRI tractography.[13] Structural neuroimaging studies also suggest abnormalities in the cerebellum in subjects with autism.[14,15,16,17] However, the previous functional imaging studies which have studied autism subjects at rest using PET and SPECT failed to reveal any abnormalities in the cerebellum.[18,19,20,21,22,23,24,25,26,27,28] Functional neuroimaging studies during activation paradigms such as simple motor task, attention tasks also revealed cerebellar abnormalities.[29] Subjects with autism have emotional and cognitive function deficits and studies have shown that cerebellum is involved in emotional and cognitive functions.[30,31] The newly-emerging existence of cerebellar sensorimotor and cognitive subregions provides a new framework for interpreting the functional significance of cerebellar findings in autism. Whole-brain voxel-based morphometry analyses revealed reduced gray matter in autism children in cerebellar lobule VII (Crus I/II). The degree of regional and lobular gray matter reductions in different cerebellar subregions correlated with the severity of symptoms in social interaction, communication, and repetitive behaviors.[32,33]
Hence, findings of the present study provide credence to this association.
PET and SPECT studies which have used high-resolution functional imaging and whole brain voxel-based morphometry analysis have reported bilateral temporal hypoperfusion in children with autism.[21,23] Specifically, hypoperfusion at rest was found centered in the superior temporal sulcus and superior temporal gyrus. Zilbovicius et al.[21] performed an individual analysis of their data comparing each autistic child to the control group. They detected individually a significant temporal hypoperfusion in 16 of the 21 autistic children (77%). This finding was later replicated in three independent groups of autistic children and represents the first robust evidence for temporal lobe dysfunction in school-aged children with autism.[21,23,24] In the present study too, one subject had hypometabolism in anterior temporal cortices. However, the percentage of subjects with this abnormality is much less than that reported by Zilbovicius et al.[21] These differences could be due to the method of analysis, for example, an individual analysis of data comparing each autistic child to the control group.
Temporal lobe is thought to be central to the processing of numerous environmental signals that enter the nervous system through visual and auditory sense organs. The temporal lobe is also critical to process these signals into structured patterns of neural activity forming the experiences that bring meaning to the world around us.[34] Hence, abnormalities in the temporal region may also explain the emotional and cognitive components of autism. Other evidence suggests that superior temporal regions are critical for perception of key social stimuli and are highly connected with other parts of the “social brain” such as the fusiform gyrus and amygdala. This abnormal activation of the social brain involves areas implied in face and voice perception as well as in higher-order social tasks such as making judgments or inferences about social information. Failure to perceive social material could underlie the difficulties in extracting mental states from social material (i.e., impairment in theory of mind tasks), which suggests that social communication impairment in autism could be based on abnormal perceptual processing of socially relevant information.[35,36]
In the present study, one subject had hypermetabolism in the bilateral frontal cortices. Evidence from behavioral, imaging, and postmortem studies indicates that the frontal lobe as well as other brain regions such as the cerebellum and limbic system develops abnormally in children with autism. A study has shown regional variation in the degree of frontocortical overgrowth with a possible bias toward later developing or association areas.[37] Zilbovicius et al.[38] in their SPECT scan study done on autistic subjects at rest has shown frontal transitory hypoperfusion in 2–4 years of age which normalizes by 6–7 years indicating delayed frontal maturation which is consistent with cognitive performance of autistic children. Hypermetabolism in bilateral frontal cortices in the one subject in the present study might indicate the overworking brain to deal with increased exposure to environmental stimuli as the age of the child advances.
The occipital lobe is known to be involved in visual functions and “social appraisal” along with other neural systems such as amygdala and PFC. Only one SPECT scan study done on autistic subjects at rest has shown temporooccipital hypoperfusion along with frontal, temporal, and frontotemporal hyperfusion.[39] One subject in the present study showed hypermetabolism in bilateral medial occipital cortices. As studies have not specifically looked for occipital lobe dysfunctions in autism and its role in social cognition is also diffuse, attributing specific significance to the finding in one study subject is difficult.
However, the interesting observation that can be made by studying the overall PET scan findings in the present study is the heterogeneity in findings, i.e., different regions of the brain are involved. All the autistic subjects in the study group share core deficits of autism. Five of them had mild-moderate and remaining five had severe autistic symptoms as assessed by CARS. There was no correlation found between severity of autism and PET scan abnormality. Whether the clinical heterogeneity accounts for this variation in neuroimaging findings is unclear. Repeating the history, consistent finding of the current study (hypometabolism in cerebellum) is not same as the similar kind of studies done in the West. Hence, there is a need to look for this gross inconsistency in findings across the culture - any difference in the clinical manifestation of the same disease, role of interventions, or whether brain behaves differently in different cultures.
Subjects with abnormal PET scan findings (which is mostly abnormal cerebellar functioning) had significantly higher scores on the “body use” domain of CARS indicating higher abnormal behavior in the form of clumsiness, repetitive movements, poor coordination, and strange finger/body movements such as rocking, spinning, and finger-wiggling. MRI brain study has shown that measures of rates of stereotyped behavior were significantly negatively correlated with the area measures of cerebellar vermis lobules VI–VII.[40] Several theories have described the fundamental role of the cerebellum as anticipatory or predictive, learning, and its role in the coordination of movements.[41,42,43] This finding suggests that severe abnormal body use in patients with bilateral cerebellar hypometabolism in our study in terms of restricted, repetitive and uncoordinated movements might have emerged from attempts to adapt to such unpredictable situations by reducing the environment to something more predictable, for in a world where the ability to prepare for change is impaired, repetition may be particularly reinforcing, and another hypothesis-damaged cerebellum reduces behavioural inhibition which increases perseverative or decreases goal-directed behavior.[44] Disturbed metabolism in temporal, frontal, and occipital cortex reflects the complex nature of abnormal brain functioning in ASD which accounts for its clinical heterogeneity. The absence of any correlation between poor performance on neurocognitive functioning and abnormal PET scan findings suggests that there is no one to one connection between neurocognitive deficits and particular part of brain.
The results of the present study must be considered in the light of some methodological limitations. The study has been done at rest which is less sensitive in picking abnormalities than conducting study during activation paradigm and it includes small sample size. The study limited to the subjects aged 8–19 years and its impact on findings is unclear considering differential brain development across ages. Future studies should attempt to overcome the limitations of the current study. Studies with larger sample size comprising patients from different treatment settings would be needed. There is need to focus on functional neuroimaging studies with activation paradigms which are more sensitive than studies at rest. There is need for longitudinal studies, i.e. neuroimaging at different phases of life which may provide a developmental pattern of the brain in patients with autism.
CONCLUSION
The present study suggests that patients with ASD have hypometabolism in the bilateral cerebellum, hypometabolism in the anterior temporal cortices, and hypermetabolism in the bilateral frontal cortices and medial occipital cortices.
Financial support and sponsorship
Nil.
Conflicts of interest
There are no conflicts of interest.
REFERENCES
- 1.Baird G, Simonoff E, Pickles A, Chandler S, Loucas T, Meldrum D, et al. Prevalence of disorders of the autism spectrum in a population cohort of children in South Thames: The special needs and autism project (SNAP) Lancet. 2006;368:210–5. doi: 10.1016/S0140-6736(06)69041-7. [DOI] [PubMed] [Google Scholar]
- 2.Kanner L. Autistic disturbances of affective contact. Nerv Child. 1943;2:217–50. [PubMed] [Google Scholar]
- 3.Hughes C, Russell J, Robbins TW. Evidence for executive dysfunction in autism. Neuropsychologia. 1994;32:477–92. doi: 10.1016/0028-3932(94)90092-2. [DOI] [PubMed] [Google Scholar]
- 4.American Psychiatric Association. Diagnostic and Statistical Manual of Mental Disorders, Fourth Edition. (DSM-IV-TR) Washington, DC: American Psychiatric Association; 2000. [Google Scholar]
- 5.Schopler E, Reichler R, Renner BR. The Childhood Autism Rating Scale. Los Angeles, CA: Western Psychological Services; 1988. [Google Scholar]
- 6.Harding TW, Climent CE, Diop M, Giel R, Ibrahim HH, Murthy RS, et al. The WHO collaborative study on strategies for extending mental health care, II: The development of new research methods. Am J Psychiatry. 1983;140:1474–80. doi: 10.1176/ajp.140.11.1474. [DOI] [PubMed] [Google Scholar]
- 7.Army Individual Test Battery. Manual of Directions and Scoring. Washington, DC: War Department, Adjutant General's Office; 1944. [Google Scholar]
- 8.Raven J, Raven JC, Court JH. Manual for Raven's Progressive Matrices and Vocabulary Scales. Oxford: Oxford Psychologists Press; 1998. [Google Scholar]
- 9.Heaton RK, Chelune GJ, Talley JL, Kay GG, Curtiss G. Wisconsin Card Sorting Test Manual. Odessa, Florida: Psychological Assessment Resources, Inc; 1993. [Google Scholar]
- 10.Kemper TL, Bauman M. Neuropathology of infantile autism. J Neuropathol Exp Neurol. 1998;57:645–52. doi: 10.1097/00005072-199807000-00001. [DOI] [PubMed] [Google Scholar]
- 11.Lee M, Martin-Ruiz C, Graham A, Court J, Jaros E, Perry R, et al. Nicotinic receptor abnormalities in the cerebellar cortex in autism. Brain. 2002;125(Pt 7):1483–95. doi: 10.1093/brain/awf160. [DOI] [PubMed] [Google Scholar]
- 12.Vargas DL, Nascimbene C, Krishnan C, Zimmerman AW, Pardo CA. Neuroglial activation and neuroinflammation in the brain of patients with autism. Ann Neurol. 2005;57:67–81. doi: 10.1002/ana.20315. [DOI] [PubMed] [Google Scholar]
- 13.Jeong JW, Tiwari VN, Behen ME, Chugani HT, Chugani DC. In vivo detection of reduced Purkinje cell fibers with diffusion MRI tractography in children with autistic spectrum disorders. Front Hum Neurosci. 2014;8:110. doi: 10.3389/fnhum.2014.00110. [DOI] [PMC free article] [PubMed] [Google Scholar]
- 14.Courchesne E, Yeung-Courchesne R, Press GA, Hesselink JR, Jernigan TL. Hypoplasia of cerebellar vermal lobules VI and VII in autism. N Engl J Med. 1988;318:1349–54. doi: 10.1056/NEJM198805263182102. [DOI] [PubMed] [Google Scholar]
- 15.Carper RA, Courchesne E. Inverse correlation between frontal lobe and cerebellum sizes in children with autism. Brain. 2000;123(Pt 4):836–44. doi: 10.1093/brain/123.4.836. [DOI] [PubMed] [Google Scholar]
- 16.Hashimoto T, Tayama M, Murakawa K, Yoshimoto T, Miyazaki M, Harada M, et al. Development of the brainstem and cerebellum in autistic patients. J Autism Dev Disord. 1995;25:1–18. doi: 10.1007/BF02178163. [DOI] [PubMed] [Google Scholar]
- 17.Kaufmann WE, Cooper KL, Mostofsky SH, Capone GT, Kates WR, Newschaffer CJ, et al. Specificity of cerebellar vermian abnormalities in autism: A quantitative magnetic resonance imaging study. J Child Neurol. 2003;18:463–70. doi: 10.1177/08830738030180070501. [DOI] [PubMed] [Google Scholar]
- 18.Horwitz B, Rumsey JM, Grady CL, Rapoport SI. The cerebral metabolic landscape in autism. Intercorrelations of regional glucose utilization. Arch Neurol. 1988;45:749–55. doi: 10.1001/archneur.1988.00520310055018. [DOI] [PubMed] [Google Scholar]
- 19.Herold S, Frackowiak RS, Le Couteur A, Rutter M, Howlin P. Cerebral blood flow and metabolism of oxygen and glucose in young autistic adults. Psychol Med. 1988;18:823–31. doi: 10.1017/s0033291700009752. [DOI] [PubMed] [Google Scholar]
- 20.Zilbovicius M, Garreau B, Tzourio N, Mazoyer B, Bruck B, Martinot JL, et al. Regional cerebral blood flow in childhood autism: A SPECT study. Am J Psychiatry. 1992;149:924–30. doi: 10.1176/ajp.149.7.924. [DOI] [PubMed] [Google Scholar]
- 21.Zilbovicius M, Boddaert N, Belin P, Poline JB, Remy P, Mangin JF, et al. Temporal lobe dysfunction in childhood autism: A PET study. Positron emission tomography. Am J Psychiatry. 2000;157:1988–93. doi: 10.1176/appi.ajp.157.12.1988. [DOI] [PubMed] [Google Scholar]
- 22.Anagnostou E, Taylor MJ. Review of neuroimaging in autism spectrum disorders: What have we learned and where we go from here. Mol Autism. 2011;2:4. doi: 10.1186/2040-2392-2-4. [DOI] [PMC free article] [PubMed] [Google Scholar]
- 23.Ohnishi T, Matsuda H, Hashimoto T, Kunihiro T, Nishikawa M, Uema T, et al. Abnormal regional cerebral blood flow in childhood autism. Brain. 2000;123(Pt 9):1838–44. doi: 10.1093/brain/123.9.1838. [DOI] [PubMed] [Google Scholar]
- 24.Carina Gillberg I, Bjure J, Uvebrant P, Vestergren E, Gillberg C. SPECT (single photon emission computed tomography) in 31 children and adolescents with autism and autistic-like conditions. Eur Child Adolesc Psychiatry. 1993;2:50–9. doi: 10.1007/BF02098830. [DOI] [PubMed] [Google Scholar]
- 25.Rumsey JM, Duara R, Grady C, Rapoport JL, Margolin RA, Rapoport SI, et al. Brain metabolism in autism. Resting cerebral glucose utilization rates as measured with positron emission tomography. Arch Gen Psychiatry. 1985;42:448–55. doi: 10.1001/archpsyc.1985.01790280026003. [DOI] [PubMed] [Google Scholar]
- 26.De Volder A, Bol A, Michel C, Congneau M, Goffinet AM. Brain glucose metabolism in children with the autistic syndrome: Positron tomography analysis. Brain Dev. 1987;9:581–7. doi: 10.1016/s0387-7604(87)80089-x. [DOI] [PubMed] [Google Scholar]
- 27.Chiron C, Leboyer M, Leon F, Jambaqué I, Nuttin C, Syrota A. SPECT of the brain in childhood autism: Evidence for a lack of normal hemispheric asymmetry. Dev Med Child Neurol. 1995;37:849–60. doi: 10.1111/j.1469-8749.1995.tb11938.x. [DOI] [PubMed] [Google Scholar]
- 28.Mountz JM, Tolbert LC, Lill DW, Katholi CR, Liu HG. Functional deficits in autistic disorder: Characterization by technetium-99m-HMPAO and SPECT. J Nucl Med. 1995;36:1156–62. [PubMed] [Google Scholar]
- 29.Allen G, Courchesne E. Differential effects of developmental cerebellar abnormality on cognitive and motor functions in the cerebellum: An fMRI study of autism. Am J Psychiatry. 2003;160:262–73. doi: 10.1176/appi.ajp.160.2.262. [DOI] [PubMed] [Google Scholar]
- 30.Schmahmann JD, Sherman JC. Cerebellar cognitive affective syndrome. Int Rev Neurobiol. 1997;41:433–40. doi: 10.1016/s0074-7742(08)60363-3. [DOI] [PubMed] [Google Scholar]
- 31.Middleton FA, Strick PL. Basal ganglia and cerebellar loops: Motor and cognitive circuits. Brain Res Brain Res Rev. 2000;31:236–50. doi: 10.1016/s0165-0173(99)00040-5. [DOI] [PubMed] [Google Scholar]
- 32.Becker EB, Stoodley CJ. Autism spectrum disorder and the cerebellum. Int Rev Neurobiol. 2013;113:1–34. doi: 10.1016/B978-0-12-418700-9.00001-0. [DOI] [PubMed] [Google Scholar]
- 33.D’Mello AM, Crocetti D, Mostofsky SH, Stoodley CJ. Cerebellar gray matter and lobular volumes correlate with core autism symptoms. Neuroimage Clin. 2015;7:631–9. doi: 10.1016/j.nicl.2015.02.007. [DOI] [PMC free article] [PubMed] [Google Scholar]
- 34.Gloor P. The Temporal Lobe and Limbic System. New York: Oxford; 1997. [Google Scholar]
- 35.Baron-Cohen S, Ring HA, Wheelwright S, Bullmore ET, Brammer MJ, Simmons A, et al. Social intelligence in the normal and autistic brain: An fMRI study. Eur J Neurosci. 1999;11:1891–8. doi: 10.1046/j.1460-9568.1999.00621.x. [DOI] [PubMed] [Google Scholar]
- 36.Hadjikhani N, Joseph RM, Snyder J, Chabris CF, Clark J, Steele S, et al. Activation of the fusiform gyrus when individuals with autism spectrum disorder view faces. Neuroimage. 2004;22:1141–50. doi: 10.1016/j.neuroimage.2004.03.025. [DOI] [PubMed] [Google Scholar]
- 37.Carper RA, Courchesne E. Localized enlargement of the frontal cortex in early autism. Biol Psychiatry. 2005;57:126–33. doi: 10.1016/j.biopsych.2004.11.005. [DOI] [PubMed] [Google Scholar]
- 38.Zilbovicius M, Garreau B, Samson Y, Remy P, Barthélémy C, Syrota A, et al. Delayed maturation of the frontal cortex in childhood autism. Am J Psychiatry. 1995;152:248–52. doi: 10.1176/ajp.152.2.248. [DOI] [PubMed] [Google Scholar]
- 39.Kaya M, Karasalihoglu S, Ustün F, Gültekin A, Cermik TF, Fazlioglu Y, et al. The relationship between 99mTc-HMPAO brain SPECT and the scores of real life rating scale in autistic children. Brain Dev. 2002;24:77–81. doi: 10.1016/s0387-7604(02)00006-2. [DOI] [PubMed] [Google Scholar]
- 40.Pierce K, Courchesne E. Evidence for a cerebellar role in reduced exploration and stereotyped behavior in autism. Biol Psychiatry. 2001;49:655–64. doi: 10.1016/s0006-3223(00)01008-8. [DOI] [PubMed] [Google Scholar]
- 41.Coenen OJ, Arnold MP, Sejowski TJ, Jabri MA. Parallel fibre coding in the cerebellum for life long learning. Auton Robots. 2001;11:291–7. [Google Scholar]
- 42.Nixon PD. The role of the cerebellum in preparing responses to predictable sensory events. Cerebellum. 2003;2:114–22. doi: 10.1080/14734220309410. [DOI] [PubMed] [Google Scholar]
- 43.Courchesne E, Allen G. Prediction and preparation, fundamental functions of the cerebellum. Learn Mem. 1997;4:1–35. doi: 10.1101/lm.4.1.1. [DOI] [PubMed] [Google Scholar]
- 44.Lalonde R, Manseau M, Botez MI. Exploration and habituation in Purkinje cell degeneration mutant mice. Brain Res. 1989;479:201–3. doi: 10.1016/0006-8993(89)91354-1. [DOI] [PubMed] [Google Scholar]


