

Abstract
In silico docking studies and quantitative structure–activity relationship analysis of a number of in-house cytochrome P450 inhibitors have revealed important structural characteristics that are required for a molecule to function as a good inhibitor of P450 enzymes 1A1, 1A2, 2B1, and/or 2A6. These insights were incorporated into the design of pharmacophores used for a 2D search of the Chinese medicine database. Emodin, a natural anthraquinone isolated from Rheum emodi and known to be metabolized by cytochrome P450 enzymes, was one of the hits and was used as the lead compound. Emodin was found to inhibit P450s 1A1, 1A2, and 2B1 with IC50 values of 12.25, 3.73, and 14.89 μM, respectively. On the basis of the emodin molecular structure, further similarity searches of the PubChem and ZINC chemical databases were conducted resulting in the identification of 12 emodin analogues for testing against P450s 1A1-, 1A2-, 2B1-, and 2A6-dependent activities. 1-Amino-4-chloro-2-methylan-thracene-9,10-dione (compound 1) showed the best inhibition potency for P450 1A1 with an IC50 value of 0.40 μM. 1-Amino-4-chloro-2-methylanthracene-9,10-dione (compound 1) and 1-amino-4-hydroxyanthracene-9,10-dione (compound 2) both inhibited P450 1A2 with the same IC50 value of 0.53 μM. In addition, compound 1 acted as a mechanism-based inhibitor of cytochrome P450s 1A1 and 1A2 with KI and Kinactivation values of 5.38 μM and 1.57 min−1 for P450 1A1 and 0.50 μM and 0.08 min−1 for P450 1A2. 2,6-Di-tert-butyl-5-hydroxynaphthalene-1,4-dione (compound 8) directly inhibited P450 2B1 with good selectivity and inhibition potency (IC50 = 5.66 μM). Docking studies using the 3D structures of the enzymes were carried out on all of the compounds. The binding modes of these compounds revealed the structural characteristics responsible for their potency and selectivity. Compound 1, which is structurally similar to compound 2 in the presence of an amino group at position 1, showed a difference in the mechanism of inhibition toward P450s 1A1 and 1A2. The mechanism-based inhibition seen for compound 1 may be attributed to the presence of the methyl group at the 2-position, in close proximity to the amino group. Compound 2, which is otherwise similar, lacks that methyl moiety and did not show mechanism-based inhibition.
Graphical abstract
INTRODUCTION
Cytochrome P450 (P450) enzymes are hemoprotein monooxygenases that metabolize a wide variety of endogenous and exogenous substances through oxidation. P450 enzymes are involved in the metabolism of many procarcinogens, carcinogens, and pharmaceuticals such as polycyclic aromatic hydrocarbons (PAHs), arylamines, heterocyclic amines, sterols, fatty acids, vitamins, and steroids.1,2 P450s are expressed in many tissues including liver, kidney, and lung. Some of the P450 enzymes belonging to P450 families 1, 2, and 3 are found in both healthy and cancerous extrahepatic tissues,3–8 while others, such as P4501B1 and P4502W1, are mainly expressed in tumors.6,7,9–13 The role of P450s in bioactivation, tumor formation, and development makes them an attractive target for cancer prevention and treatment.
Over the years, a number of small molecules belonging to various chemical families including the PAHs (pyrenes, anthracenes, phenanthrenes, and naphthalenes), flavones, naphthoflavones, coumarins, and adamantanes have been developed in our laboratory and evaluated for their inhibition of P450s 1A1, 1A2, 1B1, 2A6, 2B1, 2B4, and 2B6.14–20 Many of these compounds were found to be mechanism-based inhibitors.15,16,20,21 To better understand the factors contributing to the potency and specificity of the wide array of the P450 inhibitors, an in-house database of compounds was used in docking22 and QSAR (quantitative structure–activity relationship) studies,23 leading to a number of important insights. The proximity of the triple bond in our acetylenic compounds to the heme-Fe shows a high impact on the potency of the inhibitors toward P450s 1A1 and 2B1, while the π–π interactions between the ligand’s aromatic ring(s) and the aromatic residues of the protein are the major contributor to the potency of inhibition toward P450 1A2. Furthermore, planar compounds with multiring systems and extended conjugation are favorable inhibitors of P450s 1A1 and 1A2. P450 2B1 has a small binding site with many hydrophobic residues and two phenylalanine residues for π–π interaction. Taking these observations into consideration, ligand-based pharmacophores were built and used for the UNITY database search of the Chinese medicine database. Emodin was one of the hit compounds obtained from this database search.
Emodin is an anthraquinone known to be metabolized by the P450s 1A1 and 1A2 to 2-hydroxyemodin.24 Emodin inhibits P450 1A1 with an antimutagenic effect.25 Indirect mutagens such as heterocyclic amines and benzo[a]pyrenes require oxidative metabolic activation to produce the mutagenic species that attack the DNA nucleophilic groups. Inhibition of such metabolic activations of the indirect mutagens is one of the observed effects of antimutagenic compounds. Emodin has been shown to induce the expression of P450s 1A1 and 1B1 in human lung adenocarcinoma CL5 cells.4 As a protein kinase inhibitor, emodin suppresses the growth and transformation of several human tumors, including those of the liver and lung.26–30 Especially, it has been reported that emodin sensitized cancer cells toward certain chemotherapeutic agents.29,31 These and other biological effects of emodin prompted us to look into anthraquinones as potential P450 inhibitors. The structural features of emodin were used in search for similar compounds in the PubChem and ZINC chemical databases. Commercially available compounds from this search were purchased and screened in a docking study leading to a short list of 12 promising compounds (Figure 1). Emodin and the 12 analogues were assayed for their inhibition of the P450 1A1-, 1A2-, 2B1-, and 2A6-dependent activities.
Figure 1.
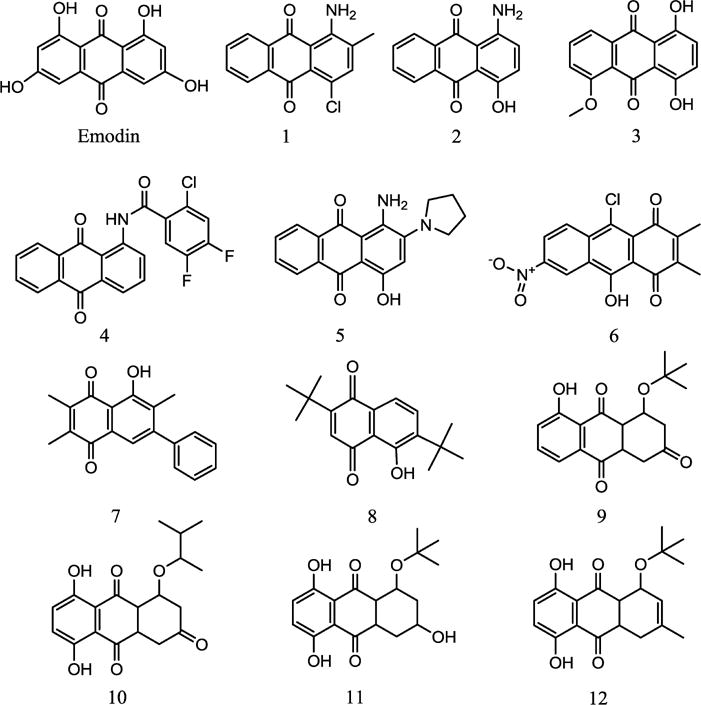
Structures of emodin and compounds 1–12 investigated.
MATERIALS AND METHODS
Emodin was obtained from Calbiochem/EMD Biosciences (Gibbstown, NJ). The 12 analogues were purchased from Specs Chemical Services (Wakefield, RI). Compounds 9–11 have multiple stereocenters but were only commercially available as mixtures of stereoisomers and were used as such in the assays. The source laboratory prepared these compounds using the Diels–Alder reaction of 1-alkoxy-3-trimethylsilyloxy buta-1,3-diene with the appropriate naphthoquinone.
Assays
Rat P4502B1 supersomes (rat P4502B1 + P450 reductase + cytochrome b5) and human P450 1A1, 1A2, and 2A6 supersomes (human P450 enzymes + P450 reductase) were purchased from B.D. Biosciences Corporation (Woburn, MA). All other chemicals were purchased from Sigma-Aldrich Company (Milwaukee, WI).
EROD (7-ethoxyresorufin O-deethylation), MROD (7-methoxyresorufin O-demethylation), and PROD (7-pentoxyresorufin O-depentylation) were used to minitor P450s 1A1-, 1A2-, and 2B1-dependent activities, respectively.32 Alkoxy resorufins are dealkylated by P450 enzymes to form resorufin, which can be detected using the fluorimetric assay. P450s 1A1 and 1A2 exhibit different substrate specificities with resorufin substrates. The residue Val 382 in P450 1A1 may play an important role in the binding and dealkylation of these substrates. Mutation of L382 V in P450 1A2 alters the levels of specificity for EROD and MROD.33 P450 2A6-dependent 7-hydroxylation of coumarin was used in a similar assay with minor differences as described below for measuring 2A6 activity.34,35
EROD, MROD, PROD, and Coumarin 7-Hydroxylation Assays
Potassium phosphate buffer (1750 μL of a 0.1 M solution, pH 7.6) was placed in a 1.0 cm quartz cuvette, and 10 μL of a 1.0 M MgCl2 solution, 15 μL of a 0.67 mM corresponding resorufin or coumarin substrate solution (5 μM final concentration of the substrate in the assay solution) in (CH3)2SO (DMSO), 10 μL of the microsomal P450 protein (5.0 nmol/L final concentration of the P450 protein in the assay solution), and 15 μL of an inhibitor solution in DMSO (varying concentrations of the inhibitor causing a 20–80% loss of activity) were used. For each inhibitor, at least four concentrations in this range were studied) were added. For the controls, 15 μL of pure DMSO was added in place of the inhibitor solution. The reaction was initiated by the addition of 200 μL of a NADPH-regenerating solution. The regenerating solution was prepared by combining 797 μL of a 0.10 M potassium phosphate buffer solution (pH 7.6), 67 μL of a 15 mM NADP+ solution in buffer, 67 μL of a 67.5 mM glucose-6-phosphate solution in buffer, and 67 μL of a 45 mM MgCl2 solution and incubating the mixture for 5 min at 37 °C before the addition of 3 units of glucose 6-phosphate dehydrogenase/mL and a final 5 min incubation at 37 °C. The final assay volume was 2.0 mL. The production of 7-hydroxyresorufin anion was monitored by a spectrofluorimeter (OLIS DM 45 Spectrofluorimetry System) at 535 nm excitation and 585 nm emission, with a slit width of 2 nm. The production of 7-hydroxycoumarin was monitored at 338 nm excitation and 458 nm emission, with a slit width of 2 nm. The reactions were performed at 37 °C. For each inhibitor, a number of assay runs were performed using varying inhibitor concentrations.
Data Analysis36
The data obtained from these assays were analyzed by a computer analysis method of the reaction progress curve in the presence of various inhibitor concentrations and in the absence of the inhibitor as the control run. Results are tabulated in Tables 1 and 2. A second-order curve describing product formation with respect to the reaction time in seconds was obtained for each inhibitor concentration and the control. The Microsoft Excel Program was used to fit the data (fluorescence intensity vs time) obtaining the parameters of the best-fit second-order curves (y = ax2 + bx + c). Using the parameters (coefficient b in the second-order equation is enzymatic activity) obtained from the above, activities were calculated using first-order derivatives. Dixon plots were used {by plotting the reciprocals of the enzymatic activity (1/ν) vs inhibitor concentrations [I]} to determine IC50 values (x-intercepts) for the inhibitors.
Table 1.
Inhibition Data in Supersomes for Emodin and Compounds 1–12 Measured Using Human P450 Enzymes (1A1, 1A2, and 2A6) and Rat P450 Enzyme (2B1)
| compds | IC50 (μM)
|
|||
|---|---|---|---|---|
| P450 1A1 | P450 1A2 | P450 2B1 | P450 2A6 | |
| emodin | 12.25 | 3.73 | 14.89 | >50 |
| 1 | 0.40 | 0.53 | >50 | >50 |
| 2 | 2.09 | 0.53 | 2.15 | >50 |
| 3 | 11.21 | 1.59 | >50 | >50 |
| 4 | ∼47.33 | >50 | >50 | >50 |
| 5 | 5.20 | 2.49 | >50 | >50 |
| 6 | 12.53 | >50 | >50 | >50 |
| 7 | 15.78 | 29.56 | >50 | >50 |
| 8 | >50 | >50 | 5.66 | >50 |
| 9 | 4.47 | 1.95 | 3.87 | >5.0 |
| 10 | 0.89 | 1.62 | 20.80 | >50 |
| 11 | 2.84 | 1.99 | 14.35 | >50 |
| 12 | 18.52 | 9.50 | 2.50 | >50 |
Table 2.
Mechanism-Based Inhibition of Human P450 Enzymes 1A1 and 1A2 by Compound 1
| compd | P450 1A1
|
P450 1A2
|
||
|---|---|---|---|---|
| KI (μM) | Kinactivation (min−1) | KI (μM) | Kinactivation (min−1) | |
| 1 | 5.38 | 1.57 | 0.50 | 0.08 |
Preincubation Assays in the Presence and Absence of NADPH
To confirm mechanism-based inhibition, preincubation assays were performed as follows. All assay solution components had the same concentrations as in the above assays. For preincubation assays in the presence of NADPH, potassium phosphate buffer (1550 μL of a 0.1 M solution, pH 7.6) was placed in a 1.0 cm quartz cuvette followed by 10 μL of a 1.0 M MgCl2 solution, 10 μL of the microsomal P450 protein, 15 μL of an inhibitor in DMSO (for the control, 15 μL of pure DMSO was added in the place of the inhibitor solution), and 200 μL of a NADPH regenerating solution. The assay mixture was incubated for 5 min at 37 °C, before reaction initiation by the addition of 200 μL of buffer and 15 μL of the corresponding substrate solution. The final assay volume was 2.0 mL. The production of 7-hydroxyresorufin anion was monitored at 535 nm excitation and 585 nm emission. The production of 7-hydroxycoumarin was monitored at 338 nm excitation and 458 nm emission. The reactions were performed at 37 °C. For each inhibitor, a number of assay runs were performed using varying inhibitor concentrations. For the preincubation assays in the absence of NADPH, potassium phosphate buffer (1750 μL of a 0.1 M solution, pH 7.6) was placed in a 1.0 cm quartz cuvette followed by 10 μL of a 1.0 M MgCl2 solution, 10 μL of the microsomal P450 protein, and 15 μL of an inhibitor in DMSO (for the control, 15 μL of pure DMSO was added in the place of the inhibitor solution). The assay mixture was incubated for 5 min at 37 °C, before reaction initiation by the addition of 200 μL of the NADPH-regenerating solution and 15 μL of the corresponding substrate solution. The final assay volume was 2.0 mL. The production of P450-dependent reaction products was monitored as previously described.37 The reactions were performed at 37 °C. For each inhibitor, a number of assay runs were performed using varying inhibitor concentrations.
Protein Crystal Structures and Homology Modeling of P450s 1A1 and 2B1
All of our in silico studies were carried out using the Molecular Operating Environment (MOE) Program (Chemical Computing Group, Montreal, Canada). The coordinates of the templates for P450 enzymes 1A2 (PDB ID: 2HI4) and 2A6 (PDB ID: 1Z10) were taken from the Protein Data Bank (http://www.rcsb.org). Oxygen atoms representing water were removed, and hydrogen atoms were added to the templates using the Amber99 force field. The homology models for P450s 1A1 and 2B1 built for our earlier docking studies22 were used in the present study. Commercially available compounds 9–12 (comprised of mixtures of stereoisomers) did not show high inhibition potency or selectivity in the assays and were not used for the docking studies.
Binding Modes by Docking Simulations
The structures of the 13 molecules used in this study are presented in Figure 1. The 3D structures of emodin and compounds 1–8 were built using the Tripos SYBYLX1.2 Program. Initial geometric optimizations of the ligands were carried out using the standard MMFF94 force field, with a 0.001 kcal/mol energy gradient convergence criterion and a distance-dependent dielectric constant employing Gasteiger and Marsili charges. Additional geometric optimizations were performed using the semiempirical method Molecular Orbital Package (MOPAC). The compounds were docked into the binding pockets of P450 enzymes using two programs, MOE and Surflex (Tripos). The consensus binding postures of the inhibitors were obtained by visual inspection of the docking simulations and their docking scores. The docked complexes were then minimized in three steps using the MOE Energy Minimize application. Amber ff99 was used for standard residues of the protein, and partial charges were calculated as required for this force field. The nonstandard forcefield parameters for the heme and the cysteine–iron bond were taken from the literature.38 MOE energy minimization consists of finding a set of atomic coordinates that correspond to a local minimum of the molecular energy function (we used the potential energy model) by applying large-scale nonlinear optimization techniques to calculate a conformation (near to the starting geometry) for which the forces on the atoms are zero.39 MOE uses a succession of three methods to affect an energy minimization: steepest descent (SD), conjugate gradient (SG), and truncated Newton (TN) controlled by the root mean square (rms) gradient of energy falling below 0.1 kcal A−1. In addition, atoms may be fixed during the calculations. First, hydrogen atom positions were relaxed by holding other atoms fixed. This was followed by allowing all side-chain atoms to relax while holding the backbone atoms fixed. Finally, the entire structure was relaxed until the rms gradient of energy was less than 0.1 kcal A−1. Through all of the minimization steps, the planar structure of the heme residue was maintained.
RESULTS
Emodin and compounds 1–12 (Figure 1) were tested at five effective concentrations as potential inhibitors of EROD, MROD, and PROD activities in human P450s 1A1 and 1A2 and rat P4502B1 supersomes. The P450 2A6 inhibition activity of the compounds was assayed by using the P450 2A6-dependent 7-hydroxylation of coumarin using human P450 2A6 supersomes. These assays have been successfully used for determining the type and extent of inhibition of P450s 1A1, 1A2, 2B1, and 2A6.15,18,40 Two types of inhibition (direct inhibition and mechanism-based inhibition) were evaluated for the compounds in the present study. A direct inhibitor is a straightforward competitive inhibitor of the enzyme. A mechanism-based inhibitor is one that is metabolized by the enzyme into a reactive intermediate that further reacts with the enzyme to form a complex that is no longer enzymatically active. This method of inhibition is time- and cofactor-dependent.
Emodin inhibited P450s 1A1, 1A2, and 2B1 with IC50 values of 12.25, 3.73, and 14.89 μM, respectively. Emodin did not cause mechanism-based inhibition of any of the P450s studied. All of the compounds except compounds 4 and 8 showed good direct inhibition potency for P450 1A1 (Table 1). Compounds 1 and 10 showed submicromolar potency, with compound 1 exhibiting the highest potency at 0.40 μM for this enzyme. All of the compounds except 4, 8, and 10 inhibited P450 1A1 with IC50 values in the range of 2.0–18.5 μM. Compound 6 showed moderate inhibition of P450 1A1 with an IC50 value of 12.50 μM but did not inhibit P450s 1A2, 2B1, or 2A6 (IC50 > 50 μM), thereby showing selectivity. Most of the compounds except 4, 6, and 8 showed inhibition of P450 1A2 (Table 1). Compounds 1 and 2 showed the highest potency at 0.53 μM. Compounds 7 and 12 showed a moderate inhibition with IC50 values of 29.56 and 9.50 μM, respectively. Compounds 3, 5, 9, 10, and 11 exhibited good inhibition of P4501A2 with IC50 values ranging from 0.90 to 2.49 μM. Of the 13 compounds studied here, only seven compounds including emodin showed inhibition of P4502B1. Among these, compound 8 specifically inhibited P4502B1 with an IC50 value of 5.66 μM and did not inhibit P450s 1A1, 1A2, or 2A6 (Table 1). Compounds 10, 11, and emodin showed moderate inhibition of P4502B1 (14 μM < IC50 < 21 μM). Compounds 2, 8, 9, and 12 inhibited P4502B1 with IC50 values in the low micromolar range (2.15–5.66 μM). None of the compounds showed any significant inhibition of P450 2A6. Compounds 9–11, mixtures of different stereoisomers, did not show high inhibition potency toward P450s 1A1, 1A2, or 2B1. While these compounds did not show any inhibition for P450 2A6, they also did not demonstrate selectivity for any of the other P450s studied. These compounds were not investigated further in docking studies.
Compound 1 demonstrated mechanism-based inhibition of P450 enzymes 1A1 and 1A2 (Table 2). Figure 2A,B depicts the plots of the results of the NADPH dependency tests of compound 1 for these enzymes. The NADPH dependency test allows affirmation of mechanism-based inhibition versus direct inhibition of the compound. The log plots of percent enzyme activity remaining versus time for P450s 1A1 and 1A2 at different concentrations of the compound 1 are illustrated in Figure 2C,D. For P450 1A1, the rate constant for maximal inactivation at saturation (Kinactivation) was 0.57 min−1, and the concentration required to produce one-half of the maximal rate of inactivation (KI) was 5.38 μM. In the case of P4501A2, the KI and Kinactivation values were 0.50 μM and 0.08 min−1.
Figure 2.
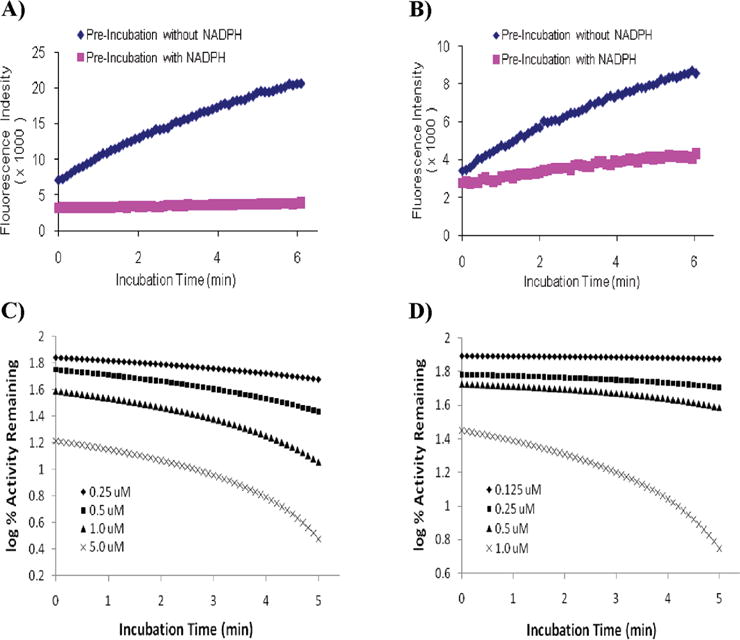
(A and B) Production of 7-hydroxy-resorufin by P450 1A1 and 1A2. The reaction resolution underwent a 5 min preincubation process in the presence (pink square) and absence (blue diamond) of NADPH. For P450 1A1, the concentration of compound 1 was 0.25 μM. For P450 1A2, the concentration of compound 1 was 0.125 μM. (C and D) Time- and concentration-dependent inhibition of P450 1A1-dependent EROD activity and P450 1A2-dependent MROD activity by compound 1. The reactions were performed at 37 °C, and the formation of 7-hydroxyresorufin anion was monitored in continuous 6 min as described in the Materials and Methods. The concentrations of compound 1 were 0.25 (⧫), 0.5 (■), 1.0 (▲), and 5.0 μM (×) in graph C and 0.125 (⧫), 0.25 (■), 0.5 (▲), and 1.0 μM (×) in graph D.
DISCUSSION
The binding sites of the P450 enzymes 1A1, 1A2, 2A6, and 2B1 contain many aromatic and hydrophobic residues, as well as some polar residues (Table 3). P450s 1A1 and 1A2 have larger binding cavities with several phenylalanine residues capable of forming π–π interactions with the bound ligands.22 The number of polar residues and hydrophobic residues in the binding cavities is comparable in these two enzymes. In P450 2A6, the binding cavity is smaller, with five phenylalanine and five hydrophobic residues and only two polar residues. The shape of the binding cavity and location of the phenylalanine residues are not favorable for the binding of fused polyaromatic ring systems. P450 2B1 has the smallest binding cavity of all of the P450 enzymes in this study with only two phenylalanine residues, two polar residues, and multiple hydrophobic residues. The position of the aromatic residues in the binding cavity allows the binding of fused aromatic ring systems with two or three rings. The presence of the large number of hydrophobic amino acid residues has a more pronounced effect on the degree and strength of ligand binding in this enzyme. Our earlier studies have indicated the importance of aromatic interactions in determining the inhibition potency for P450 1A2. Most of the PAHs previously studied exhibit π–π interactions with the phenylalanine residues of P450s 1A1, 1A2, and 2B1. The size of the binding cavity does not seem to play a significant role in the inhibition of the P450s 1A1, 1A2, 2A6, and 2B1 by the quinones and anthraquinones used in this study. The nature of the residues lining the binding cavity and the shape of the binding cavity seem to exert a far greater effect on the inhibition of these P450 enzymes by the compounds studied. The positions of polar and nonpolar substituents on the ligands determine binding efficacy and potency of inhibition.
Table 3.
Nature of the Residues in the Catalytic Site of the P450 Enzymes 1A1, 1A2, 2B1, and 2A6
| protein | volume (Å3) | residues
|
||
|---|---|---|---|---|
| aromatic | polar | hydrophobic | ||
| 1A1 | 82 | PHE123, PHE224, PHE258, PHE384 | SER116, SER120, SER122, ASN221, ASN255, ASP313, ASP320, THR321, THR385, CYS457, THR497 | ILE115, GLY225, VAL228, LEU312, GLY316, ALA317, VAL382, ILE386, LEU496 |
| 1A2 | 129 | PHE125, PHE226, PHE256, PHE260, PHE315, PHE319 | THR118, SER122, THR124, THR223, ASN312, ASP313, ASP320, THR321, THR498 | ILE117, VAL220, VAL227, GLY316, ALA317, LEU382, ILE386, LEU497 |
| 2A6 | 64 | PHE107, PHE111, PHE118, PHE209, PHE480 | ASN297, THR305 | VAL117, ILE300, GLY301, ILE366, LEU370 |
| 2B1 | 41 | PHE115, PHE297 | GLU301, THR302 | ILE101, ILE404, ILE114, ALA298, GLU301, VAL363, VAL367, ILE477 |
Emodin, an anthraquinone, has an extended conjugated system with four hydroxyl groups in addition to the central quinone functionality. Docking emodin in the active sites of the P450 enzymes 1A1, 1A2, 2B1, and 2A6 showed that the core anthraquinone moiety exhibits π–π interactions with some of the aromatic amino acids in the binding cavities (Figure 3). Despite the presence of multiple polar substituents such as hydroxyl and carbonyl groups, the number of hydrogen-bonding interactions with the enzymes’ binding cavity residues was minimal. Binding of emodin to P450 1A1 depicted hydrogen-bonding interactions of the carbonyl group and its adjacent hydroxyl group with the ASN221 residue of the enzyme and π–π interaction of one of its aromatic rings with PHE224 (Figure 3D). Emodin binds to P450 1A2 with π–π interactions with PHE125 and the heme, along with additional π-alkyl interactions with the hydrophobic residues GLY316 and ILE386 (Figure 3E). There were no such π–π interactions of emodin with the aromatic residues in the binding cavity of P450 2B1. Instead, a π-alkyl interaction with the hydrophobic residue ILE477 and a hydrogen-bonding interaction of one of its hydroxyl groups with THR302 were observed. From the docking studies, it was clear that a reduction in the number of hydroxyl groups in the compound should not affect the binding efficacy to the enzymes. Anthraquinones and quinones with a variety of different functional groups such as amino, nitro, and halogen groups were selected for this study to understand the impact of these functional groups on the inhibition type and potency. Compounds 1–12 all have fewer hydroxyl groups than emodin. Many of them also have branched hydrophobic groups that increase favorable interactions with the hydrophobic regions of the binding cavities.
Figure 3.
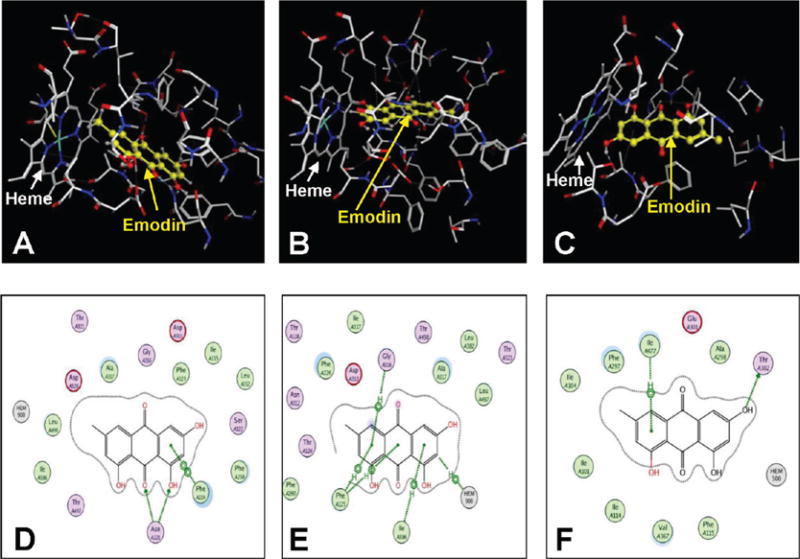
Binding mode of emodin to the active sites of (A) CYP1A1, (B) CYP1A2, and (C) CYP2B1. The protein residues are shown as stick models, and the emodin moecule is shown as a yellow ball and stick model. Panels D–F show the interactions depicted by emodin to the enzyme residues of CYPs 1A1, 1A2, and 2B1.
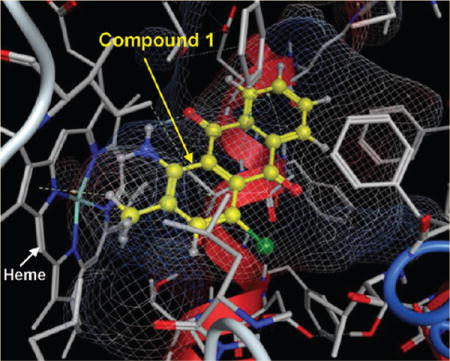
Compounds 1, 2, and 5 contain amine substituents, and all three exhibited nanomolar inhibition potencies for P450s 1A1 and 1A2. Aryl amines are known to be metabolized by P450s to form the potentially carcinogenic N-hydroxylated derivatives or, in some cases, to become N-dealkylated.41 P450s 1A1 and 1A2 are known to be the main enzymes involved in the bioactivation of most aryl amines. As in the case of arylacetylenes,15 aryl amines could be designed to potentially act as mechanism-based inhibitors of these enzymes. Indeed, compounds 1, 2, and 5 were found to act as inhibitors of P450s 1A1 and 1A2. Among these three compounds, compound 2 additionally inhibited P4502B1. Compounds 1 and 2 inhibited P4501A2 with the same potency (IC50 of 0.53 μM). Docking studies showed that these two compounds exhibited a similar docking mode in the binding cavity of this enzyme (Figure 4A). Compound 1 was shown to act as a mechanism-based inhibitor of P450s 1A1 and 1A2. For a compound to act as a mechanism-based inhibitor, a reactive intermediate must form during the metabolism that covalently binds the enzyme and prevents any further enzymatic activity. Our docking studies show the presence of two molecular sites in compound 1 close to the enzymes’ heme moieties, the primary amino group at position 1, and the methyl group at position 2, which can be targeted for oxidative metabolism by these P450s. If the primary amino group is responsible for the observed mechanism-based inhibition, then it would be expected that compound 2 should also act as a mechanism-based inhibitor of these enzymes. However, compound 2 does not demonstrate mechanism-based inhibition for any of the P450 enzymes in this study. These results suggest that the 2-methyl group might be responsible for the mechanism-based inhibition property of compound 1. Because of the presence of the primary amino group and a methyl group in its close proximity, one can speculate the mechanism of action to involve hydrogen abstraction by an iron-oxo species to produce the benzylic carbon radical intermediate, which could rearrange to produce inactivated complexes. The most structurally similar example can be found in a study on tacrine, which is a mechanism-based inhibitor of P450 1A2,42 where the authors have suggested a similar hydrogen abstraction from an adjacent methylene group by an iron-oxo species to form the carbon radical intermediate at the benzylic position. It is well-known that aromatic methyl groups such as the methyl group in toluene can be oxidized by P450 enzymes to form a radical intermediate by the abstraction of a methyl hydrogen atom. This radical can then be captured by the iron-bound hydroxyl radical resulting in the formation of the hydroxyl metabolite.43 In the case of furafylline, isotope effect studies have shown that the initiating event leading to the inactivation of P450 1A2 is the abstraction of a hydrogen atom from the C-8 methyl group of furafylline by the enzyme.44 The docking studies of compound 1 with P450s 1A1 and 1A2 (Figure 4A,B) showed that the 2-methyl group is positioned close to the heme moieties, making it possible for oxidation at this position. The exact mechanism by which compound 1 inactivates these enzymes has not yet been carefully evaluated.
Figure 4.
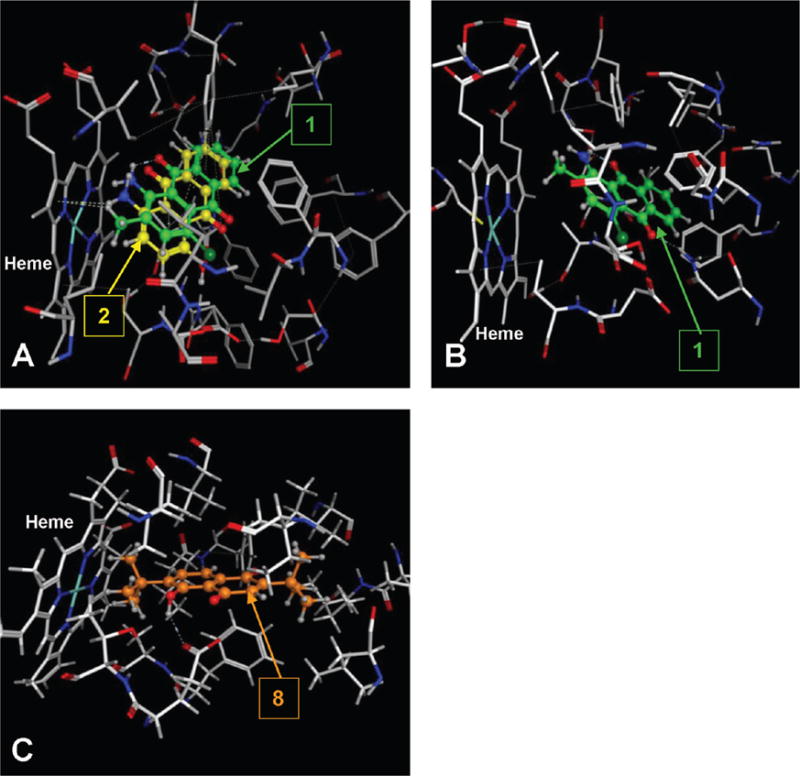
(A) Binding mode of compounds 1 and 2 to the catalytic site of CYP1A2, (B) binding mode of compound 1 to CYP1A1, and (C) binding mode of compound 8 to the catalytic site of CYP2B1. The protein is shown as a stick model, and the ligands are shown as ball and stick models.
P450 2B1 has a relatively smaller binding cavity than P450s 1A1 and 1A2 with more hydrophobic residues than polar or aromatic residues. This is reflected in the inhibition activity data of the compounds 1–12. While the effect of polarity was not easily deducible from the docking studies, the hydrophobic interaction effect was clearly demonstrated by the efficacy of compounds 8–12. Compounds with branched alkyl chain substituents seemed to be accommodated well in the cavity conferring greater potency for P450 2B1. The binding mode of compound 8, which selectively inhibited P4502B1, showed that the tert-butyl substituent is well accommodated in the binding cavity, with the phenolic hydroxyl group hydrogen bonding to the carboxyl group of GLU301 (Figure 4C). Compound 8 also exhibits π–π interaction with PHE297.
CONCLUSION
Earlier in silico studies22,23 assisted in designing 2D pharmacophores for a Chinese medicine database search, which led to emodin, a known P450 inhibitor as a model compound. Emodin was used as the lead compound to conduct the database searches for similar compounds. Twelve compounds were identified for testing as potential inhibitors of P450s 1A1, 1A2, 2B1, and 2A6. Compound 8 was found to be a selective inhibitor of P4502B1. Compound 1 was found to be a mechanism-based inhibitor of P450s 1A1 and 1A2. The precise mechanism by which compound 1 is transformed by P450s 1A1 and 1A2 into an active intermediate that reacts with the enzyme to inactivate it remains to be determined. On the basis of the structural similarities of compounds 1 and 2 and the dissimilarities in their inhibition mechanism, we speculated that the presence of a methyl group in close proximity is responsible for the mechanism-based inhibition of P450s 1A1 and 1A2 by compound 1. We hypothesize that the initial radical formed on the iron-oxo species abstracts a hydrogen atom from the adjacent methyl group to form a carbon radical intermediate,-which rearranges to form an inactive complex with the enzyme. Future studies will focus on understanding the chemical nature of this inactivation event.
Acknowledgments
Funding
This work was supported by Grants SC1GM084722 and G12 RR026260 and the Louisiana Cancer Research Consortium.
ABBREVIATIONS
- P450
cytochrome P450
- PAHs
polycyclic aromatic hydrocarbons
- QSAR
quantitative structure–activity relationship
- EROD
7-ethoxyresorufin O-deethylation
- MROD
7-methoxyresorufin O-demethylation
- PROD
7-pentoxyresorufin O-depentylation
- MOE
Molecular Operating Environment
- MOPAC
Molecular Orbital Package
- SD
steepest descent
- SG
conjugate gradient
- TN
truncated Newton
- rms
root mean square
References
- 1.Guengerich FP. Cytochrome P450: What have we learned and what are the future issues? Drug Metab Rev. 2004;36:159–197. doi: 10.1081/dmr-120033996. [DOI] [PubMed] [Google Scholar]
- 2.Nelson DR, Koymans L, Kamataki T, Stegeman JJ, Feyereisen R, Waxman DJ, Waterman MR, Gotoh O, Coon MJ, Estabrook RW, Gunsalus IC, Nebert DW. P450 superfamily: Update on new sequences, gene mapping, accession numbers and nomenclature. Pharmacogenetics. 1996;6:1–42. doi: 10.1097/00008571-199602000-00002. [DOI] [PubMed] [Google Scholar]
- 3.Hashizume T, Imaoka S, Mise M, Terauchi Y, Fujii T, Miyazaki H, Kamataki T, Funae Y. Involvement of CYP2J2 and CYP4F12 in the metabolism of ebastine in human intestinal microsomes. J Pharmacol Exp Ther. 2002;300:298–304. doi: 10.1124/jpet.300.1.298. [DOI] [PubMed] [Google Scholar]
- 4.Wang HW, Chen TL, Yang PC, Ueng TH. Induction of cytochromes P450 1A1 and 1B1 by emodin in human lung adenocarcinoma cell line CL5. Drug Metab Dispos. 2001;29:1229–1235. [PubMed] [Google Scholar]
- 5.Murray GI. The role of cytochrome P450 in tumour development and progression and its potential in therapy. J Pathol. 2000;192:419–426. doi: 10.1002/1096-9896(2000)9999:9999<::AID-PATH750>3.0.CO;2-0. [DOI] [PubMed] [Google Scholar]
- 6.Gibson P, Gill JH, Khan PA, Seargent JM, Martin SW, Batman PA, Griffith J, Bradley C, Double JA, Bibby MC, Loadman PM. Cytochrome P450 1B1 (CYP1B1) is overexpressed in human colon adenocarcinomas relative to normal colon: implications for drug development. Mol Cancer Ther. 2003;2:527–534. [PubMed] [Google Scholar]
- 7.Tokizane T, Shiina H, Igawa M, Enokida H, Urakami S, Kawakami T, Ogishima T, Okino ST, Li LC, Tanaka Y, Nonomura N, Okuyama A, Dahiya R. Cytochrome P450 1B1 is overexpressed and regulated by hypomethylation in prostate cancer. Clin Cancer Res. 2005;11:5793–5801. doi: 10.1158/1078-0432.CCR-04-2545. [DOI] [PubMed] [Google Scholar]
- 8.Marks KM, Park ES, Arefolov A, Russo K, Ishihara K, Ring JE, Clardy J, Clarke AS, Pelish HE. The selectivity of austocystin D arises from cell-line-specific drug activation by cytochrome P450 enzymes. J Nat Prod. 2011;74:567–573. doi: 10.1021/np100429s. [DOI] [PMC free article] [PubMed] [Google Scholar]
- 9.Shatalova EG, Klein-Szanto AJ, Devarajan K, Cukierman E, Clapper ML. Estrogen and cytochrome P450 1B1 contribute to both early- and late-stage head and neck carcinogenesis. Cancer Prev Res (Phila) 2011;4:107–115. doi: 10.1158/1940-6207.CAPR-10-0133. [DOI] [PMC free article] [PubMed] [Google Scholar]
- 10.Gomez A, Nekvindova J, Travica S, Lee MY, Johansson I, Edler D, Mkrtchian S, Ingelman-Sundberg M. Colorectal cancer-specific cytochrome P450 2W1: Intracellular localization, glycosylation, and catalytic activity. Mol Pharmacol. 2010;78:1004–1011. doi: 10.1124/mol.110.067652. [DOI] [PubMed] [Google Scholar]
- 11.Murray GI, Taylor MC, McFadyen MC, McKay JA, Greenlee WF, Burke MD, Melvin WT. Tumor-specific expression of cytochrome P450 CYP1B1. Cancer Res. 1997;57:3026–3031. [PubMed] [Google Scholar]
- 12.Karlgren M, Gomez A, Stark K, Svard J, Rodriguez-Antona C, Oliw E, Bernal ML, Ramon y Cajal S, Johansson I, Ingelman-Sundberg M. Tumor-specific expression of the novel cytochrome P450 enzyme, CYP2W1. Biochem Biophys Res Commun. 2006;341:451–458. doi: 10.1016/j.bbrc.2005.12.200. [DOI] [PubMed] [Google Scholar]
- 13.Aung PP, Oue N, Mitani Y, Nakayama H, Yoshida K, Noguchi T, Bosserhoff AK, Yasui W. Systematic search for gastric cancer-specific genes based on SAGE data: Melanoma inhibitory activity and matrix metalloproteinase-10 are novel prognostic factors in patients with gastric cancer. Oncogene. 2006;25:2546–2557. doi: 10.1038/sj.onc.1209279. [DOI] [PubMed] [Google Scholar]
- 14.Alexander DL, Zhang L, Foroozesh M, Alworth WL, Jefcoate CR. Metabolism-based polycyclic aromatic acetylene inhibition of CYP1B1 in 10T1/2 cells potentiates aryl hydrocarbon receptor activity. Toxicol Appl Pharmacol. 1999;161:123–139. doi: 10.1006/taap.1999.8794. [DOI] [PubMed] [Google Scholar]
- 15.Foroozesh M, Primrose G, Guo Z, Bell LC, Alworth WL, Guengerich FP. Aryl acetylenes as mechanism-based inhibitors of cytochrome P450-dependent monooxygenase enzymes. Chem Res Toxicol. 1997;10:91–102. doi: 10.1021/tx960064g. [DOI] [PubMed] [Google Scholar]
- 16.Hopkins NE, Foroozesh MK, Alworth WL. Suicide inhibitors of cytochrome P450 1A1 and P450 2B1. Biochem Pharmacol. 1992;44:787–796. doi: 10.1016/0006-2952(92)90417-h. [DOI] [PubMed] [Google Scholar]
- 17.Roberts ES, Hopkins NE, Foroozesh M, Alworth WL, Halpert JR, Hollenberg PF. Inactivation of cytochrome P450s 2B1, 2B4, 2B6, and 2B11 by arylalkynes. Drug Metab Dispos. 1997;25:1242–1248. [PubMed] [Google Scholar]
- 18.Shimada T, Murajama N, Tanaka K, Takenaka S, Imai Y, Hopkins NE, Foroozesh MK, Alworth WL, Yamazaki H, Guengerich FP, Komori M. Interaction of polycyclic aromatic hydrocarbons with human cytochrome P450 1B1 in inhibiting catalytic activity. Chem Res Toxicol. 2008;21:2313–2323. doi: 10.1021/tx8002998. [DOI] [PMC free article] [PubMed] [Google Scholar]
- 19.Shimada T, Yamazaki H, Foroozesh M, Hopkins NE, Alworth WL, Guengerich FP. Selectivity of polycyclic inhibitors for human cytochrome P450s 1A1, 1A2, and 1B1. Chem Res Toxicol. 1998;11:1048–1056. doi: 10.1021/tx980090+. [DOI] [PubMed] [Google Scholar]
- 20.Zhu N, Lightsey D, Liu J, Foroozesh M, Morgan KM, Stevens ED, Klein Stevens CL. Ethynyl and Propynylpyrene Inhibitors of Cytochrome P450. J Chem Crystallogr. 2010;40:343–352. doi: 10.1007/s10870-009-9659-0. [DOI] [PMC free article] [PubMed] [Google Scholar]
- 21.Strobel SM, Szklarz GD, He Y, Foroozesh M, Alworth WL, Roberts ES, Hollenberg PF, Halpert JR. Identification of selective mechanism-based inactivators of cytochromes P-450 2B4 and 2B5, and determination of the molecular basis for differential susceptibility. J Pharmacol Exp Ther. 1999;290:445–451. [PubMed] [Google Scholar]
- 22.Sridhar J, Jin P, Liu J, Foroozesh M, Stevens CL. In silico studies of polyaromatic hydrocarbon inhibitors of cytochrome P450 enzymes 1A1, 1A2, 2A6, and 2B1. Chem Res Toxicol. 2010;23:600–607. doi: 10.1021/tx900348v. [DOI] [PMC free article] [PubMed] [Google Scholar]
- 23.Sridhar J, Foroozesh M, Stevens CK. QSAR Models of Cytochrome P450 Enzyme 1A2 Inhibitors using CoMFA, CoMSIA and HQSAR. SAR QSAR Environ Res. 2011;22:681–697. doi: 10.1080/1062936X.2011.623320. [DOI] [PMC free article] [PubMed] [Google Scholar]
- 24.Mueller SO, Stopper H, Dekant W. Biotransformation of the anthraquinones emodin and chrysophanol by cytochrome P450 enzymes. Bioactivation to genotoxic metabolites. Drug Metab Dispos. 1998;26:540–546. [PubMed] [Google Scholar]
- 25.Sun M, Sakakibara H, Ashida H, Danno G, Kanazawa K. Cytochrome P4501A1-inhibitory action of antimutagenic anthraquinones in medicinal plants and the structure-activity relationship. Biosci, Biotechnol, Biochem. 2000;64:1373–1378. doi: 10.1271/bbb.64.1373. [DOI] [PubMed] [Google Scholar]
- 26.Srinivas G, Anto RJ, Srinivas P, Vidhyalakshmi S, Senan VP, Karunagaran D. Emodin induces apoptosis of human cervical cancer cells through poly(ADP-ribose) polymerase cleavage and activation of caspase-9. Eur J Pharmacol. 2003;473:117–125. doi: 10.1016/s0014-2999(03)01976-9. [DOI] [PubMed] [Google Scholar]
- 27.Su YT, Chang HL, Shyue SK, Hsu SL. Emodin induces apoptosis in human lung adenocarcinoma cells through a reactive oxygen species-dependent mitochondrial signaling pathway. Biochem Pharmacol. 2005;70:229–241. doi: 10.1016/j.bcp.2005.04.026. [DOI] [PubMed] [Google Scholar]
- 28.Chen YC, Shen SC, Lee WR, Hsu FL, Lin HY, Ko CH, Tseng SW. Emodin induces apoptosis in human promyeloleukemic HL-60 cells accompanied by activation of caspase 3 cascade but independent of reactive oxygen species production. Biochem Pharmacol. 2002;64:1713–1724. doi: 10.1016/s0006-2952(02)01386-2. [DOI] [PubMed] [Google Scholar]
- 29.Zhang L, Lau YK, Xi L, Hong RL, Kim DS, Chen CF, Hortobagyi GN, Chang C, Hung MC. Tyrosine kinase inhibitors, emodin and its derivative repress HER-2/neu-induced cellular transformation and metastasis-associated properties. Oncogene. 1998;16:2855–2863. doi: 10.1038/sj.onc.1201813. [DOI] [PubMed] [Google Scholar]
- 30.Lee HZ. Effects and mechanisms of emodin on cell death in human lung squamous cell carcinoma. Br J Pharmacol. 2001;134:11–20. doi: 10.1038/sj.bjp.0704205. [DOI] [PMC free article] [PubMed] [Google Scholar]
- 31.Yi J, Yang J, He R, Gao F, Sang H, Tang X, Ye RD. Emodin enhances arsenic trioxide-induced apoptosis via generation of reactive oxygen species and inhibition of survival signaling. Cancer Res. 2004;64:108–116. doi: 10.1158/0008-5472.can-2820-2. [DOI] [PubMed] [Google Scholar]
- 32.Burke MD, Thompson S, Weaver RJ, Wolf CR, Mayer RT. Cytochrome P450 specificities of alkoxyresorufin O-dealkylation in human and rat liver. Biochem Pharmacol. 1994;48:923–936. doi: 10.1016/0006-2952(94)90363-8. [DOI] [PubMed] [Google Scholar]
- 33.Tu Y, Deshmukh R, Sivaneri M, Szklarz GD. Application of molecular modeling for prediction of substrate specificity in cytochrome P450 1A2 mutants. Drug Metab Dispos. 2008;36:2371–2380. doi: 10.1124/dmd.108.022640. [DOI] [PMC free article] [PubMed] [Google Scholar]
- 34.Buters JT, Schiller CD, Chou RC. A highly sensitive tool for the assay of cytochrome P450 enzyme activity in rat, dog and man. Direct fluorescence monitoring of the deethylation of 7-ethoxy-4-trifluoromethylcoumarin. Biochem Pharmacol. 1993;46:1577–1584. doi: 10.1016/0006-2952(93)90326-r. [DOI] [PubMed] [Google Scholar]
- 35.DeLuca JG, Dysart GR, Rasnick D, Bradley MO. A direct, highly sensitive assay for cytochrome P-450 catalyzed O-deethylation using a novel coumarin analog. Biochem Pharmacol. 1988;37:1731–1739. doi: 10.1016/0006-2952(88)90436-4. [DOI] [PubMed] [Google Scholar]
- 36.Hopkins NE, Foroozesh MK, Alworth WL. Suicide inhibitors of cytochrome P450 1A1 and P450 2B1. Biochem Pharmacol. 1992;44:787–796. doi: 10.1016/0006-2952(92)90417-h. [DOI] [PubMed] [Google Scholar]
- 37.Foroozesh M, Primrose G, Guo Z, Bell LC, Alworth WL, Guengerich FP. Aryl acetylenes as mechanism-based inhibitors of cytochrome P450-dependent monooxygenase enzymes. Chem Res Toxicol. 1997;10:91–102. doi: 10.1021/tx960064g. [DOI] [PubMed] [Google Scholar]
- 38.Oda A, Yamaotsu N, Hirono S. New AMBER force field parameters of heme iron for cytochrome P450s determined by quantum chemical calculations of simplified models. J Comput Chem. 2005;26:818–826. doi: 10.1002/jcc.20221. [DOI] [PubMed] [Google Scholar]
- 39.Gill P, Wright M. Practical Optimization. Academic Press; London: 1981. [Google Scholar]
- 40.Denton TT, Zhang X, Cashman JR. 5-Substituted, 6-substituted, and unsubstituted 3-heteroaromatic pyridine analogues of nicotine as selective inhibitors of cytochrome P-450 2A6. J Med Chem. 2005;48:224–239. doi: 10.1021/jm049696n. [DOI] [PubMed] [Google Scholar]
- 41.Kim D, Guengerich FP. Cytochrome P450 activation of arylamines and heterocyclic amines. Annu Rev Pharmacol Toxicol. 2005;45:27–49. doi: 10.1146/annurev.pharmtox.45.120403.100010. [DOI] [PubMed] [Google Scholar]
- 42.Peng JZ, Remmel RP, Sawchuk RJ. Inhibition of murine cytochrome P4501A by tacrine: in vitro studies. Drug Metab Dispos. 2004;32:805–812. doi: 10.1124/dmd.32.8.805. [DOI] [PubMed] [Google Scholar]
- 43.Ling KH, Hanzlik RP. Deuterium isotope effects on toluene metabolism. Product release as a rate-limiting step in cytochrome P-450 catalysis. Biochem Biophys Res Commun. 1989;160:844–849. doi: 10.1016/0006-291x(89)92511-4. [DOI] [PubMed] [Google Scholar]
- 44.Kunze KL, Trager WF. Isoform-selective mechanism-based inhibition of human cytochrome P450 1A2 by furafylline. Chem Res Toxicol. 1993;6:649–656. doi: 10.1021/tx00035a009. [DOI] [PubMed] [Google Scholar]