

Abstract
Background and Purpose
Clinical trials have demonstrated improved 90-day outcomes for patients with acute ischemic stroke treated with stent retriever thrombectomy plus tissue-type plasminogen activator (SST+tPA) compared with tPA. Previous studies suggested that this strategy may be cost-effective, but models were derived from pooled data and older assumptions.
Methods
In this prospective economic substudy conducted alongside the SWIFT-PRIME trial (Solitaire With the Intention for Thrombectomy as Primary Endovascular Treatment for Acute Ischemic Stroke), in-trial costs were measured for patients using detailed medical resource utilization and hospital billing data. Utility weights were assessed at 30 and 90 days using the EuroQol-5 dimension questionnaire. Post-trial costs and life-expectancy were estimated for each surviving patient using a model based on trial data and inputs derived from a contemporary cohort of ischemic stroke survivors.
Results
Index hospitalization costs were $17 183 per patient higher for SST+tPA than for tPA ($45 761 versus $28 578; P<0.001), driven by initial procedure costs. Between discharge and 90 days, costs were $4904 per patient lower for SST+tPA than for tPA ($11 270 versus $16 174; P=0.014); total 90-day costs remained higher with SST+tPA ($57 031 versus $44 752; P<0.001). Higher utility values for SST+tPA led to higher in-trial quality-adjusted life years (0.131 versus 0.105; P=0.005). In lifetime projections, SST+tPA was associated with substantial gains in quality-adjusted life years (6.79 versus 5.05), cost savings of $23 203 per patient and was economically dominant when compared with tPA in 90% of bootstrap replicates.
Conclusions
Among patients with acute ischemic stroke enrolled in the SWIFT-PRIME trial, SST increased initial treatment costs, but was projected to improve quality-adjusted life-expectancy and reduce healthcare costs over a lifetime horizon compared with tPA.
Keywords: quality-adjusted life years, stents, stroke, thrombectomy, tissue-type plasminogen activator
Each year, >530 000 individuals have a first acute ischemic stroke, and an additional 160 950 have a recurrent ischemic stroke in the United States.1 Although initial hospitalization costs can range from $8000 to $41 000,2,3 long-term disability among surviving patients raises the estimated economic burden to >$33 billion/y in the United States.1 Recent progress toward reducing the long-term impact of acute ischemic stroke caused by large-vessel occlusion through improved new-generation stent retrievers has the potential to lessen the economic impact of acute ischemic stroke by reducing nursing home and other types of custodial care.1
Five international, randomized clinical trials have established clear superiority of mechanical thrombectomy when combined with intravenous tissue-type plasminogen activator (tPA) as compared with intravenous tPA alone.4–8 These newer devices have vastly improved the frequency with which substantial reperfusion is achieved and the speed of reperfusion, resulting in more salvaged tissue and less intracranial hemorrhage, and consequently better functional outcomes post-stroke.4–8 Pooled data from these trials have demonstrated that combining thrombectomy with tPA results in an ≈70% relative and 19% absolute increase in the proportion of patients who achieve functional independence 90 days after their stroke.9
Two published cost-utility analyses10,11 have reported that incremental cost-effectiveness ratios (ICER) for stent retriever thrombectomy (SST)+tPA versus tPA as <$50 000 per quality-adjusted life-year (QALY) gained, a commonly accepted threshold in the United States healthcare system.12 These studies used decision analytic models applied to short-term trial results and relied heavily on cost, quality of life, and survival projections derived from previous studies—some of which are ≈20 years old. Whether these studies reflect the true value of neurothrombectomy in contemporary practice is thus unknown.
To produce more reliable and contemporary estimates of long-term costs and outcomes, we performed a prospective economic substudy alongside the SWIFT-PRIME trial. In this study, we captured detailed, patient-level cost, quality of life, disability, and survival data for each participant over the 90-day study period and combined these empirical data with updated estimates of survival and cost from a separate cohort of stroke survivors to examine the cost-effectiveness of SST in combination with tPA in current practice.
Methods
Study Design and Patient Population
SWIFT-PRIME was a randomized controlled trial that compared the safety and effectiveness of the Solitaire Revascularization Device SST plus tPA (SST+tPA) versus tPA alone for treatment of patients with acute ischemic stroke because of large-vessel anterior circulation occlusion presenting within 6 hours of symptom onset.8,13 The planned study enrollment was terminated early because of achievement of prespecified outcomes, and the primary results of the study have been described previously.8 The study was approved by each participating site’s institutional review board. Patients provided written, informed consent except at select sites where informed consent was waived for emergency treatment.
Analytic Overview
We evaluated the cost-effectiveness from the perspective of the US healthcare system. The primary analysis was performed on the modified intention-to-treat population, which was defined as randomized patients who provided data for the index hospitalization. Patients who withdrew from the study immediately after treatment assignment (eg, initial treatment costs were unavailable) were excluded. Patients were analyzed according to their assigned treatment.
Detailed resource utilization data, hospital billing data, and patient reported quality of life data were collected for patients from the time of randomization through 90-day follow-up. These data were used to calculate direct healthcare costs and quality-adjusted life-expectancy during the initial 90-day period. The observed data were then used to project patient-level survival, quality-adjusted life-expectancy, and costs over a lifetime horizon. Lifetime cost-effectiveness was estimated in terms of cost per quality-adjusted year of life gained and cost per year of life gained. Costs are presented in 2015 US dollars, and future costs and benefits were discounted at 3% per year consistent with the current guidelines.14
Index Procedure and Hospitalization Costs
Costs for the initial thrombectomy procedures and hospital stays were determined using a combination of hospital billing data (itemized charges and UB-04 summary bills) and resource-based accounting methods, as described previously.15 Procedural costs for neurovascular interventional procedures were calculated by multiplying counts of resource use, as recorded by the study sites, by unit costs derived from a survey of 3 study sites. The acquisition cost of the Solitaire device was set at $6862, based on information provided by the manufacturer. Ancillary costs for the neurointerventional suite (including overhead, nonphysician personnel, and general supplies) were estimated based on the cost of mechanical thrombectomy procedures performed at Saint Luke’s Mid America Neuroscience Institute and adjusted for measured procedural room time.
All other costs for each index admission were calculated from hospital bills, when available (n=89) by multiplying nonprocedural charges by cost-center specific cost:charge ratios obtained from each center’s Medicare cost report. When billing data were not available (n=40 US patients and 61 non-US patients), these costs were estimated based on a regression model derived from patients with available billing data (R2=0.64). Because hospital lengths of stay were longer for non-US participants, their lengths of stays were adjusted to US levels based on a regression model that included country, treatment group, and 7-day modified Rankin Scale (mRS) data from trial participants.
Follow-Up Resource Utilization and Costs
At 30- and 90-day follow-up visits, trial participants were formally queried about their use of post-hospital resources including repeat hospitalizations, rehabilitation services (inpatient, outpatient, and home), skilled nursing facility admissions, emergency room visits, physician visits, home health care, and outpatient assessments. Each hospitalization was mapped to a Medicare severity-adjusted diagnosis-related group by a trained coder blinded to treatment assignment. For each hospitalization, costs were assigned either using hospital billing data (with conversion of charges to costs as previously described) or by applying national average Medicare reimbursement rates when billing data were not available.
Physician Fees
Physician fees for the initial procedure were based on the current Medicare fee schedule for the specific procedures performed. In addition, fees for anesthesiology were also included where appropriate. Fees for daily care were assigned for the index hospitalization on the basis of measured intensive care unit and non–intensive care unit length of stay. For follow-up readmissions, we assumed physician fees would be equal to 20% of the hospital costs for each admission.16
Long-Term Costs
For each patient who survived to 90 days, post-trial costs were estimated on the basis of data from a separate but contemporary cohort of patients with stroke. This cohort consisted of 958 patients with acute stroke from 2 US centers whose events occurred between 2010 and 2014 and who had valid 90-day mRS assessments. To project long-term survival and costs for each patient, each patient was linked to data from the National Death Index, and each patient with Medicare coverage (n=429) was linked with claims from the CMS data warehouse. Patient characteristics including 90-day disability levels according to the mRS for the external cohorts linked to the National Death Index, and CMS data are included in Table I in the online-only Data Supplement. Medicare payments from inpatient and outpatient claims extending from day 91 after the index hospitalization until death or censoring were summed and divided by the period of observation to create monthly averages for patients with mild disability (mRS, 0–2: $875 per month) and moderate to severe disability (mRS, 3–5: $957 per month). For each trial participant who survived 90 days, monthly costs beyond the trial were assigned based on his or her observed 90-day mRS. Future nursing home costs for surviving trial patients were estimated based on the proportion of all study participants who were nursing home residents at 90-day follow-up, stratified by mRS. We assumed that those still residing in a skilled nursing facility or inpatient rehabilitation facility on day 90 would remain in a long-term care setting for the remainder of their lives.17 Nursing home cost per day was set at $168, the average of daily rates from three state Medicaid programs for 2015 (Illinois, Texas, and Florida). Annualized follow-up costs for surviving patients according to 90-day mRS are summarized in Table II in the online-only Data Supplement.
Life-Expectancy Estimation
For patients who survived the 90-day trial period, life-expectancy beyond the trial was projected using a Markov disease simulation model. In this model, each surviving patient was assumed to face a monthly risk of death, with estimates of this risk based on age and sex-matched risks of death obtained from US life-tables, calibrated to match survival for patients with acute ischemic stroke, and adjusted to reflect the patient’s 90-day mRS level. Because long-term follow-up was not available for the trial population, calibration to the stroke population was based on the 2-center stroke cohort described above. For each patient in the 2-center stroke cohort, long-term mortality was determined from the National Death Index. We then estimated the 4-year mortality of stroke survivors with minimal disability (mRS, 0–2) and compared this with expected 4-year mortality for age- and sex-matched members of the US population. The ratio of these 2 mortality estimates (1.88) was then used as a multiplicative calibration factor to adjust life-table–based mortality probabilities for the trial participants to reflect the underlying excess mortality for patients with previous stroke and minimal disability.
The relative mortality hazard associated with increasing levels of residual disability (compared with the mRS 0–2 subgroup) was then estimated from the external stroke cohort using a Cox proportional hazards model adjusting for age, sex, and baseline comorbidities. The resulting hazard ratios were 2.05 (95% confidence interval [CI], 1.40–3.01) and 4.48 (95% CI, 2.84–7.06) for mRS scores of 3 to 4 and 5, respectively. Patient-level survival beyond the 90-day study period was then projected using the life-tables, calibration factor, and mRS adjustment factors. These methods are analogous to those that have been used previously for estimation of life-expectancy in clinical trials of coronary artery bypass grafting versus percutaneous coronary intervention18 and transcatheter aortic valve replacement.19
Quality-Adjusted Life-Expectancy
The EuroQol-5 dimension 5 level health status instrument was used to assess quality of life for each study participant at 30 and 90 days poststroke. EuroQol-5 dimension responses were mapped to health state utility weights (range, 0–1, higher values indicating better health) using a scoring algorithm for the US population.20 Within-trial quality-adjusted life-expectancy was calculated for each patient as the time-weighted average of his or her utility values, assuming that any transitions occurred at the midpoint between assessments. Because baseline utility weights were not obtained from trial participants, these values were imputed based on a statistical model regressing the 30-day EuroQol-5 dimension–derived utilities on age, sex, and the National Institutes of Health Stroke Scale at 30 days. Mean 90-day utility values for each level of mRS were applied for lifetime projection.
Statistical Analysis
Categorical data are reported as frequencies and continuous variable are reported as means and SDs. Categorical data were compared with χ2 tests or the Fisher exact test, as appropriate. Normally distributed continuous variables were compared using Student t test, whereas non-normally distributed data were compared using Wilcoxon rank-sum tests. In-trial cost data are reported as mean values and compared using 2-sample Student t tests. A P<0.05 was considered statistically significant for all comparisons. All analyses were performed using SAS 9.3 (SAS Institute, Cary, NC).
ICERs were calculated as the difference in mean discounted lifetime costs divided by the difference in mean discounted life-expectancy or quality-adjusted life-expectancy. Bootstrap resampling was used to assess the joint distribution of lifetime cost and survival differences (along with their associated 95% CIs) and to graphically represent the joint uncertainty in these parameters on the cost-effectiveness plane. We also used this approach to generate cost-effectiveness acceptability curves, which demonstrate the probability that SST+tPA is economically attractive compared with tPA alone over a range of cost-effectiveness thresholds.
Sensitivity and Subgroup Analyses
Lifetime cost-effectiveness results were estimated separately for several subgroups of clinical interest including sex, baseline age (<65, 65–75, and >75 years), baseline National Institutes of Health Stroke Scale (stratified at the median) time from symptom onset to randomization (stratified at the median) and enrolling country (US versus other). Sensitivity analyses were performed using previously published data for long-term costs11; excluding nursing home costs; excluding all long-term costs; using previously published disability-adjusted life-year utility weights21; and using a range of alternative mortality calibration factors to simulate populations with lower and higher long-term mortality than was observed in the 2-center stroke cohort.
Results
Patient Population
There were 196 patients with acute ischemic stroke and occlusion of a major anterior circulation artery randomized to SST+tPA (n=98) or tPA (n=98). The analytic population for the economic substudy included 190 patients who had utilization/cost data (96 SST+tPA and 92 intravenous tPA). There were no significant differences between treatment arms with respect to baseline characteristics (Table III in the online-only Data Supplement).
Initial Treatment Cost
Of the 98 patients randomized to SST+tPA, 97 underwent an attempted thrombectomy procedure. Resource utilization for these 97 procedures is summarized in Table IV in the online-only Data Supplement. The mean cost of the stent retrievers was $7852 per procedure, and other devices cost $3,814 per procedure. After including other costs (including nonphysician personnel and room overhead), mean procedural cost was $14 753±5022 (median $13 679; interquartile range, $12 028–$18 153).
Resource utilization and costs for the index hospitalization are summarized in Table 1. Length of stay was similar for the 2 groups as was intensive care unit length of stay. As a result, total nonprocedural hospital costs were also similar for the stent retriever and intravenous tPA-alone groups ($28 605±16 566 [median, $21 095] versus $27 320±14 326 [median $23 571]; P=0.549). On the contrary, physician costs were higher for the stent retriever group ($2517±695 [median, $2388] versus ($1258±497 [median, $1147])—driven primarily by the physician fees for the thrombectomy procedure. Altogether, initial hospitalization costs were ≈$17 000 per patient higher for the stent retriever group than for the intravenous tPA-alone group ($45 761±18 401 [median, $39 825] versus $28 578±14 783 [median, $24 917]; P<0.001).
Table 1.
Resource Utilization and Costs
| SST+tPA (n=98) | tPA (n=92) | P Value | |
|---|---|---|---|
| Index hospitalization | |||
| Length of stay, d | |||
| Mean±SD | 9.2±6.3 | 8.9±6.0 | 0.759 |
| Median (IQR) | 7.0 (5.0–11.0) | 7.2 (5.0–10.5) | |
| ICU length of stay, d | |||
| Mean±SD | 4.0±3.9 | 4.0±4.5 | 0.941 |
| Median (IQR) | 2.8 (2.0–5.0) | 3.0 (1.6–5.0) | |
| Procedural costs, $ | |||
| Mean±SD | 14 640±5 122 | … | |
| Median (IQR) | 13 576 (11 982–18 153) | … | |
| Nonprocedural hospital costs, $ | |||
| Mean±SD | 28 605±16 566 | 27 320±14 326 | 0.549 |
| Median (IQR) | 21 095 (17 292–36 555) | 23 571 (18 089–31 720) | |
| Physician costs, $ | |||
| Mean±SD | 2517±695 | 1258±497 | <0.001 |
| Median (IQR) | 2 388 (2166–2808) | 1147(1003–1411) | |
| Total index hospital costs, $ | |||
| Mean±SD | 45 761±18 401 | 28 578±14 743 | <0.001 |
| Median (IQR) | 39 825 (33 534–55 521) | 24 917 (19 218–32 887) | |
| Hospital discharge–90 d | |||
| Proportion of patients using service | |||
| Rehospitalization, % | 17.3 | 19.6 | 0.69 |
| Inpatient rehabilitation or SNF admission, % | 55.1 | 70.7 | 0.03 |
| Emergency room visit, % | 9.2 | 2.2 | 0.04 |
| Physician visits, % | 53.1 | 43.5 | 0.19 |
| Outpatient rehabilitation, % | 18.4 | 22.8 | 0.45 |
| Home rehabilitation, % | 13.3 | 13.0 | 0.96 |
| Counts of service use | |||
| Rehospitalization days | 0.2±0.5 | 0.2±0.5 | 0.92 |
| Inpatient rehabilitation/SNF days | 26.9±38.6 | 36.3±37.9 | 0.09 |
| Emergency room visits | 0.1±0.4 | 0.0±0.2 | 0.11 |
| Physician visits | 1.7±3.9 | 2.0±5.1 | 0.56 |
| Outpatient rehabilitation visits | 3.5±10.3 | 6.8±25.0 | 0.23 |
| Home rehabilitation visits | 2.3±7.8 | 2.6±9.2 | 0.82 |
| Costs | |||
| Rehospitalization (including physician fees) | |||
| Mean±SD | $2012±5443 | $2750±8336 | 0.47 |
| Median (IQR) | 0.0 (0.0–0.0) | 0.0 (0.0–0.0) | |
| Outpatient care and services (including SNF) | |||
| Mean±SD | $9258±11 444 | $13 425±11 898 | 0.01 |
| Median (IQR) | $4042 (240–18 034) | $9747 (2654–22 082) | |
| Total discharge to 90-d costs | |||
| Mean±SD | $11 270±12 921 | $16 174±14 566 | 0.01 |
| Median (IQR) | $6987 (255–18 650) | $12 010 (3619–26 706) | |
ICU indicates intensive care unit; IQR, interquartile range; SNF, skilled nursing facility; SST, stent retriever thrombectomy; and tPA, tissue-type plasminogen activator.
Follow-up Resource Utilization and Costs
Resource utilization and medical care costs between hospital discharge and 90 days are also summarized in Table 1. There were no significant differences in the proportion of patients who were rehospitalized between the 2 groups. However, patients treated with SST+tPA were less likely to require admission to an inpatient rehabilitation hospital or skilled nursing facility (55.1% versus 70.7%; P=0.03) during the 90-day follow-up period). Total follow-up costs were ≈$5000 per patient lower in the SST+tPA group ($11 270±12 921 versus $16 174+14 566; P=0.014)—driven mainly by differences in costs for inpatient rehabilitation and nursing home days. These savings were insufficient to fully offset the higher initial cost of SST, and total 90-day costs remained ≈$10 000 per patient higher for SST+tPA than for tPA ($57 031±24 570 [median, $52 268] versus $44 752±22 929 [median, $39 656]; P<0.001).
Utility Weights and QALYs
Utility weights by treatment group are shown in Figure 1. Mean utility values were similar at baseline but were significantly higher for SST+tPA at 30 days (0.662±0.292 versus 0.518±0.326; P=0.004) and 90 days (0.712±0.248 versus 0.611±0.301; P=0.019). As a result, total in-trial QALYs were higher for SST+tPA as well (0.131±0.062 versus 0.105±0.063; P=0.005).
Figure 1.
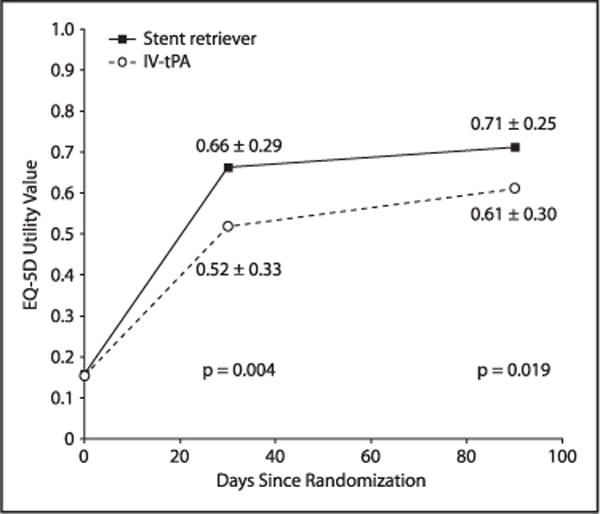
Utility comparison during 90-day trial period. EQ-5D indicates EuroQol-5 dimension; and IV tPA, intravenous tissue-type plasminogen activator.
Lifetime Projections
Over the lifetime horizon, we estimated an undiscounted life-expectancy of 11.76 years (95% CI, 10.83–12.63) for SST+tPA and 10.02 years (95% CI, 9.00–10.95) for tPA (Figure I in the online-only Data Supplement). After discounting, these values decreased to 9.13 and 7.92 years, respectively.
Turing to the lifetime cost-effectiveness analyses (Table 2), in the base case scenario (row 1), projected lifetime costs were lower for SST+tPA than for tPA ($215 781 versus $238 984; difference, −$23 203; 95% CI, $56 946 less to $12 933 more), and lifetime QALYs were higher (6.789 versus 5.046; difference, 1.743; 95% CI, 0.760–2.786). Under our base case assumptions, SST+tPA was projected to be an economically dominant treatment strategy (ie, providing both improved health outcomes and long-term cost savings) compared with tPA. SST+tPA remained economically dominant in 90.0% of bootstrap replicates, and the ICER was <$50 000 per QALY gained in 100% of replicates (Figure 2; Figure II in the online-only Data Supplement). When outcomes were assessed in life-years (Table 2, row 2), SST+tPA was projected to increase life-expectancy by 1.208 years (95% CI, 0.287–2.168) and was economically dominant in 89.5% of the bootstrap replicates and cost-effective at a threshold of $50 000/life-year gained in 99.6% of the replicates. When we varied the duration of follow-up, we found that projected costs for SST+tPA became less than those for the tPA group at 22 months (Figure 3).
Table 2.
Lifetime Cost-Effectiveness Results for Base Case and Sensitivity Analyses
| SST+tPA Costs ($) |
tPA Costs ($) |
Δ Costs ($) (95% CI) | SST+tPA QALYs |
tPA QALYs |
Δ QALYs (95% CI)* | ICER ($ per QALY) | % Dominant |
% Dominated |
% <$50K |
|
|---|---|---|---|---|---|---|---|---|---|---|
| Base case | 215 781 | 238 984 | −23 203 (−56 946 to 12 933) | 6.789 | 5.046 | 1.743 (0.760–2.786) | Dominant | 90.0 | 0.0 | 100 |
| Benefit in life-years | 215 781 | 238 984 | −23 203 (−56 946 to 12 933) | 9.128 | 7.920 | 1.208* (0.287–2.168) | Dominant | 89.5 | 0.1 | 99.9 |
| Sensitivity analyses | ||||||||||
| Historical costs | 135 876 | 127 368 | 8507 (−6565 to 23 804) | 6.789 | 5.046 | 1.743 (0.760–2.786) | 4881 | 13.8 | 0.0 | 99.9 |
| No nursing home costs | 152 861 | 129 371 | 23 490 (12 960 to 34 573) | 6.789 | 5.046 | 1.743 (0.760–2.786) | 12 631 | 0.0 | 0.0 | 99.9 |
| No long-term costs | 57 030 | 44 752 | 12 278 (5786 to 19 080) | 6.789 | 5.046 | 1.743 (0.760–2.786) | 7044 | 0.0 | 0.0 | 99.8 |
| Benefit in DALYs | 215 781 | 238 984 | −23 203 (−56 946 to 12 933) | 7.235 | 5.156 | 2.079 (0.933–3.253) | Dominant | 90.0 | 0.0 | 100 |
| Calibration factor 1 | 259 157 | 298 738 | −39 581 (−84 455 to 8897) | 8.396 | 6.306 | 2.089 (0.904–3.341) | Dominant | 95.0 | 0.0 | 100 |
| Calibration factor 3 | 180 912 | 192 682 | −11 770 (−38 382 to 16 280) | 5.448 | 4.013 | 1.436 (0.622–2.273) | Dominant | 80.6 | 0.0 | 100 |
| Calibration factor 5 | 149 596 | 152 580 | −2 984 (−23 325 to 18 445) | 4.200 | 3.066 | 1.134 (0.486–1.781) | Dominant | 60.4 | 0.0 | 99.8 |
CI indicates confidence interval; DALY, disability-adjusted life-years; ICER, incremental cost-effectiveness ratio; QALY, quality-adjusted life-years; SST, Solitaire stent thrombectomy; and tPA, tissue-type plasminogen activator.
Results in QALYs unless otherwise specified as life-years or DALYs.
Figure 2.
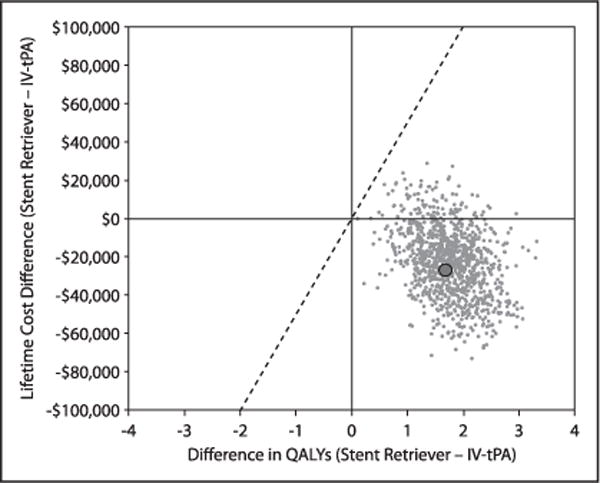
Scatter plot showing the joint distribution of the difference in lifetime cost and quality-adjusted life-expectancy between intravenous tissue-type plasminogen activator (IV tPA) alone and stent retriever thrombectomy according to bootstrap simulation (1000 replicates). The large solid dot indicates the base case value of Δ costs = $23 203 and Δ quality-adjusted life years (QALYs) = 1.743. The solid, diagonal line indicates the incremental cost-effectiveness ratio threshold of $50 000 per QALY gained.
Figure 3.
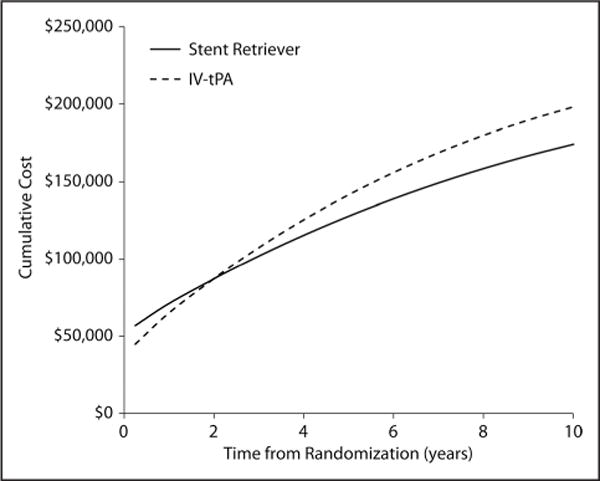
Time to breakeven point where long-term costs associated with stent retriever thrombectomy are exceeded by higher long term costs in the intravenous tissue-type plasminogen activator (IV tPA)–alone group.
Sensitivity and Subgroup Analyses
The lifetime cost-effectiveness results were robust across a wide range of alternative assumptions (Table 2). When we used historical estimates of long-term costs instead of our empirically derived costs,11 projected lifetime costs decreased to $135 876 for SST and $127 368 for tPA alone. Although SST+tPA was no longer economically dominant in this scenario, the ICER remained highly favorable at $4881 per QALY gained and was <$50 000 per QALY gained in 99.9% of bootstrap replicates. Exclusion of long-term costs (after day 90) led to an ICER of $7044 per QALY gained that remained <$50 000 per QALY gained in 99.8% of replicates. Substitution of utility weights based on disability-adjusted life-years led to a larger gain in QALYs (or disability-adjusted life-years) but did not alter the fundamental results of the study. Finally, when we varied the mortality calibration factor from 1.0 in our base case to 5.0 (to reflect a population with more comorbid conditions and thus higher annual mortality compared with the trial population), the projected QALY gain with SST+tPA decreased to 1.436; nonetheless, SST+tPA remained economically dominant in 80.6% of replicates and cost-effective at a threshold of $50 000 per QALY in 100%.
The results of prespecified subgroup analyses are summarized in Table V in the online-only Data Supplement. In general, the results of these stratified analyses demonstrated that SST+tPA was an economically dominant treatment strategy, similar to those for the overall trial. The only exception to this finding was for the oldest cohort (age >75 years), projected lifetime costs were higher with SST+tPA. Nonetheless, even in this subgroup, SST+tPA was projected to be economically attractive with an ICER of $22,801 per QALY gained and 82.2% of bootstrap replicates <$50 000 per QALY.
Discussion
This study represents the first prospectively designed economic analysis of SST+tPA compared with tPA in patients with an acute ischemic stroke because of large-vessel occlusion. Using empirical data derived from patients in the SWIFT-PRIME trial, we found that SST+tPA was associated with an increase in initial hospital costs of ≈$17 000 per patient compared with tPA alone, driven almost entirely by the cost of the thrombectomy procedure. Over the ensuing 90 days, medical care costs were nearly $5000 per patient less for the stent retriever group, owing to significant reductions in rehospitalization and rehabilitation-related costs. Although total 90-day costs remained ≈$12 000 per patient higher for the stent retriever group, lifetime projections (based on the observed health status of surviving patients and contemporary data relating levels of poststroke disability to long-term costs and survival) demonstrated that SST+tPA was associated with cost savings of >$23 000 per patient and gains in life-expectancy and quality-adjusted life-expectancy (1.2 and 1.7 years, respectively). As a result, SST+tPA was projected to be an economically dominant treatment strategy, leading to both significant long-term cost savings and health benefits compared with tPA. Although there was some uncertainty around these estimates, bootstrap replication demonstrated that under our base case assumptions, the probability that SST+tPA is economically dominant is 90%, and there is virtual certainty that the ICER is <$50 000 per QALY gained—a threshold that is considered to be highly cost-effective within the US healthcare system.12
These results were generally consistent over a broad range of subgroup and sensitivity analyses. Although the results of subgroup analyses were less certain owing to smaller sample sizes, SST+tPA remained economically dominant in all subgroups tested with the exception of patients aged >75 years. Nonetheless, even in this least favorable subgroup, the ICER for SST+tPA was ≈$22 000 per QALY and remained <$50 000 per QALY in >80% of bootstrap replicates. Thus, it seems that for patients similar to those enrolled in the SWIFT-PRIME trial, SST+tPA is highly cost-effective regardless of other patient characteristics. In sensitivity analyses, our results were mainly sensitive to alternative assumptions on long-term costs after stroke. For example, exclusion of nursing home costs (a major contributor to the costs attributable to stroke-related disability) led to much lower cost offsets such that SST+tPA was no longer cost saving over a lifetime horizon. Nonetheless, given the substantial projected gains in life-expectancy and quality-adjusted life-expectancy, SST+tPA remained a highly cost-effective strategy in this scenario.
One of the most striking aspects of the results was the impact of long-term projections on the economic and clinical value of SST+tPA in acute ischemic stroke. During the 90-day trial period, SST+tPA was associated with net costs of ≈$12 000 and a gain of 0.026 QALYs, with an ICER of $472 000 per QALY gained. Had we restricted our analysis to the duration of the trial, we would have concluded that SST+tPA was an economically unattractive treatment strategy. However, when we used long-term data on contemporary stroke survivors to project the benefits of this strategy over a lifetime horizon, the differences in residual disability at 90 days translated into much larger gains in QALYs and substantial lifetime cost savings. These results demonstrate the importance of considering a long-term perspective when evaluating treatments that provide important gains in survival or durable quality of life improvements.
Comparison With Previous Studies
Several previous studies have used a modeling approach to estimate the cost-effectiveness of SST+tPA in acute ischemic stroke. Leppert et al11 used data from the MR CLEAN (Multicenter Randomized Clinical Trial of Endovascular Treatment for Acute Ischemic Stroke in the Netherlands) to model the lifetime cost-effectiveness of intra-arterial therapy (including intra-arterial thrombolytic therapy and mechanical thrombectomy) as an adjunct to tPA for treatment of acute ischemic stroke because of large-vessel occlusion in the anterior cerebral circulation. They found that compared with tPA, adjunctive intra-arterial therapy led to a 0.7-year gain in QALYs at an incremental cost of ≈$9911 per patient, yielding an ICER of $14 137 per QALY gained. More recently, Ganesalingam et al10 used pooled outcomes data from 5 randomized clinical trials to evaluate the cost-effectiveness of SST+tPA in patients with acute ischemic stroke from the perspective of the UK National Health Service. They found that over a 20-year time horizon, SST+tPA was associated with an incremental cost of £7431 ($12 262) per patient and a gain of 1.05 QALYs, with a highly favorable ICER of £7061 ($11 651) per QALY gained.
Although all 3 studies have found that intra-arterial therapy for acute ischemic stroke (generally with stent retrievers) is highly cost-effective, ours is the first to demonstrate that this approach may be economically dominant. There are several important reasons for these differences. First, our study used individual patient-level data from the SWIFT-PRIME trial as the basis for estimates of 90-day cost and effectiveness, whereas the other studies used either pooled data from a single trial (MR CLEAN) or multiple trials, each of which had subtle differences in inclusion/exclusion criteria and treatment algorithms. Use of individual, patient-level data has the advantage of allowing the analytic protocol to be prespecified and also to properly capture the correlation between patient characteristics, costs, and outcomes that cannot be fully captured in decision-analytic models that are typically analyzed at the cohort level.
More importantly, however, ours is the first study to use contemporary epidemiological data as the source for long-term survival and cost estimates after stroke. Both of the previous studies have relied heavily on published data, much of which was derived from small epidemiological studies and models developed in the mid-1990s.22–27 Even after conversion to 2012 dollars, however, these historical cost estimates were >50% lower than our estimates, which were based on contemporary Medicare data. Indeed, substitution of the historical cost data for our base case values led to results that were similar to both previous studies—a modest increase in long-term costs with an ICER of ≈$5000 per QALY gained. Our poststroke life-expectancy estimates were also significantly greater than those in the 2 previous studies and likely reflect general improvements in poststroke care and survival that have occurred over the past 20 years. Of note, projected quality-adjusted life-expectancy with tPA in our study (6.8 QALYs) was similar to that estimated by Hong and Saver21 in a study based on patients enrolled in clinical trials of thrombolytic therapy for acute ischemic stroke (6.8 QALYs versus 5.9 disability-adjusted life years).
Limitations
This study should be considered in light of several limitations. Because SWIFT-PRIME was terminated early because of loss of equipoise and overwhelming efficacy, the sample size available for analyzing in-trial resource use, utilities, and mRS was smaller than originally planned. Nevertheless, there was sufficient power to demonstrate statistical significance for many key resources and cost measures. Second, our analysis was conducted from a US healthcare perspective although SWIFT-PRIME was an international trial. To address these issues, costs associated with the index procedures were developed from detailed resource use data that would not be expected to differ by country. Moreover, hospital length of stay and its associated costs were adjusted to US levels based on observed clinical outcomes; this approach effectively assumes that clinical outcomes with respect to stroke severity, complications, and the relative benefit of SST+tPA are consistent across healthcare systems. In support of this assumption, subgroup analyses demonstrated that findings were consistent across the US and non-US participants.
Third, extrapolation of long-term survival was based on 4-year follow-up of a secondary cohort of stroke survivors rather than the trial participants, themselves. Although it would have been optimal to follow clinical trial patients long-term to provide these estimates, this could not be practically be done in SWIFT-PRIME because informed consent specified that patients would only be followed up for 90 days after enrollment. Given this important limitation and recognizing that data on long-term survival and costs among 90-day stroke survivors were out of date, used data from an external cohort of stroke survivors with known mRS status at 90 days to estimate the parameters for a Markov model to provide these critical long-term projections. Because the mRS served as the anchor for long-term survival estimates and the external cohort was large (n=958), we believe that our approach better reflects survival patterns with contemporary stroke care compared older studies. Fourth, we assumed no further improvement in health status beyond 90 days in either treatment group—an assumption that cannot be tested with empirical data from the available trials. Previous research has shown that most functional recovery after ischemic stroke occurs in the first 90 days.28,29 In the few trials that have followed up stroke patients with moderate to severe residual deficits beyond 3 months (including the 2 NINDS [National Institute of Neurological Disorders and Stroke]-tPA trial), mRS levels were largely stable between 3 and 12 months.29 In addition, previously published cost-effectiveness analyses of neurothrombectomy have also been based on extrapolation from 90-day mRS.10,11 Finally, although we acknowledge that the specific population enrolled in SWIFT-PRIME (all of whom had large-vessel occlusion and received tPA) differs from the population used for our long-term projections, previous studies have demonstrated that the major driver of long-term healthcare costs after stroke is the degree of disability as assessed by 3-month mRS scores (mRS scores of 2, 3, 4, and 5).30
Conclusions
Based on data from the SWIFT-PRIME trial, for patients with acute ischemic stroke and confirmed large-vessel anterior circulation occlusion, mechanical thrombectomy using the solitaire stent retriever plus tPA is associated with higher initial treatment costs both in-hospital and over 90 days of follow-up. However, lifetime projections based on a combination of trial data and data from a large external cohort of stroke survivors demonstrated that the stent retriever strategy is an economically dominant strategy with substantial long-term cost savings and gains in both life-expectancy and quality-adjusted life-expectancy—results that were consistent in multiple sensitivity and subgroup analyses. These findings suggest that for patients similar to those enrolled in SWIFT-PRIME, a treatment strategy of SST+tPA is highly cost-effective and likely economically dominant compared with tPA.
Supplementary Material
Acknowledgments
The data reported here have been supplied by the Centers for Medicare & Medicaid Services (DUA27848). The interpretation and reporting of these data are the responsibility of the author(s) and in no way should be seen as an official policy or interpretation of the US government.
Sources of Funding
This study was supported by Medtronic, Inc (ClinicalTrials.gov number, NCT01657461).
Footnotes
Guest Editor for this article was Christopher L.H. Chen, FRCP.
The online-only Data Supplement is available with this article at http://stroke.ahajournals.org/lookup/suppl/doi:10.1161/STROKEAHA.116.014735/-/DC1.
Stroke is available at http://stroke.ahajournals.org
Disclosures
The University of California, Regents receives funding for Dr Saver’s services as a scientific consultant regarding trial design and conduct to Covidien and Stryker and is an employee of the University of California, which holds a patent on retriever devices for stroke. Dr Goyal serves as a consultant to Medtronic/Covidien, Stryker, Microvention and has a patent Systems of stroke diagnosis licensed to GE Healthcare. Drs Bonafe, Diener, Pereira, Hacke, Jansen, Mattle, and Lopes served as scientific consultants regarding trial design and conduct to Medtronic/Covidien. Dr Levy serves as a scientific consultant to Medtronic/Covidien, has shareholder/ownership interest with Intratech Medical Ltd, Blockade Medical LLC, has received fees from Abbott for carotid training, and has served as an expert witness for Renders Medical/Legal opinion. Dr Albers has an equity interest and is a consultant for iSchemaView, which provided the RAPID software and Core Laboratory services for the SWIFT-PRIME trial (Solitaire With the Intention for Thrombectomy as Primary Endovascular Treatment for Acute Ischemic Stroke) and has been a consultant for Medtronic. Dr Cognard serves as a scientific consultant to Medtronic/Covidien, Sequentiel, and Codman. Dr Jovin serves as a scientific consultant regarding trial design and conduct to Medtronic/Covidien and is on the advisory board for Silk Road Medical and Blockade Medical LLC. Dr Nogueira serves as a scientific consultant to Medtronic/Covidien, Stryker Neurovascular, and Penumbra. Dr Siddiqui has financial interests in StimSox, Valor Medical, Neuro Technology Investors, Cardinal Health, Medina Medical Systems, Buffalo Technology Partners, Inc, and International Medical Distribution Partners, serves as a consultant to Codman & Shurtleff, Inc, GuidePoint Global Consulting, Penumbra, Stryker, MicroVention, W.L. Gore & Associates, Three Rivers Medical, Corindus, Inc, Amnis Therapeutics, Ltd, CereVasc, LLC, Pulsar Vascular, The Stroke Project, Inc, Cerebrotech Medical Systems, Inc, Rapid Medical, Neuravi, Silk Road Medical, Rebound Medical, Intersocietal Accreditation Committee, Penumbra, 3D Separator trial, Covidien (Now Medtronic), and is part of the steering committee for SWIFT-PRIME and SWIFT DIRECT (Solitaire With the Intention for Thrombectomy Plus Intravenous t-PA Versus Direct Solitaire Stent-Retriever Thrombectomy in Acute Anterior Circulation Stroke) trials, MicroVention, FRED trial (Flow Redirection Intraluminal Device), CONFIDENCE study (Pivotal Study of the MicroVention, Inc, Carotid Artery Stent System Used in Conjunction With the Nanoparasol Embolic Protection System for the Treatment of Carotid Artery Stenosis in Patients at Elevated Risk for Adverse Events From Carotid Endarterectomy), LARGE trial (Long-Acting Beta Agonist Response by Genotype), POSITIVE trial (Perfusion Imaging Selection of Ischemic Stroke Patients for Endovascular Therapy), Penumbra COMPASS and INVEST (Minimally Invasive Endoscopic Surgery vs Medical Management in Supratentorial Intraparenchymal Hemorrhage) trials. Dr Yavagal serves as a scientific consultant to Medtronic/Covidien and Neuralanalytics, Inc. The University of California, Regents receives funding for Dr Jahan’s services as a scientific consultant regarding trial design and conduct to Medtronic/Covidien, and is an employee of the University of California, which holds a patent on retriever devices for stroke. The other authors report no conflicts.
References
- 1.Mozaffarian D, Benjamin EJ, Go AS, Arnett DK, Blaha MJ, Cushman M, et al. American Heart Association Statistics Committee and Stroke Statistics Subcommittee Heart disease and stroke statistics–2015 update: a report from the American Heart Association. Circulation. 2015;131:e29–e322. doi: 10.1161/CIR.0000000000000152. [DOI] [PubMed] [Google Scholar]
- 2.Demaerschalk BM, Hwang HM, Leung G. US cost burden of ischemic stroke: a systematic literature review. Am J Manag Care. 2010;16:525–533. [PubMed] [Google Scholar]
- 3.Brown DL, Boden-Albala B, Langa KM, Lisabeth LD, Fair M, Smith MA, et al. Projected costs of ischemic stroke in the United States. Neurology. 2006;67:1390–1395. doi: 10.1212/01.wnl.0000237024.16438.20. [DOI] [PubMed] [Google Scholar]
- 4.Berkhemer OA, Fransen PS, Beumer D, van den Berg LA, Lingsma HF, Yoo AJ, et al. MR CLEAN Investigators A randomized trial of intraarterial treatment for acute ischemic stroke. N Engl J Med. 2015;372:11–20. doi: 10.1056/NEJMoa1411587. [DOI] [PubMed] [Google Scholar]
- 5.Campbell BC, Mitchell PJ, Kleinig TJ, Dewey HM, Churilov L, Yassi N, et al. EXTEND-IA Investigators Endovascular therapy for ischemic stroke with perfusion-imaging selection. N Engl J Med. 2015;372:1009–1018. doi: 10.1056/NEJMoa1414792. [DOI] [PubMed] [Google Scholar]
- 6.Goyal M, Demchuk AM, Menon BK, Eesa M, Rempel JL, Thornton J, et al. ESCAPE Trial Investigators Randomized assessment of rapid endovascular treatment of ischemic stroke. N Engl J Med. 2015;372:1019–1030. doi: 10.1056/NEJMoa1414905. [DOI] [PubMed] [Google Scholar]
- 7.Jovin TG, Chamorro A, Cobo E, de Miquel MA, Molina CA, Rovira A, et al. REVASCAT Trial Investigators Thrombectomy within 8 hours after symptom onset in ischemic stroke. N Engl J Med. 2015;372:2296–2306. doi: 10.1056/NEJMoa1503780. [DOI] [PubMed] [Google Scholar]
- 8.Saver JL, Goyal M, Bonafe A, Diener HC, Levy EI, Pereira VM, et al. SWIFT PRIME Investigators Stent-retriever thrombectomy after intravenous t-PA vs. t-PA alone in stroke. N Engl J Med. 2015;372:2285–2295. doi: 10.1056/NEJMoa1415061. [DOI] [PubMed] [Google Scholar]
- 9.Goyal M, Menon BK, van Zwam WH, Dippel DW, Mitchell PJ, Demchuk AM, et al. HERMES Collaborators Endovascular thrombectomy after large-vessel ischaemic stroke: a meta-analysis of individual patient data from five randomised trials. Lancet. 2016;387:1723–1731. doi: 10.1016/S0140-6736(16)00163-X. [DOI] [PubMed] [Google Scholar]
- 10.Ganesalingam J, Pizzo E, Morris S, Sunderland T, Ames D, Lobotesis K. Cost-utility analysis of mechanical thrombectomy using stent retrievers in acute ischemic stroke. Stroke. 2015;46:2591–2598. doi: 10.1161/STROKEAHA.115.009396. [DOI] [PMC free article] [PubMed] [Google Scholar]
- 11.Leppert MH, Campbell JD, Simpson JR, Burke JF. Cost-effectiveness of intra-arterial treatment as an adjunct to intravenous tissue-type plasminogen activator for acute ischemic stroke. Stroke. 2015;46:1870–1876. doi: 10.1161/STROKEAHA.115.009779. [DOI] [PMC free article] [PubMed] [Google Scholar]
- 12.Anderson JL, Heidenreich PA, Barnett PG, Creager MA, Fonarow GC, Gibbons RJ, et al. ACC/AHA Task Force on Performance Measures; ACC/AHA Task Force on Practice Guidelines ACC/AHA statement on cost/value methodology in clinical practice guidelines and performance measures: a report of the American College of Cardiology/American Heart Association Task Force on Performance Measures and Task Force on Practice Guidelines. Circulation. 2014;129:2329–2345. doi: 10.1161/CIR.0000000000000042. [DOI] [PubMed] [Google Scholar]
- 13.Saver JL, Goyal M, Bonafe A, Diener HC, Levy EI, Pereira VM, et al. SWIFT PRIME Investigators Solitaire™ With the Intention for Thrombectomy as Primary Endovascular Treatment for Acute Ischemic Stroke (SWIFT PRIME) trial: protocol for a randomized, controlled, multicenter study comparing the Solitaire revascularization device with IV tPA with IV tPA alone in acute ischemic stroke. Int J Stroke. 2015;10:439–448. doi: 10.1111/ijs.12459. [DOI] [PMC free article] [PubMed] [Google Scholar]
- 14.Weinstein MC, Siegel JE, Gold MR, Kamlet MS, Russell LB. Recommendations of the panel on cost-effectiveness in health and medicine. JAMA. 1996;276:1253–1258. [PubMed] [Google Scholar]
- 15.Cohen DJ, Krumholz HM, Sukin CA, Ho KK, Siegrist RB, Cleman M, et al. In-hospital and one-year economic outcomes after coronary stenting or balloon angioplasty. Results from a randomized clinical trial. Stent Restenosis Study Investigators. Circulation. 1995;92:2480–2487. doi: 10.1161/01.cir.92.9.2480. [DOI] [PubMed] [Google Scholar]
- 16.Mitchell JB, McCall NT, Burge FT, Boyce S, Dittus R, Heck D, et al. Per Case Prospective Payment for Episodes of Hospital Care. Health Economics Research, Inc; 1995. NTIS RB95-226023. [Google Scholar]
- 17.Hankey GJ, Spiesser J, Hakimi Z, Bego G, Carita P, Gabriel S. Rate, degree, and predictors of recovery from disability following ischemic stroke. Neurology. 2007;68:1583–1587. doi: 10.1212/01.wnl.0000260967.77422.97. [DOI] [PubMed] [Google Scholar]
- 18.Magnuson EA, Farkouh ME, Fuster V, Wang K, Vilain K, Li H, et al. FREEDOM Trial Investigators Cost-effectiveness of percutaneous coronary intervention with drug eluting stents versus bypass surgery for patients with diabetes mellitus and multivessel coronary artery disease: results from the FREEDOM trial. Circulation. 2013;127:820–831. doi: 10.1161/CIRCULATIONAHA.112.147488. [DOI] [PMC free article] [PubMed] [Google Scholar]
- 19.Reynolds MR, Magnuson EA, Wang K, Lei Y, Vilain K, Walczak J, et al. PARTNER Investigators Cost-effectiveness of transcatheter aortic valve replacement compared with standard care among inoperable patients with severe aortic stenosis: results from the placement of aortic transcatheter valves (PARTNER) trial (Cohort B) Circulation. 2012;125:1102–1109. doi: 10.1161/CIRCULATIONAHA.111.054072. [DOI] [PubMed] [Google Scholar]
- 20.van Hout B, Janssen MF, Feng YS, Kohlmann T, Busschbach J, Golicki D, et al. Interim scoring for the EQ-5D-5L: mapping the EQ-5D-5L to EQ-5D-3L value sets. Value Health. 2012;15:708–715. doi: 10.1016/j.jval.2012.02.008. [DOI] [PubMed] [Google Scholar]
- 21.Hong KS, Saver JL. Years of disability-adjusted life gained as a result of thrombolytic therapy for acute ischemic stroke. Stroke. 2010;41:471–477. doi: 10.1161/STROKEAHA.109.571083. [DOI] [PubMed] [Google Scholar]
- 22.Samsa GP, Reutter RA, Parmigiani G, Ancukiewicz M, Abrahamse P, Lipscomb J, et al. Performing cost-effectiveness analysis by integrating randomized trial data with a comprehensive decision model: application to treatment of acute ischemic stroke. J Clin Epidemiol. 1999;52:259–271. doi: 10.1016/s0895-4356(98)00151-6. [DOI] [PubMed] [Google Scholar]
- 23.Caro JJ, Huybrechts KF. Stroke treatment economic model (STEM): predicting long-term costs from functional status. Stroke. 1999;30:2574–2579. doi: 10.1161/01.str.30.12.2574. [DOI] [PubMed] [Google Scholar]
- 24.Chambers MG, Koch P, Hutton J. Development of a decision-analytic model of stroke care in the United States and Europe. Value Health. 2002;5:82–97. doi: 10.1046/j.1524-4733.2002.52011.x. [DOI] [PubMed] [Google Scholar]
- 25.Earnshaw SR, Joshi AV, Wilson MR, Rosand J. Cost-effectiveness of recombinant activated factor VII in the treatment of intracerebral hemorrhage. Stroke. 2006;37:2751–2758. doi: 10.1161/01.STR.0000246611.21999.5d. [DOI] [PubMed] [Google Scholar]
- 26.Oster G, Huse DM, Lacey MJ, Epstein AM. Cost-effectiveness of ticlopidine in preventing stroke in high-risk patients. Stroke. 1994;25:1149–1156. doi: 10.1161/01.str.25.6.1149. [DOI] [PubMed] [Google Scholar]
- 27.Reed SD, Blough DK, Meyer K, Jarvik JG. Inpatient costs, length of stay, and mortality for cerebrovascular events in community hospitals. Neurology. 2001;57:305–314. doi: 10.1212/wnl.57.2.305. [DOI] [PubMed] [Google Scholar]
- 28.Cramer SC. Repairing the human brain after stroke: I. Mechanisms of spontaneous recovery. Ann Neurol. 2008;63:272–287. doi: 10.1002/ana.21393. [DOI] [PubMed] [Google Scholar]
- 29.Saver JL, Gornbein J, Starkman S. Graphic reanalysis of the two NINDS-tPA trials confirms substantial treatment benefit. Stroke. 2010;41:2381–2390. doi: 10.1161/STROKEAHA.110.583807. [DOI] [PMC free article] [PubMed] [Google Scholar]
- 30.Smith WS, Lev MH, English JD, Camargo EC, Chou M, Johnston SC, et al. Significance of large vessel intracranial occlusion causing acute ischemic stroke and TIA. Stroke. 2009;40:3834–3840. doi: 10.1161/STROKEAHA.109.561787. [DOI] [PMC free article] [PubMed] [Google Scholar]
Associated Data
This section collects any data citations, data availability statements, or supplementary materials included in this article.