Abstract
Lipid-stabilized nanoemulsions containing a volatile liquid perfluorocarbon core have been studied as ultrasound contrast agents owing to their ability to transform into high-contrast microbubbles when subjected to high intensity focused ultrasound (HIFU). However, while there have been several studies on the effect of acoustic parameters on contrast, the effect of the droplet’s stabilizing shell has not been studied as extensively. Inspired by previous studies showing lateral phase separation in microbubbles and vesicles, nanodroplets were formulated with a perfluorohexane core and a shell composed of varying amounts of saturated (DPPC) phospholipids, unsaturated (DOPC) phospholipids, and cholesterol, which were fractionated to obtain nanodroplets of mean diameter 300–400 nm and were stable over one week. When the DOPC content was increased to 40 mol%, ultrasound contrast increased by about one order of magnitude over DPPC-only droplets. Based on fluorescence microscopy results of lateral lipid phase separation on the droplet surface, the various combinations of DPPC, DOPC, and cholesterol were assigned to three regimes on the ternary phase diagram: solid-liquid ordered (low contrast), liquid ordered-liquid disordered (medium contrast), and solid-liquid disordered (high contrast). These regimes were confirmed by TEM analysis of nanoscale droplets. Droplets containing mixed lipid monolayers were also found to produce a significantly greater yield than single-component droplets. The discovery of the dependence of acoustic response on lipid phase separation will help to understand the formulation, behavior, and vaporization mechanism of acoustically-responsive nanoemulsions.
1. Introduction
In recent decades, ultrasound contrast agents have been at the forefront of research in non-invasive medical imaging and therapy.1 These agents are typically gas-filled bodies, or microbubbles, capable of resonating at clinical ultrasound frequencies while undergoing non-linear contraction and expansion.2 While polymer and lipid-stabilized microbubbles have been adapted for wide-ranging applications in targeted molecular imaging,3 cell sonoporation,4 and drug and gene delivery,5 injected microbubbles are restricted to the intravascular areas in the body owing to their micron-range diameters. Instead, phase-shift nanoemulsions typically possess diameters on the order of hundreds of nanometers and have shown accumulation in some tumor tissues due to the EPR effect.6–8 These nanoemulsions consist of a core of a volatile perfluorocarbon liquid encapsulated in a lipid/polymer shell. In their liquid state, the emulsions have negligible nonlinear acoustic contrast on account of the relatively incompressible liquid core. Application of high intensity focused ultrasound (HIFU) can cause the internal phase to vaporize and form metastable microbubbles, and thus creating significant ultrasound contrast in situ. However, vaporization must be well-controlled: although PFP nanoemulsions underwent Phase III clinical trials, one of the reasons why the study was withdrawn was because of the increased occurrences of droplet growth due to Ostwald ripening and subsequent undesired “boiling” before injection.2
While there have been numerous studies on the synthesis,9,10 applications,11 and mechanism of droplet vaporization,12,13 the phase behavior of the droplet shell structure and its potential effect on its contrast utility has to this date been largely unexamined. Most phase shift nanodroplets are stabilized by a either single type of phospholipid, doped with polymer-lipid conjugates for stability, or are formulated entirely from block copolymers.14 A recent study by Borden and coworkers suggested that the composition of the lipid monolayer, specifically the length of the lipid acyl chains, could play a role in temperature-dependent perfluorocarbon nanodroplet vaporization.15 However, to the best of our knowledge, the effect of mixed lipids on droplet vaporization has not yet been studied.
Here, we hypothesized that introducing mixed lipid monolayers would facilitate perfluorocarbon nanodroplet vaporization by introducing surface roughness, decreasing monolayer rigidity, or both. To test the effects of mixed lipids on droplet vaporization, droplets were formulated with a monolayer consisting of saturated lipid, unsaturated lipid, and cholesterol, as DPPC:DOPC:Cholesterol has been well studied in the past due to its ability to mimic cell membranes.16 Previous works have identified a wide range of phase behavior associated with the lipid bilayer of mixed lipids, in which the lipids phase separate into domains with different tail packing densities.16,17 Coexisting phases in a bilayer or monolayer can broadly be classified into ‘solid’ and ‘liquid’, the latter commonly sub-divided into liquid-crystalline (liquid-ordered, Lo) and liquid-expanded (liquid-disordered, Ld) phases.18–20 In addition, cholesterol, which is associated with the formation of lipid rafts, provides access to numerous lateral phases for study.21–23 Though most of these studies have been conducted on bilayers, it has been shown that the liquid-liquid coexistence pattern of immiscible phases is similar in monolayers below the phase transition temperature of DPPC.24,25
In the present study, we report the phase behavior of mixed lipid monolayers and its effect on the acoustic response of perfluorohexane (PFH) nanodroplets. While perfluoropentane (PFP, Tb = 29°C) is a more common nanodroplet internal phase due its lower vaporization threshold, we found that PFH droplets were not only more stable but also provided a greater variation of acoustic signal over a smaller range of incident intensities.26 This combination of stability and control over vaporization has led to the increasing use of PFH nanodroplets for in vitro and in vivo applications, including conventional ultrasound theranostics,27,28 and photoacoustic imaging29 and therapy.30 Here, the variation of acoustic responses of droplets with varying monolayer compositions was correlated to the phase behavior on the droplet. The resulting observations provide a theoretical framework for explaining large increases in acoustic contrast for specific formulations, as presented below.
2. Materials and Methods
2.1. Materials
1,2-palmitoyl-sn-glycero-3-phosphocholine (DPPC), 1,2-dioleoyl-sn-glycero-3-phosphocholine (DOPC), 1,2-distearoyl-sn-glycero-3-phosphoethanolamine-N-[methoxy(polyethylene glycol)-2000] (ammonium salt) (DSPE-PEG2000), and 1,2-dioleoyl-sn-glycero-3-phosphoethanolamine-N-(lissamine rhodamine B sulfonyl) (ammonium salt) (RhB-DPPE) were purchased from Avanti Polar Lipids, Inc. (Alabaster, AL). Cholesterol was obtained from Alfa Aesar (Haverhill, MA), while perfluorohexane (PFH) was purchased from Strem Chemicals, Inc. (Newburyport, MA). Other materials used included chloroform, from Fisher Scientific (Pittsburgh, PA), and Tris buffered saline (TBS) from Quality Biological Inc. (Gaithersburg, MD). Uranyl acetate was provided by Electron Microscopy Sciences (Hatfield, PA), and potassium permanganate was obtained from Sigma Aldrich (St. Louis, MO).
2.2. Formulation and Imaging of Nanodroplets
Stock solutions of varying amounts of hydrated DPPC, DOPC, and cholesterol were prepared following a general procedure described previously.26 Each stock solution was mixed with DSPE-PEG2000 to make a final lipid/PEG concentration of 1.3 mM/40 μM, in TBS, and stirred at 75°C for 30 min. The lipid-PEG suspension was then allowed to cool to RT. 40 μL of PFH was added per mL of the lipid solution to make a 4 v/v % mixture. Using a probe sonicator (Branson SLPe, Branson Ultrasonics, Danbury, CT), the solution was sonicated 1 mL at a time, with a 2 min cycle of 1s on-9s off bursts at 70% amplitude while immersing the solution in an ice bath. For liposome preparation, the lipid-PEG suspension was probe-sonicated under the same conditions without PFH.
Following this, the emulsion was centrifuged at 400 g for 1.5 min, and the supernatant was centrifuged at 1000 g for 2.5 min. The pellet obtained was resuspended in an appropriate amount of TBS to reach the desired droplet concentration. Droplet size distribution and concentration was determined through Nanoparticle Tracking Analysis using a NanoSight LM10 setup (Malvern Instruments Ltd., WR, United Kingdom). For long-term stability studies, resuspended droplets were stored in a glass vial purged with argon, and the size distributions were measured intermittently for seven days from preparation.
2.3. Ultrasound Contrast Imaging and Analysis
For ultrasound imaging studies, a setup similar to that described in a previous study was used (Figure 1).26 Briefly, a spherically focused, single-element, High Intensity Focused Ultrasound (HIFU) transducer (Sonic Concepts H101, 64.0 mm Active Diameter × 63.2 mm Radius of Curvature; Sonic Concepts Inc., Bothell, WA) was equipped with a coupling cone (Sonic Concepts C101) filled with degassed and deionized water, with the transducer and core submerged in a water tank with dimensions 0.44 m × 0.29 m × 0.15 m. The HIFU transducer was connected to a 30 MHz Function/Arbitrary Waveform Generator (Agilent Technologies, Englewood, CO) via an AG Series Amplifier (T&C Power Conversion, Inc., Rochester, NY), the latter operating at 100% output throughout the study, the peak negative pressure of which was measured to be 9.8 MPa, as determined by calibration via hydrophone in free field (Onda Corp., Sunnyvale CA).
Figure 1.
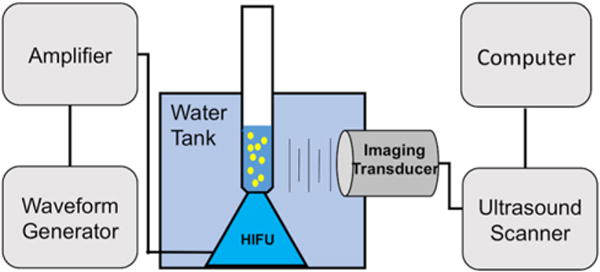
Schematic of ultrasound setup.
In a typical experiment, PFH nanodroplets were diluted to a concentration of approximately (1.3±0.5)×1010 droplets mL−1 in TBS to a final volume of 1 mL per sample. Liposomes, when used, were diluted to 1 mL for a 10 μL probe-sonicated sample. The dilute sample was taken in a plastic pipette bulb positioned on top of the coupling cone to ensure proper HIFU focusing into the center of the sample, while a 4V1 transducer (Acuson) was aligned to acquire horizontal cross-sectional images of the sample while minimizing direct exposure to HIFU, as shown in Figure 1. The function generator was set to produce pulses at 1 Vpp, 1 MHz center frequency, 10 cycles with 0.1 s pulse interval (10 Hz). Videos were recorded simultaneously in real time by a Siemens Acuson Sequoia™ C512 scanner operating in Cadence Pulse Sequencing mode at 1.5 MHz and a mechanical index (MI) of 0.19, which is consistent with non-destructive microbubble imaging at MI < 0.3.31,32 Videos were captured about 10–15 min after droplet preparation. The total HIFU exposure was 15 s, at 30 fps, to use 450 frames to get the average intensity, and was the same for all formulations.
Post-capture video analysis was performed via a code written in MATLAB (Mathworks, Inc.) For a given video, first a primary region of interest (ROI) was selected inside the sample holder from a frame in the video that displayed no sample signal, and the mean brightness value of this frame was set as the reference value for each successive frame brightness. A secondary ROI was selected upwards in the frame to eliminate frames containing signal contributions from HIFU pulse interference ‘bands’ within successive frames of the primary ROI. Each remaining frame was cropped to the primary ROI and converted to grayscale. The mean brightness values of all remaining frames were used to obtain an integrated intensity value over the entire span of the video.
2.4. Fluorescence Microscopy
For fluorescence microscopy, 1 mol% RhB-DPPE was added while preparing the original DPPC-DOPC-Cholesterol stock solution. Also, larger droplets (>2um) were necessary to discern the characteristics of the droplet shell. To obtain larger droplets, the original sonicated PFH emulsion was centrifuged at 50 g, following which the supernatant was discarded and the pellet was resuspended in TBS for fluorescence imaging in an epifluorescence mode through a red channel using an Axio Imager A2 microscope (Zeiss). To check whether HIFU has any observable effect on the droplet shell structure, larger droplets were imaged under fluorescence excitation before and after application of HIFU. All images were captured approximately 10 min after droplet formulation. Images and videos were contrast-enhanced for better resolution of fluorescence distribution.
2.5. Transmission Electron Microscopy
To prepare samples for TEM imaging, diluted samples were reacted on a plasma-cleaned TEM grid with 1 w/v% potassium permanganate for 1 min. After washing with water, the sample was then stained with 1 w/v% uranyl acetate solution for 1 min, and air-dried thereafter. Images were taken using a CM 100 (Philips) microscope, operating at 80 kV.
3. Results and Discussion
3.1. Variation of Shell Composition
Since the overall hypothesis of this work is that changes in lipid composition will produce differences in ultrasound contrast caused by the droplet, several ternary mixtures of DPPC, DOPC, and cholesterol were formulated along with 3 mol% DSPE-PEG2000 for steric stabilization. Larger compositions of cholesterol were avoided to maintain stability: above the solubility limit of cholesterol in lipid layers of around 40 mol%, crystallites may form that lead to irregularities in the shell.33 Lipid films formed out of each formulation were reconstituted in TBS followed by the addition of 4 v/v% perfluorohexane (PFH) and subsequent probe sonication to form the emulsions.
Consistency in droplet size across different formulations was important for comparing vaporization of droplets because large droplets are expected to vaporize more easily due to reduced Laplace pressure.26 In order to obtain similar size ranges across different formulations, larger droplets were pelleted out at 400 g, and smaller droplets obtained within the supernatant were characterized using Nanoparticle Tracking Analysis (NTA, Malvern). Since the shell contributes negligibly to the total mass of a droplet compared to the perfluorohexane (PFH) internal phase, similar centrifugation conditions were expected to produce similar size distributions irrespective of the shell composition. NTA analysis of droplets prepared with all different shell compositions revealed that while the concentration yield was different for each composition, the mean diameter and size distributions were similar for all formulations (Figure 2, Figure S1, Table S1).
Figure 2.
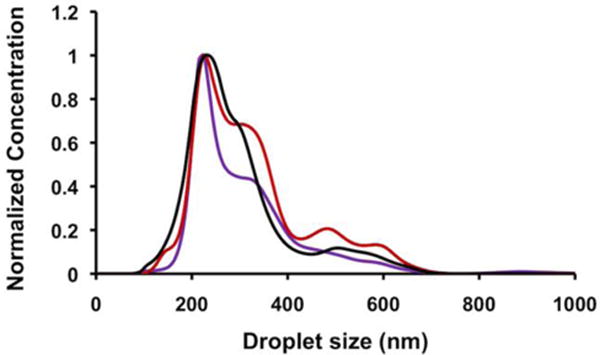
Normalized size distributions of 400 g fractionated PFH droplets for representative monolayer compositions (purple: 100:0:0; black: 60:30:10; red: 47.5:47.5:5).
3.2. Acoustic Response of Droplets with a Ternary Lipid Mixture under HIFU Exposure
Based on our previous study, a concentration in the range of 109–1010 droplets per mL would be optimal for comparing droplet lipid compositions.26 However, the variation in ultrasound signal caused by the metastable bubbles was not linear with change in DOPC or cholesterol fractions (Figure 3). For instance, 30 mol% or lower DOPC concentrations produced low-to-medium response, while 40–50 mol% DOPC enhanced the response by at least one order of magnitude (note: percentages are for lipids only and do not include DSPE-PEG2000). On the other hand, 40% cholesterol, even with 10 mol% DOPC, produced only an increase of ~2.5× in signal as compared to 100:0:0 DPPC:DOPC:Chol. For comparison, suspensions of 100:0:0 and 47.5:47.5:5 were sonicated without PFH in TBS and produced no detectable response (Figure S3). While a low response from 100:0:0 droplets might be expected due to their predominantly solid monolayer phase (see below), the effect of DOPC, cholesterol, and PEG-2000 composition required further exploration, which is detailed below.
Figure 3.
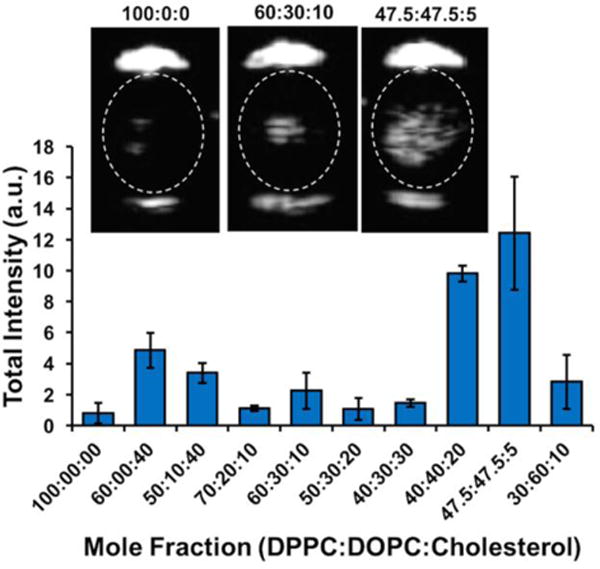
Ultrasound signal recorded from 300–400 nm mean diameter PFH droplets with different monolayer compositions during HIFU exposure; Inset: ultrasound images of representative composition droplets (left to right: 100:0:0, 60:30:10, 47.5:47.5:5).
3.3. Fluorescent Microscopy of Droplets with Ternary Shell Compositions
Lateral phase behavior in the lipid monolayers surrounding the droplets was first examined by fluorescence microscopy of 1 mol% Lissamine rhodamine B-DPPE (RhB-DPPE) incorporated into the lipid film prior to hydration.34 Although for clinical imaging droplets should be maintained at diameters smaller than 700 nm for potential penetration into an extravascular environment,11,35 lateral lipid phase separation cannot be observed optically in this size regime. Therefore, the droplets were pelleted and collected at 50 g instead of fractionated at 400 g to isolate the largest droplets. These droplets with diameters >1 μm were imaged for distribution of fluorescence. Representative images obtained for the majority droplet structure in each case are shown in Figure 4(a–j). Based on these results, we have classified the phase separation in these systems into roughly the following regions (Figure 4k):
Figure 4.

a–k: Fluorescence microscopy images of 50 g PFH droplets with shells of different compositions (mol% DPPC:DOPC:Cholesterol), 100:0:0 (a), 60:0:40 (b), 50:10:40 (c), 70:20:10 (d), 60:30:10 (e), 50:30:20 (f), 40:30:30 (g), 40:40:20 (h), 47.5:47.5:5 (i), and 30:60:10 (j). Scale bar: 5 μm; k: Sketch of ternary compositions of monolayers, showing S-Lo (I), Lo-Ld (II), and S-Ld (III) regions.
S-LO (solid-liquid ordered phase coexistence): Absence of either DOPC or cholesterol causes the RhB-DPPE to be expelled from the solid DPPC phase and localize in the LO DSPE-PEG2000 phase. A similar effect was previously observed for DPPC and DSPE-PEG2000 shell perfluorobutane microbubbles,25 in which the PEG2000 causes steric disruption in the DSPE layer, leading to a fluid but ordered phase. Because lipid-dye conjugates (such as Texas Red-DPPE) cannot adequately fit between the DPPC chains, it preferentially associates with the DSPE-PEG2000.34 As can be seen from Figure 4a, the domains obtained for 100:0:0 were almost consistently polygonal with equal 60° angles at each vertex. This is represented in Figure 4k as Region I.
The effect of varying the concentration of DSPE-PEG2000 with respect to DPPC was studied as well. PEG-lipids are generally added to lipid-shelled agents for imaging and drug delivery to both provide steric stabilization and resist opsonization. To study the effect of PEG on phase separation in the monolayer, increasing PEG concentrations were added to the stock lipid solutions to formulate droplets. Previously, it was shown that increasing DSPE-PEG2000 concentration in a microbubble shell increases lateral phase separation.25 A similar trend was observed for the nanodroplets used in this study. In the aforementioned droplet samples, 3 mol% DSPE-PEG2000 was employed. Increasing DSPE-PEG2000 concentration to 10 mol% and 20 mol% led to a monolayer resembling a S-Ld coexistence region (as detailed later), with the RhB-DPPE dye being repelled by small, irregular, scattered, dark solid areas (Figure 5). These results support the assignment of the S-Ld coexistence in the 3 mol% DSPE-PEG2000 samples. Droplets formulated without DSPE-PEG2000 were inherently unstable and settled down by forming aggregates (Figure S4).
Figure 5.

Phase behavior in 100:0:0 droplet monolayer as a function of increasing DSPE-PEG2000 concentration: 3 mo% (a), 10 mol% (b), and 20 mol% (c). Scale bar: 5 μm.
LO-Ld (liquid ordered-liquid disordered phase coexistence): The majority of droplets for the compositions 70:20:10, 60:30:10, 40:30:30, and 50:30:20, or Region II (Figure 4k), showed varying degrees of localization of dye at the droplet interface. The dye localization likely occurs within the unsaturated lipid-rich phase; this assignment is evident from the increasing bright area with increasing DOPC fraction. Since these images were captured 10–15 min after droplet preparation (similar to the timeline followed for recording acoustic response during HIFU treatment), it is possible that the peripheral bright areas are a result of ripening of dark LO domains as a result of mutual collisions, leading to a larger dark region. High cholesterol concentrations (50:10:40 and 60:0:40) limit the Lo phase to highly concentrated regions, edging closer to a one-liquid phase.
S-Ld (solid-liquid disordered phase coexistence): As the concentration of the unsaturated lipid is increased further, the solid and liquid phases separate without mixing, resulting in the formation of scattered, dark solid domains. Region III (Figure 4k). These domains are evident in the 47.5:47.5:5 and 40:40:20 mixtures as tiny dark spots visible under fluorescence surrounded by a uniform distribution of the dye indicating a relatively continuous liquid phase. Unlike the liquid-liquid coexistence region, these domains do not appear to ripen further after 10–20 min. Addition of excess DSPE-PEG2000 (20 mol%) resulted in a similar overarching distribution of the dye, albeit in a more diffuse manner, resulting in a more continuous liquid phase (Figure S5).
One-Liquid phase: At high unsaturated lipid concentrations (30:60:10, Figure 4j), and possibly at very high cholesterol compositions, the dye spreads uniformly throughout the monolayer, indicating the lack of domain formation and the presence of a single, continuous liquid phase.
The above phase classifications are given as the majority species for each sample; however, due to the dynamic nature of the shell formulation and existence, some droplets in each image exhibit a different apparent phase. For instance, a few droplets in the LO-Ld coexistence region (Region II, Figure 4j) showed large dark domains on a bright background. These droplets are likely to be indicative of initial stages of domain ripening, in which the dark LO phase areas collide with each other (SI Video 1), resulting in a final state as shown in Figure 4(a–j). Images of different single droplets representing different phases for a representative composition (60:30:10) are shown in Figure 6: these images likely denote the various stages of domain ripening for droplets exhibiting LO-Ld coexistence. In contrast, droplets in the S-Ld coexistence region also contains highly mobile dark domains (SI Video 2), but instead of ripening, these solid segments remain as isolated areas in an otherwise expanded liquid phase.
Figure 6.
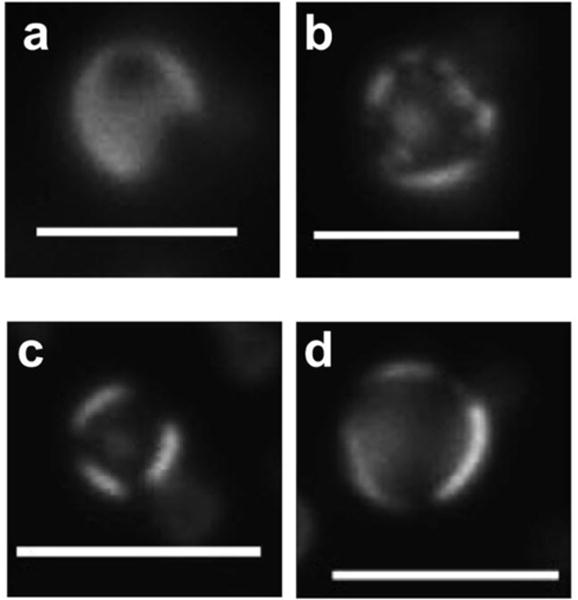
Different droplets depicting possible domain ripening (from a–d) in a representative liquid-liquid coexistence sample (60:30:10). Scale bar: 5 μm.
Also, to ascertain that small alterations of ambient temperature did not affect monolayer phase behavior, 100:0:0 droplets were either heated at 37°C for 30 min or cooled in an ice-water bath for 15 min, followed by fluorescence microscopy. The presence of polygonal domains was much the same (Figure S6). While kinetics of domain formation may be affected in a time scale of seconds or a few minutes, the final dynamic state of the monolayer thus reached was seen to be independent of temperature (below the phase-transition of the major lipid component), which would therefore not affect the acoustic response of the droplets to HIFU. In addition, fluorescence microscopy of larger 100:0:0 droplets after HIFU showed no significant alteration in shell structure (data not shown), likely because the droplets affected by HIFU were vaporized and subsequently destroyed, preventing them from being imaged after HIFU treatment.
3.4. TEM Analysis
While optical microscopy is instrumental for depicting phase behavior on the droplet shell, it is only able to resolve features on microdroplets, and thus it is not possible to distinguish lipid domains on a 300–400 nm diameter droplet. TEM was thus conducted to examine the shell properties of droplets on this scale. Droplets were prepared as for the ultrasound studies, then stained with both 1 w/v% KMnO4 and 1 w/v% UOAc as an alkene stain and negative stain, respectively. Since droplets were imaged under standard high vacuum TEM conditions, the vacuum was expected to vaporize the PFH interior, leaving a hollow shell. Solid shells were expected to maintain their shape but liquid domains would not, leading to collapse of these lipid monolayers. Three compositions were tested to support this hypothesis: 100:0:0 (S-Lo), 60:30:10 (Lo-Ld), and 47.5:47.5:5 (S-Ld) (Figure 7, Figure S7). The S-Lo region, due to the overbearing presence of a solid phase, shows a uniform texture throughout, due to its relatively rigid shell avoiding a drastic collapse. The Lo-Ld droplet shells collapse in their entirety, leading to ‘pancake’-like images, showing a relatively faint difference in resolution. However, in the S-Ld regime the liquid phase in the monolayer appears to collapse selectively as compared with the solid phase. This liquid phase should be more rich in DOPC and cholesterol and thus appears darker accordingly due to selective staining by KMnO4.
Figure 7.
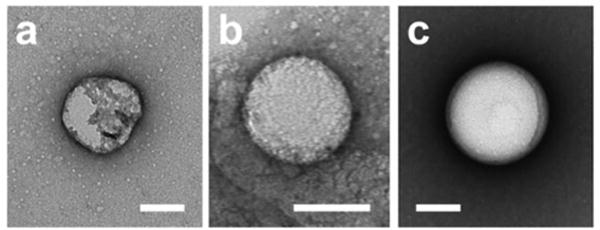
TEM images of PFH droplets of representative monolayer compositions (mol% DPPC:DOPC:Cholesterol): 47.5:47.5:5 (a), 60:30:10 (b), 100:0:0 (c). Scale bar = 100 nm.
3.5. Correlation of Phase Behavior with Acoustic Response to HIFU
The extent of phase separation observed in the droplet monolayer provides a correlation of lipid structure with the droplets’ acoustic response to HIFU. The presence of solid areas in a S-Ld coexistence likely allows for presence of numerous nucleation sites of a combined high surface area for easier vaporization of the internal liquid phase. Similarly, an increased concentration of unsaturated lipid (40 mol% or more) contributes to a decrease in the overall rigidity of the shell monolayer. These two effects together may facilitate the easier vaporization of droplets with lipid compositions such as 47.5:47.5:5 and 40:40:20. However, a lower response from the 30:60:10 droplets would seem to indicate that solid heterogeneities in the monolayer is the predominant factor for easier boiling of the internal PFC phase. The relatively high response of the compositions 50:10:40 and 60:0:40 are outliers in this scheme. Formulations with high cholesterol content were found to create droplets with high size dispersity and low stability, and thus increased signal was likely due to spontaneous coalescence into larger droplets (Figure S2) rather than phase behavior. In addition, while high cholesterol concentrations produced a disordered phase, the line tension is also correspondingly lowered, leading to instability (lowering of concentration) over time. Similarly, increasing PEG concentrations also increased acoustic response. In studying the acoustic response for 100:0:0 droplets (with 3, 10, and 20 mol% PEG concentration) of similar size and concentration to HIFU (Figure S8a), the signal was found to increase significantly for a 20 mol% DSPE-PEG2000 concentration, in keeping with what was expected for a S-Ld region sample (Figure S8b, Figure 5c).
3.6. Utilization of Mixed Lipid Droplets as a More Efficient Ultrasound Contrast Agent
The above observations support the use of mixed-lipid nanodroplets as ultrasound contrast agents. A droplet shell consisting of a 1:1 ratio of saturated and unsaturated lipids along with a low amount of cholesterol appears to have several empirical advantages over a droplet shell composed mainly of lipid. For comparison, the 47.5:47.5:5 droplets had a similar size range as that of the 100:0:0 sample (Figure S1), but its acoustic response is about one order of magnitude higher (Figure 3) at the same concentration. This difference in acoustic response is particularly pronounced at the perceived threshold of vaporization (9.8 MPa, 10 cycles) (Figure S9). It should be noted that the acoustic response to HIFU interrogation is concentration dependent, and an excess amount of droplets produces a high response regardless of the shell composition, while a low droplet number produces negligible signal. However, for these formulations there is a large window of about two orders of magnitude of concentration in which 47.5:47.5:5 droplets produce a greater response than 100:0:0 droplets (Figure 8a). In addition, samples containing unsaturated lipids produced a larger yield of fractionated droplets (300–400 nm) than samples with DPPC only (Figure 8b), which could be useful for scaling up nanodroplet production. We ascribe the increased yield to both increased lipid mobility and the heterogeneity of lipid tail packing motifs, which allows formation of a lower energy shell structure. DPPC packs tightly in the monolayer, causing the DSPE-PEG to phase-separate, but prefers a planar structure.36 Addition of DOPC likely helps to break up the crystalline plane and domains, which reduces the energy required to induce curvature in the monolayer.37,38 Finally, 47.5:47.5:5 samples exhibit similar stability profiles as 100:0:0 droplets (Figure 8c–d, Figure S10): only a slight decrease in mean diameter and concentration were observed over a period of one week, most likely due to diffusion of the internal PFH phase from the droplet and evaporation from the sample.
Figure 8.
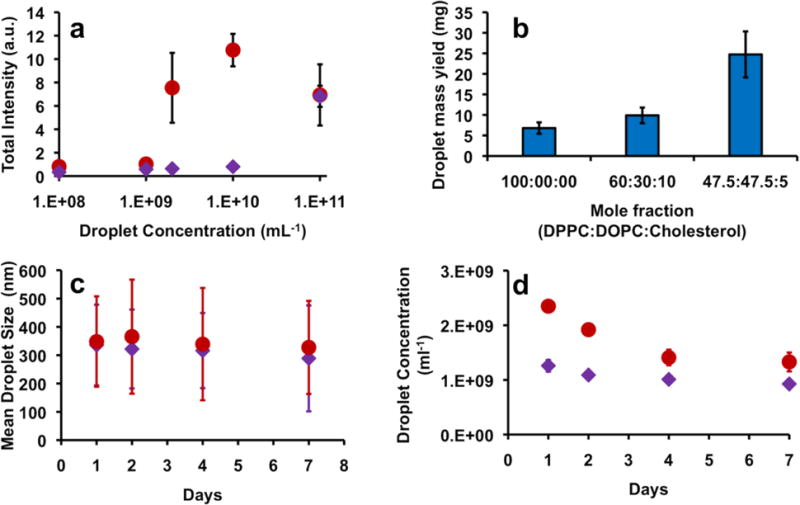
(a) Ultrasound signal recorded during HIFU interrogation from 300–400 nm (mean diameter) PFH droplets, formulated out of 100:0:0 (purple diamonds) and 47.5:47.5:5 (red circles) compositions; (b) Mass yield of 300–400 nm mean diameter droplets for representative shell compositions; (c–d): Progression of mean size (c) and concentration (d) over time for fractionated PFH droplets stored at 2–8°C – 100:0:0 (purple diamonds) and 47.5:47.5:5 (red circles). Error bars represent 1 SD.
Conclusion
This work studied the effect of lateral lipid phase separation on vaporization of superheated liquid perfluorocarbon droplets. Droplets stabilized by a mixture of DPPC, DOPC, and cholesterol possessed higher ultrasound contrast in general than DPPC-only droplets; 1:1 molar ratio of DPPC:DOPC with 20 mol% or less cholesterol enhanced contrast by about an order of magnitude. A combination of fluorescence microscopy and TEM found that the range of lipid concentrations tested corresponded to three regimes in the ternary phase diagram: solid-liquid ordered (low contrast), liquid ordered-liquid disordered (medium contrast), and solid-liquid disordered (high contrast). Future studies will focus on adapting these mixed lipid droplets under physiological conditions.
Supplementary Material
Acknowledgments
This work was supported by NIH grants DP2EB020401, R21EB018034, and R00CA153935. The authors thank Profs. Jennifer Cha and Mark Borden for helpful discussions. The authors thank Dr. Joseph Dragavon of the CU Biofrontiers Advanced Microscopy Core for help with fluorescence microscopy, and Dr. Thomas Giddings for help with TEM imaging and sample staining.
Funding Sources
NIH grants DP2EB020401, R21EB018034, and R00CA153935
Footnotes
Supporting Information. Size distributions of droplet samples by NTA, images of droplets without DSPE-PEG2000, fluorescence images of droplets with excess DSPE-PEG2000, fluorescent images of droplets showing heating or cooling effects, detailed TEM images, acoustic response of droplets to HIFU insonation as function of internal phase and DSPE-PEG2000.
Author Contributions
The manuscript was written through contributions of all authors. All authors have given approval to the final version of the manuscript.
References
- 1.Deshpande N, Needles A, Willmann J. Molecular ultrasound imaging: current status and future directions. Clinical Radiology. 2010;65:567–581. doi: 10.1016/j.crad.2010.02.013. [DOI] [PMC free article] [PubMed] [Google Scholar]
- 2.Schutt E, Klein D, Mattrey R, Riess J. Injectable microbubbles as contrast agents for diagnostic ultrasound imaging: The key role of perfluorochemicals. Angewandte Chemie-International Edition. 2003;42:3218–3235. doi: 10.1002/anie.200200550. [DOI] [PubMed] [Google Scholar]
- 3.Klibanov A. Ultrasound molecular imaging with targeted microbubble contrast agents. Journal of Nuclear Cardiology. 2007;14:876–884. doi: 10.1016/j.nuclcard.2007.09.008. [DOI] [PubMed] [Google Scholar]
- 4.Karshafian R, Bevan P, Williams R, Samac S, Burns P. Sonoporation by Ultrasound-Activated Microbubble Contrats Agents: Effect of Acoustic Exposure Parameters on Cell Permeability and Cell Viability. Ultrasound in Medicine and Biology. 2009;35:847–860. doi: 10.1016/j.ultrasmedbio.2008.10.013. [DOI] [PubMed] [Google Scholar]
- 5.Sirsi S, Borden M. State-of-the-art materials for ultrasound-triggered drug delivery. Advanced Drug Delivery Reviews. 2014;72:3–14. doi: 10.1016/j.addr.2013.12.010. [DOI] [PMC free article] [PubMed] [Google Scholar]
- 6.Rapoport N. Phase-shift, stimuli-responsive perfluorocarbon nanodroplets for drug delivery to cancer. Wiley Interdiscip Rev Nanomed Nanobiotechnol. 2012;4:492–510. doi: 10.1002/wnan.1176. [DOI] [PMC free article] [PubMed] [Google Scholar]
- 7.Maeda H, Wu J, Sawa T, Matsumura Y, Hori K. Tumor vascular permeability and the EPR effect in macromolecular therapeutics: a review. J Controlled Rel. 2000;65:271–284. doi: 10.1016/s0168-3659(99)00248-5. [DOI] [PubMed] [Google Scholar]
- 8.Clark AJ, Wiley DT, Zuckerman JE, Webster P, Chao J, Lin J, Yen Y, Davis ME. CRLX101 nanoparticles localize in human tumors and not in adjacent, nonneoplastic tissue after intravenous dosing. Proc Natl Acad Sci. 2016;113:3850–3854. doi: 10.1073/pnas.1603018113. [DOI] [PMC free article] [PubMed] [Google Scholar]
- 9.Sheeran P, Luois S, Dayton P, Matsunaga T. Formulation and Acoustic Studies of a New Phase-Shift Agent for Diagnostic and Therapeutic Ultrasound. Langmuir. 2011;27:10412–10420. doi: 10.1021/la2013705. [DOI] [PMC free article] [PubMed] [Google Scholar]
- 10.Kopechek J, Zhang P, Burgess M, Porter T. Synthesis of Phase-shift Nanoemulsions with Narrow Size Distributions for Acoustic Droplet Vaporization and Bubble-enhanced Ultrasound-mediated Ablation. Jove-Journal of Visualized Experiments. 2012 doi: 10.3791/4308. [DOI] [PMC free article] [PubMed] [Google Scholar]
- 11.Matsunaga T, Sheeran P, Luois S, Streeter J, Mullin L, Banerjee B, Dayton P. Phase-Change Nanoparticles Using Highly Volatile Perfluorocarbons: Toward a Platform for Extravascular Ultrasound Imaging. Theranostics. 2012;2:1185–1198. doi: 10.7150/thno.4846. [DOI] [PMC free article] [PubMed] [Google Scholar]
- 12.Pitt W, Singh R, Perez K, Husseini G, Jack D. Phase transitions of perfluorocarbon nanoemulsion induced with ultrasound: A mathematical model. Ultrasonics Sonochemistry. 2014;21:879–891. doi: 10.1016/j.ultsonch.2013.08.005. [DOI] [PubMed] [Google Scholar]
- 13.Shpak O, Verweij M, Vos H, de Jong N, Lohse D, Versluis M. Acoustic droplet vaporization is initiated by superharmonic focusing. Proceedings of the National Academy of Sciences of the United States of America. 2014;111:1697–1702. doi: 10.1073/pnas.1312171111. [DOI] [PMC free article] [PubMed] [Google Scholar]
- 14.Rapoport N, Kennedy A, Shea J, Scaife C, Nam K. Controlled and targeted tumor chemotherapy by ultrasound-activated nanoemulsions/microbubbles. Journal of Controlled Release. 2009;138:268–276. doi: 10.1016/j.jconrel.2009.05.026. [DOI] [PMC free article] [PubMed] [Google Scholar]
- 15.Mountford P, Thomas A, Borden M. Thermal Activation of Superheated Lipid-Coated Perfluorocarbon Drops. Langmuir. 2015;31:4627–4634. doi: 10.1021/acs.langmuir.5b00399. [DOI] [PubMed] [Google Scholar]
- 16.Veatch S, Soubias O, Leung S, Keller S, Hancock R, Thewalt J, Gawrisch K. Complex phase behavior in ‘simple’ membranes: Phase diagram, critical behavior, and impurities in membranes of DOPC, DPPC, and cholesterol. Biophys J. 2007:356A–356A. [Google Scholar]
- 17.Veatch SL, Keller SL. Seeing spots: Complex phase behavior in simple membranes. Biochimica Et Biophysica Acta-Molecular Cell Research. 2005;1746:172–185. doi: 10.1016/j.bbamcr.2005.06.010. [DOI] [PubMed] [Google Scholar]
- 18.McMullen T, Lewis R, McElhaney R. Cholesterol-phospholipid interactions, the liquid-ordered phase and lipid rafts in model and biological membranes. Current Opinion in Colloid & Interface Science. 2004;8:459–468. [Google Scholar]
- 19.Quinn PJ, Wolf C. The liquid-ordered phase in membranes. Bba-Biomembranes. 2009;1788:33–46. doi: 10.1016/j.bbamem.2008.08.005. [DOI] [PubMed] [Google Scholar]
- 20.Baoukina S, Mendez-Villuendas E, Tieleman DP. Molecular View of Phase Coexistence in Lipid Monolayers. J Am Chem Soc. 2012;134:17543–17553. doi: 10.1021/ja304792p. [DOI] [PubMed] [Google Scholar]
- 21.Hancock J. Lipid rafts: contentious only from simplistic standpoints. Nature Reviews Molecular Cell Biology. 2006;7:456–462. doi: 10.1038/nrm1925. [DOI] [PMC free article] [PubMed] [Google Scholar]
- 22.Lingwood D, Simons K. Lipid Rafts As a Membrane-Organizing Principle. Science. 2010;327:46–50. doi: 10.1126/science.1174621. [DOI] [PubMed] [Google Scholar]
- 23.Edidin M. The state of lipid rafts: From model membranes to cells. Annu Rev Biophys Biomol Struct. 2003;32:257–283. doi: 10.1146/annurev.biophys.32.110601.142439. [DOI] [PubMed] [Google Scholar]
- 24.Veatch S, Keller S. Organization in lipid membranes containing cholesterol. Physical Review Letters. 2002;89 doi: 10.1103/PhysRevLett.89.268101. [DOI] [PubMed] [Google Scholar]
- 25.Borden MA, Martinez GV, Ricker J, Tsvetkova N, Longo M, Gillies RJ, Dayton PA, Ferrara KW. Lateral phase separation in lipid-coated microbubbles. Langmuir. 2006;22:4291–4297. doi: 10.1021/la052841v. [DOI] [PubMed] [Google Scholar]
- 26.Chattaraj R, Mohan P, Besmer J, Goodwin A. Selective Vaporization of Superheated Nanodroplets for Rapid, Sensitive, Acoustic Biosensing. Advanced Healthcare Materials. 2015;4:1790–1795. doi: 10.1002/adhm.201500315. [DOI] [PMC free article] [PubMed] [Google Scholar]
- 27.Dayton PA, Zhao S, Bloch SH, Schumann P, Penrose K, Matsunaga TO, Zutshi R, Doinikov A, Ferrara KW. Application of ultrasound to selectively localize nanodroplets for targeted imaging and therapy. Molecular Imaging. 2006;5:160–174. [PMC free article] [PubMed] [Google Scholar]
- 28.Zhou Y, Wang Z, Chen Y, Shen H, Luo Z, Li A, Wang Q, Ran H, Li P, Song W, Yang Z, Chen H, Wang Z, Lu G, Zheng Y. Microbubbles from Gas-Generating Perfluorohexane Nanoemulsions for Targeted Temperature-Sensitive Ultrasonography and Synergistic HIFU Ablation of Tumors. Advanced Materials. 2013;25:4123–4130. doi: 10.1002/adma.201301655. [DOI] [PubMed] [Google Scholar]
- 29.Luke GP, Hannah AS, Emelianov SY. Super-Resolution Ultrasound Imaging in Vivo with Transient Laser-Activated Nanodroplets. Nano Letters. 2016 doi: 10.1021/acs.nanolett.6b00108. [DOI] [PMC free article] [PubMed] [Google Scholar]
- 30.Jian J, Liu C, Gong Y, Su L, Zhang B, Wang Z, Wang D, Zhou Y, Xu F, Li P, Zheng Y, Song L, Zhou X. India Ink Incorporated Multifunctional Phase-transition Nanodroplets for Photoacoustic/Ultrasound Dual-modality Imaging and Photoacoustic Effect Based Tumor Therapy. Theranostics. 2014;4:1026–1038. doi: 10.7150/thno.9754. [DOI] [PMC free article] [PubMed] [Google Scholar]
- 31.Vannan MA, Kuersten B. Imaging techniques for the myocardial contrast echocardiography. European journal of echocardiography : the journal of the Working Group on Echocardiography of the European Society of Cardiology. 2000;1:224–6. doi: 10.1053/euje.2000.0035. [DOI] [PubMed] [Google Scholar]
- 32.Nakatsuka MA, Hsu MJ, Esener SC, Cha JN, Goodwin AP. DNA-Coated Microbubbles with Biochemically Tunable Ultrasound Contrast Activity. Advanced Materials. 2011;23:4908–4912. doi: 10.1002/adma.201102677. [DOI] [PMC free article] [PubMed] [Google Scholar]
- 33.Bach D, Wachtel E. Phospholipid/cholesterol model membranes: formation of cholesterol crystallites. Biochim Biophys Acta. 2003;1610:187–97. doi: 10.1016/s0005-2736(03)00017-8. [DOI] [PubMed] [Google Scholar]
- 34.Veatch S, Keller S. Separation of liquid phases in giant vesicles of ternary mixtures of phospholipids and cholesterol. Biophysical Journal. 2003;85:3074–3083. doi: 10.1016/S0006-3495(03)74726-2. [DOI] [PMC free article] [PubMed] [Google Scholar]
- 35.Rapoport N, Gao Z, Kennedy A. Multifunctional nanoparticles for combining ultrasonic tumor imaging and targeted chemotherapy. J Natl Cancer Inst. 2007;99:1095–106. doi: 10.1093/jnci/djm043. [DOI] [PubMed] [Google Scholar]
- 36.Wang Z, Yang S. Adsorption Behaviors of DPPC/MO Aggregates on SiO2 Surfaces. Langmuir. 2008;24:11616–11624. doi: 10.1021/la801723j. [DOI] [PubMed] [Google Scholar]
- 37.Shaikh SR, Dumaual AC, Jenski LJ, Stillwell W. Lipid phase separation in phospholipid bilayers and monolayers modeling the plasma membrane. Biochimica Et Biophysica Acta-Biomembranes. 2001;1512:317–328. doi: 10.1016/s0005-2736(01)00335-2. [DOI] [PubMed] [Google Scholar]
- 38.Anton N, Pierrat P, Lebeau L, Vandamme TF, Bouriat P. A study of insoluble monolayers by deposition at a bubble interface. Soft Matter. 2013;9:10081–10091. [Google Scholar]
Associated Data
This section collects any data citations, data availability statements, or supplementary materials included in this article.


