

Excess absorption of diffuse versus direct light in the upper mesophyll of Helianthus annuus sun leaves leads to suboptimal photosynthesis.
Abstract
In agricultural and natural systems, diffuse light can enhance plant primary productivity due to deeper penetration into and greater irradiance of the entire canopy. However, for individual sun-grown leaves from three species, photosynthesis is actually less efficient under diffuse compared with direct light. Despite its potential impact on canopy-level productivity, the mechanism for this leaf-level diffuse light photosynthetic depression effect is unknown. Here, we investigate if the spatial distribution of light absorption relative to electron transport capacity in sun- and shade-grown sunflower (Helianthus annuus) leaves underlies its previously observed diffuse light photosynthetic depression. Using a new one-dimensional porous medium finite element gas-exchange model parameterized with light absorption profiles, we found that weaker penetration of diffuse versus direct light into the mesophyll of sun-grown sunflower leaves led to a more heterogenous saturation of electron transport capacity and lowered its CO2 concentration drawdown capacity in the intercellular airspace and chloroplast stroma. This decoupling of light availability from photosynthetic capacity under diffuse light is sufficient to generate an 11% decline in photosynthesis in sun-grown but not shade-grown leaves, primarily because thin shade-grown leaves similarly distribute diffuse and direct light throughout the mesophyll. Finally, we illustrate how diffuse light photosynthetic depression could overcome enhancement in canopies with low light extinction coefficients and/or leaf area, pointing toward a novel direction for future research.
Plant photosynthesis generally increases with irradiance until saturation. However, the fraction of diffuse versus direct light (i.e. directional quality) impacts photosynthesis from the canopy level down to the cellular level. A higher fraction of diffuse light tends to occur due to light-scattering particles in the atmosphere, such as clouds, aerosols, and anthropogenic emissions or volcanic ejecta (Mercado et al., 2009). At the canopy level, in both agricultural and natural systems, diffuse light illuminates more total leaf area, which has been repeatedly associated with increased light use efficiency (LUE [net primary productivity divided by absorbed photosynthetically active radiation]; Gu et al., 2002; Alton et al., 2007; Urban et al., 2007, 2012; Alton, 2008; Kanniah et al., 2013; Williams et al., 2014; Cheng et al., 2015) and an insignificant to positive effect on primary productivity (Kanniah et al., 2012). Although studies at the individual leaf level are less common, several lines of evidence suggest that leaf developmental environment underlies internal light absorption and subsequent photosynthetic responses to diffuse versus direct light. Thick, sun-grown leaves show lower photosynthesis under diffuse relative to direct light, whereas thin, shade-grown leaves show no advantage (Brodersen et al., 2008; Brodersen and Vogelmann, 2010; Urban et al., 2014). Thus, a previously unexplored tradeoff exists for how individual leaves versus the entire canopy photosynthesize under diffuse versus direct light.
Given anticipated changes in fog and cloud cover in many places globally (Johnstone and Dawson, 2010; Brient and Bony, 2013), along with rising levels of aerosols (Carslaw et al., 2013), substantial research efforts have gone into improving predictions of how LUE is influenced by diffuse light (Kanniah et al., 2012). Deeper diffuse light penetration along canopy depth has been suggested as the primary mechanism underlying the corresponding increases of canopy-level LUE (Urban et al., 2007; Li et al., 2014). This mechanism is further supported by observations of increasing LUE with higher leaf area index (LAI; Greenwald et al., 2006; Alton et al., 2007), which varies with genotype/species differences in leaf morphology, orientation, and distribution. Whether increases in LUE under diffuse light result in higher primary productivity, however, is unclear, as lower total surface irradiance tends to accompany diffuse light conditions (Kanniah et al., 2012). Moreover, a lack of consideration for plant phenology associated with seasonal changes in LAI and photosynthetic capacity has confounded most previous studies (for exceptions, see Li et al., 2014; Williams et al., 2014), potentially leading to a substantial overestimation of diffuse light photosynthetic enhancement at the canopy level (Williams et al., 2016).
Despite its potential impact on agricultural and ecosystem productivity, the effect of diffuse light on photosynthesis at the leaf level is not well understood. Similar to a canopy, the directional quality of light can affect its penetration and absorption within a leaf. For example, increasing the angle of incidence (from perpendicular) at which light intersects the leaf surface decreases penetration depth and, ultimately, absorption (Brodersen and Vogelmann, 2010). Interestingly, diffuse light, which arrives at the leaf surface at numerous angles, has been observed to penetrate less deeply into sun-grown, but not shade-grown, leaves (Brodersen and Vogelmann, 2010). Corresponding to this observation, sun-grown sunflower (Helianthus annuus) and Amaranthus retroflexus leaves showed a reduction in photosynthetic rates by 10% to 15% under diffuse light in comparison with direct light (Brodersen et al., 2008). Similarly, sun-grown leaves of Fagus sylvatica showed ∼40% lower net assimilation for a similar irradiance level on cloudy days with predominantly diffuse light and ∼63% lower apparent quantum yield (Urban et al., 2014).
Anatomical and biochemical differences between sun- and shade-grown leaves (Terashima et al., 2006) may give rise to their observed distinct photosynthetic responses to diffuse versus direct light. Specifically, Brodersen et al. (2008) attributed these photosynthetic differences to deeper penetration of direct compared with diffuse light. That is, when light enters the leaf, it is absorbed or scattered, thereby establishing light gradients within the mesophyll. Those gradients then lead to stratified leaf layers that are anatomically and biochemically optimized for absorbing light with specific directional and spectral quality along tissue depth. This idea was confirmed by Brodersen and Vogelmann (2010) in sunflower, where internal light absorption profiles of leaves illuminated under diffuse and direct light indicated that diffuse light does not penetrate as deeply into high-light-adapted leaves compared with direct light, thereby decoupling light availability and photosynthetic capacity deep in the spongy mesophyll. Interestingly, the differences in photosynthesis under direct and diffuse light seen in sun leaves were not observed in thin, shade-grown leaves (Brodersen et al., 2008), which was speculatively related to equal penetration of diffuse and direct light at low light intensity within shade-grown leaves with less differentiation of the palisade and spongy mesophyll. In both leaf types, diffuse light scattered upon entry and became trapped within the upper layers of the leaf, penetrating weakly beyond the transition zone between the palisade and spongy mesophyll tissue, where chlorophyll content was found to reach a maximum (Brodersen and Vogelmann, 2010). Thus, observed photosynthetic declines under diffuse versus direct irradiance have been assigned a putative mechanism, yet the link has not been tested explicitly.
Here, we developed a one-dimensional (1-D) spatially explicit finite element gas-exchange model parameterized with light absorption profiles from leaves illuminated under diffuse and direct light (Brodersen and Vogelmann, 2010). Compared with models based on the circuit-resistance analog, a finite element model (FEM) can more accurately describe the interactive processes of CO2 diffusion and photosynthetic reaction within a spatially explicit leaf geometry (Parkhurst, 1994; Aalto and Juurola, 2002; Tholen and Zhu, 2011; Ho et al., 2016). Using this model, we investigated if the spatial differences in light absorption profiles observed in sun- and shade-grown leaves could explain their photosynthetic responses to diffuse versus direct light. In other words, is decoupling light availability from photosynthetic capacity by changing light directionality sufficient to generate the observed declines in photosynthesis? If so, it would imply that leaves are both anatomically and biochemically adapted to specific light environments and sensitive to the directional quality of light. Finally, we illustrate how our model can be used to investigate the tradeoff between individual leaf- versus canopy-level photosynthesis under diffuse versus direct light, providing an interesting direction for future research.
To summarize our approach, we first defined a baseline scenario (Table I) parameterized with values that represented previously observed anatomical and biochemical differences between sun- and shade-grown leaves. In this way, we could compare the spatial distribution of potential, actual, and maximum PSII electron transport, indicating internal regions of excess light absorption as well as utilized and unutilized electron transport capacity. Moreover, by directly coupling light absorption to CO2 consumption, we predicted CO2 concentrations [CO2] within the intercellular airspace and chloroplast stroma. For a given [CO2] distribution, we calculated leaf-level photosynthetic output and compared it with previously measured values by Brodersen et al. (2008). We then tested the photosynthetic sensitivity of sun- and shade-grown leaves to select anatomical and biochemical parameters (Table II). Given that limited evidence exists about the distribution of electron transport capacity throughout the leaf, we tested four scenarios assuming that maximum electron transport capacity was proportional to the (1) Rubisco concentration, (2) light absorption profile, (3) mesophyll volume, or (4) chlorophyll distribution. Finally, we examined several scenarios regarding the distribution of layer-specific PSII quantum yield (ϕPSII), a process that reflects numerous and dynamic biochemical processes and has been treated typically as a constant with leaf depth (Terashima and Saeki, 1985; Evans, 2009; Xiao et al., 2016). The results of our leaf-level model were then combined with existing canopy-level light extinction coefficients to illustrate potential photosynthetic tradeoffs at each scale.
Table I. Parameters and constants used in the model, baseline scenario.
| Name | Symbol | Value (Sun/Shade) | Units | Notes and References |
|---|---|---|---|---|
| Whole-leaf absorption of sun/shade leaves after diffuse light correction | α | 0.72/0.69 | mol mol−1 | Brodersen et al. (2008) |
| 0.69/0.66 | Gorton et al. (2010) | |||
| Net CO2 assimilation on a leaf area basis | An | Calculated | mol m−2 s−1 | Equation 10 |
| Fraction of light absorbed by PSII | β | 0.44 | mol mol−1 | Evans (2009) |
| [CO2] in intercellular airspace | Cias | Variable | mol m−3 | Equation 1 |
| [CO2] in chloroplast stroma | Cliq | Variable | mol m−3 | Assumed |
| [CO2] at stomata | Cstom | 1.5 × 10⁻² | mol m−3 | Assumed |
| Diffusivity of CO2 in intercellular airspace | Dc | 1.54 × 10⁻⁵ | m2 s−1 | Assumed |
| Effective diffusivity of CO2 in intercellular airspace | De | Calculated | m−2 s−1 | Equation 3 |
| Diffusive flux between intercellular airspace and chloroplast stroma | fliq | Calculated | mol m−3 s−1 | Equation 4 |
| Fraction of palisade relative to spongy | fpal | 0.6/0.45 | m m−1 | Brodersen et al. (2008) |
| Chlorophyll fluorescence profile along leaf depth normalized by total fluorescence | Fchl | Variable | – | Brodersen and Vogelmann (2010) |
| CO2 compensation point | Γ* | 1.35 × 10⁻³ | mol m−3 | Tholen and Zhu (2011) |
| Conductance of cell wall, plasmalemma, cytosol, chloroplast envelope, and chloroplast stroma | gliq | 2.5 × 10⁻⁴ | m s−1 | Evans (2009) |
| Electron transport potential of PSII under unlimited jmax | j∞ | Calculated | mol m−3 s−1 | Equation 7 |
| PPFD incident on the leaf surface | Io | Variable | mol m−2 s−1 | Assumed |
| Maximum photosynthetic e− transport rate on a leaf area basis | Jmax | 2.42 × 10⁻⁴/1.54 × 10−4 | mol m2 s−1 | Estimated from Brodersen et al. (2008) |
| Maximum volumetric photosynthetic e− transport rate at distance z from the adaxial surface | jmax | Calculated | mol m3 s−1 | Equation 6 |
| Volumetric e− transport rate at distance z from the adaxial surface | je | Calculated | mol m−3 s−1 | Equation 8 |
| Catalytic rate of Rubisco | kc | 2.84 | s−1 | Tholen and Zhu (2011) |
| Rubisco effective Km | Km | 18.7 × 10⁻³ | mol m−3 | Tholen and Zhu (2011) |
| Leaf thickness | Lt | 2.75 × 10⁻⁴/2.15 × 10−4 | m | Brodersen et al. (2008) |
| Fraction of intercellular airspace, palisade | ϕpal | 0.1 | m3 m−3 | Assumed |
| Fraction of intercellular airspace, spongy | ϕspg | 0.3 | m3 m−3 | Assumed |
| Layer-specific quantum yield of PSII electron transport | ϕPSII | Variable | mol mol−1 | Assumed |
| Volumetric rate of RuBP carboxylation | rc | Calculated | mol m−3 s−1 | Equation 5 |
| Volumetric respiration rate | rd | 6.6 × 10⁻² | mol m−3 s−1 | Calculated from Tholen and Zhu (2011) |
| Volumetric rate of photorespiratory CO2 release | rp | Calculated | mol m−3 s−1 | Equation 9 |
| Leaf surface area-to-mesophyll surface area ratio | Sm,pal | 23.8/14.1 | m2 m−2 | Assumed |
| Leaf surface area-to-mesophyll surface area ratio | Sm,spg | 2.6/2.8 | m2 m−2 | Assumed |
| Tortuosity of intercellular airspace | τ | 1.55 | m m−1 | Syvertsen et al. (1995) |
| Stroma volume-to-mesophyll surface area ratio | Vs | 1.74 × 10⁻⁶ | m3 m−2 | Modified from Tholen and Zhu (2011) |
| Mitochondria-to-stroma volume ratio | Vm | 0.03 | m3 m−3 | Tholen and Zhu (2011) |
| Rubisco concentration | Xc | 2.5/1.0 | mol m−3 | Tholen and Zhu (2011); Oguchi et al. (2003) |
Table II. Alternative values tested for sensitivity analysis of geometric and biochemical model parameters.
| Name | Symbol | Baseline (Sun/Shade) | Scenario A (Sun/Shade) | Scenario B (Sun/Shade) | Units |
|---|---|---|---|---|---|
| Geometric parameters | |||||
| Fraction of palisade relative to spongy | fpal | 0.6/0.45 | 0.45/0.30 | 0.75/0.60 | m m−1 |
| Conductance of cell wall, plasmalemma, cytosol, chloroplast envelope, and chloroplast stroma | gliq | 0.00025 | 0.001 | 0.01 | m s−1 |
| Fraction of intercellular airspace, palisade | ϕpal | 0.1 | 0.05 | 0.15 | m3 m−3 |
| Fraction of intercellular airspace, spongy | ϕspg | 0.3 | 0.1 | 0.5 | m3 m−3 |
| Mesophyll surface area-to-leaf surface area ratio, palisade | Sm,pal | 23.8/14.1 | 12.0/7.0 | 27.9/16.4 | m2 m−2 |
| Mesophyll surface area-to-leaf surface area ratio, spongy | Sm,spg | 2.6/2.8 | 1.3/1.4 | 4.0/4.3 | m2 m−2 |
| Tortuosity of intercellular airspace | τ | 1.55 | 1.15 | 1.95 | m m−1 |
| Stroma volume-to-mesophyll surface area ratio | Vs | 1.74 × 10⁻⁶ | 1.24 × 10⁻⁶ | 2.24 × 10⁻⁶ | m3 m−2 |
| Biochemical parameters | |||||
| Whole-leaf absorption | α | 0.72/0.69 | 0.40/0.38 | 1.00/0.96 | mol mol−1 |
| Fraction of light-absorbed pigments associated with PSII | β | 0.44 | 0.4 | 0.5 | mol mol−1 |
| Maximum photosynthetic e− transport rate on a leaf area basis | Jmax | 2.42 × 10⁻⁴/1.54 × 10−4 | 1.3 × 10⁻⁴/0.8 × 10−4 | 3.1 × 10⁻⁴/2.0 × 10−4 | mol m2 s−1 |
| Catalytic rate of Rubisco | kc | 2.84 | 2 | 4 | s−1 |
| Rubisco effective Km | Km | 1.87 × 10⁻² | 1.27 × 10⁻² | 2.47 × 10⁻² | mol m−3 |
| Rubisco concentration | Xc | 2.5/1.0 | 1.5/0.5 | 3.5/1.5 | mol m−3 |
RESULTS
Light Absorption Probability
The light absorption probability distribution (Fig. 1) describes the likelihood of light absorption at any position between the leaf abaxial and adaxial surfaces. As the area under the light absorption probability distribution integrates to leaf-level light absorption (hence, units of m−1), direct comparison among anatomically different leaves is possible.
Figure 1.

Absorption probability density and cumulative absorption for sun-grown (left column) and shade-grown (right column) leaves under diffuse (black lines) and direct (gray lines) irradiance at various positions along the z axis. The abaxial leaf surface is at z = 0. The area under the absorption probability density curve sums to the leaf-level absorption.
Under direct light, the sun- and shade-grown leaves (Fig. 1) had similar absorption probability peaks of 7,227 and 6,902 m−1, respectively, indicating a similar level of absorption. Yet, under diffuse light, the sun-grown leaves had an absorption probability peak of 8,729 m−1, while the shade-grown leaves had a substantially lower peak of 7,749 m−1. Thus, the sun-grown leaf absorbed 21% more light under diffuse compared with direct light at its peak absorption. On average, sun-grown sunflower leaves absorbed 89% of total diffuse light absorption (i.e. excluding reflection and transmission) within the upper 25% of the leaf (almost exclusively within the palisade), whereas they absorbed 78% of total direct light within the same volume, indicating a more even absorption of direct versus diffuse light along the leaf depth. In contrast, shade-grown leaves absorbed less light in the upper 25% compared with sun-grown leaves, with 71% of diffuse light and 64% of direct light within the same volume. Hence, the thin shade-grown leaves more evenly absorbed light throughout the leaf compared with the thicker sun-grown leaves.
Potential, Actual, and Maximum Electron Transport
Under the baseline scenario, there were notable patterns in the potential (j∞), actual (je), and maximum (jmax) PSII electron transport of sunflower, resulting in distinct profiles of excess light absorption as well as utilized and unutilized electron transport capacity (Fig. 2; Eqs. 6–8). Note that j∞ is the amount of electron transport that would occur assuming infinite electron transport capacity, jmax (i.e. if jmax did not limit electron transport). At relatively low levels of diffuse and direct photosynthetic photon flux density (PPFD; e.g. 250 µmol m−2 s−1), j∞ equaled je for both sun-grown and shade-grown leaves (Fig. 3). At 250 µmol m−2 s−1 PPFD, the sun-grown leaf utilized 15% and 16% of jmax under diffuse and direct light, respectively. For the same PPFD, the shade-grown leaf used 19% and 20% of jmax under diffuse and direct light. Neither sun-grown nor shade-grown leaves exceeded jmax at this PPFD level; thus, no excess light absorption occurred. As PPFD increased to 750 µmol m−2 s−1, the sun-grown leaf utilized 52% and 58% of jmax under diffuse and direct light, respectively. For the same PPFD, the shade-grown leaf used 69% and 74% of jmax under diffuse and direct light. Furthermore, 6% and 0.5% of light absorbed exceeded jmax for the sun-grown leaf under diffuse and direct light, whereas the shade-grown leaf exceeded jmax by 3% and 0.5%. Notably, at 1,250 µmol m−2 s−1 PPFD, the sun-grown leaf utilized 68% and 82% of jmax under diffuse and direct light, respectively, with excess absorption of 26% and 16%. Under the same PPFD, the shade-grown leaf used 88% and 91% of jmax under diffuse and direct light, with excess absorption of 26% in both cases. The loss in electron transport for the sun-grown leaf at 1,250 µmol m−2 s−1 PPFD diffuse light occurred between 0 and 175 µm from the abaxial surface (the area between the black and red lines in Fig. 3); thus, underutilization occurred in the lower palisade and spongy mesophyll regions.
Figure 2.

Illustrative example of potential (j∞; yellow line), actual (je; red line), and maximum (jmax; black line) electron transport by PSII due to absorbed light at different distances from the abaxial surface of a leaf. Note that (1) the area between the y axis and the red line represents utilized electron transport capacity, (2) the area between the red and black lines represents unutilized electron transport capacity, and (3) the area between the red and yellow lines represents excess light absorption.
Figure 3.

Baseline scenario in which maximum electron transport capacity is proportional to Rubisco concentration under direct (solid lines) and diffuse (dashed lines) light conditions. Potential (j∞; yellow lines), actual (je; red lines), and maximum (jmax; black lines) PSII electron transport is shown at 250, 750, 1,250, or 2,000 μmol m−2 s−1 PPFD along different distances from the abaxial leaf surface for the sun-grown leaf (top row) and the shade-grown leaf (bottom row).
[CO2] Profiles in the Intercellular Airspace and Chloroplast Stroma
The sun-grown leaf drew down [CO2] more effectively under direct versus diffuse light in both the intercellular airspace and the chloroplast stroma (Fig. 4). At 1,250 µmol m−2 s−1 PPFD of direct light, for example, the intercellular airspace averaged a [CO2] of 290 ppm, compared with 299 ppm under diffuse light. The chloroplast stroma, on the other hand, averaged 225 and 245 ppm for direct and diffuse light, respectively. Under these conditions, the model predicted a substantial range of variation in [CO2], reaching minimum values of ∼255 and ∼155 ppm in the intercellular airspace and stroma, respectively. The [CO2] drawdown capacity of the lower palisade and spongy mesophyll was disproportionately reduced by diffuse light conditions, particularly in the sun-grown leaf. In contrast, the shade-grown leaf performed more similarly under diffuse and direct light. At 1,250 µmol m−2 s−1 PPFD, for instance, the intercellular airspace of the shade-grown leaf averaged 306 and 307 ppm for direct versus diffuse light, whereas the chloroplast stroma averaged 248 and 251 ppm.
Figure 4.

[CO2] in the chloroplast stroma (Cliq; top row) and intercellular airspace (Cias; bottom row) of the sun-grown leaf (gray lines) and the shade-grown leaf (black lines) at different distances from the abaxial surface when irradiated with direct (solid lines) or diffuse (dotted lines) light. PPFD values of 250, 750, 1,250, and 2,000 μmol m−2 s−1 are shown in each column.
Modeled Leaf-Level Photosynthetic Light Response Curves
Under the baseline scenario, the thick, sun-grown leaf illuminated with diffuse light showed a notable reduction in photosynthetic rate, An, in comparison with direct light conditions (Fig. 5). This reduction in An occurred across all PPFD levels and was greatest at 1,250 µmol m−2 s−1 PPFD, with a value of 28.1 µmol m−2 s−1, as opposed to 31.4 µmol m−2 s−1 under direct light. Such a reduction in An amounted to an 11% lower photosynthetic output at 1,250 µmol m−2 s−1 PPFD. In contrast, the thin shade-grown leaf showed slightly higher An under diffuse light up to a PPFD of 750 µmol m−2 s−1, at which point direct light became marginally more efficient at driving photosynthesis. At low light levels (less than or equal to 200 µmol m−2 s−1 PPFD), the shade-grown leaf had a similar An to the thick sun-grown leaf, despite having almost 40% less mesophyll volume (Fig. 5; Table I). However, the thin shade leaf approached its photosynthetic capacity beyond 750 µmol m−2 s−1 PPFD. Previously observed data by Brodersen et al. (2008) are also shown in Figure 5 for comparison.
Figure 5.

Predicted (lines; baseline scenario of the 1-D model) and observed (points; mean values from Brodersen et al., 2008) leaf-level photosynthesis (An) for the sun-grown leaf (left) and the shade-grown leaf (right) at different PPFD levels of direct (black) and diffuse (gray) light.
Sensitivity Analysis of Photosynthesis to Select Geometric and Biochemical Parameters
A sensitivity analysis of eight geometric and six biochemical parameters consistently predicted lower photosynthetic rates for the sun-grown leaf under diffuse versus direct light (Fig. 6; Table II). This photosynthetic sensitivity to diffuse light, Ān,diffuse − Ān,direct, was smaller for the shade-grown leaf across most of the scenarios examined. Leaf-level convexity of the light response curve (Θ) also was consistently lower under diffuse light in the sun-grown leaf, whereas this difference was smaller for the shade-grown leaf. Of these geometric parameters, lowering the fraction of mesophyll as palisade (fpal) from 0.6 (baseline scenario) to 0.45 (scenario A) most strongly reduced the photosynthetic sensitivity of the sun-grown leaf to diffuse light. On the other hand, raising fpal to 0.75 (scenario B) increased the photosynthetic sensitivity of the sun-grown leaf to diffuse light, but to a lesser degree. With respect to the biochemical parameters, lowering leaf-level absorption (α) from 0.72 (baseline scenario) to 0.4 (scenario A) also strongly reduced sun-grown leaf photosynthetic sensitivity to diffuse light. Yet, raising α to 1 (scenario B) resulted in only a minimal increase.
Figure 6.

Sensitivity analysis of average leaf-level photosynthetic rate (Ān; left column) and the leaf-level convexity parameter (Θ; right column) of eight geometric and six biochemical parameters for the sun-grown leaf and the shade-grown leaf. Differences in An and Θ between diffuse and direct light are shown for the sun (top row) and shade (bottom row) leaves. Dotted vertical lines represent values corresponding to the baseline scenario described in Table I. Variable names on the y axis are defined in Table I. Two alternative scenarios for each parameter are shown with gray points (scenario A in Table II) and black points (scenario B in Table II).
Maximum Electron Transport Capacity Distribution
In the baseline scenario, we assumed that within-leaf jmax was proportional to Rubisco concentration. We tested three alternative scenarios in which within-leaf jmax was proportional to the (1) direct or diffuse light absorption profile, (2) mesophyll volume, and (3) chlorophyll distribution (Supplemental Figs. S1–S3). The results for the sun-grown leaf only are shown in Figure 7.
Figure 7.

For the sun-grown leaf only, each row represents one of three alternative scenarios in which electron transport capacity, jmax, distribution is proportional to the (1) light absorption profile (top row), (2) mesophyll volume (middle row), and (3) chlorophyll distribution (bottom row). The left column shows predicted (lines; 1-D model) and observed (points; mean values from Brodersen et al., 2008) leaf-level photosynthesis, An, for the sun-grown leaf when irradiated with direct (dark gray) and diffuse (light gray) light. The right column shows the difference in chloroplast stroma concentration between the diffuse and direct scenarios (dCliq) at various distances from the abaxial surface. Contours are shown as illuminance increases from low (light gray lines) to high (black lines) intensity. Specifically, the following PPFD values are included: 0, 50, 100, 150, 200, 250, 300, 350, 400, 450, 500, 600, 750, 1,000, 1,250, 1,500, and 2,000 μmol m−2 s−1.
When within-leaf jmax was proportional to the light absorption profile, An increased similarly to the baseline scenario during the first 750 µmol m−2 s−1 PPFD but continued to increase more steeply until it abruptly reached Amax at ∼1,250 µmol m−2 s−1 PPFD. The photosynthetic sensitivity to diffuse light was reduced initially but, interestingly, became most apparent as a reduction in Amax and corresponded with a weaker [CO2] drawdown in the chloroplast stroma (Supplemental Figs. S4–S6). When within-leaf jmax was proportional to the mesophyll volume, the light response curve looked very similar to the baseline assumption of Rubisco proportionality. The strongest effect on the light response curve occurred when within-leaf jmax was proportional to chlorophyll distribution. In this case, the jmax distribution profile was almost reversed relative to the light absorption distribution profile. Consequently, there is a large overall reduction in the slope of the light response curve after ∼250 µmol m−2 s−1 PPFD. However, the photosynthetic sensitivity to diffuse light remains apparent for much of the light response curve and corresponds to a reduced ability to draw down [CO2] in the chloroplast stroma (Fig. 7).
Quantum Yield Distribution
The assumed distribution of light-limited ϕPSII within the leaf can have a strong effect on the leaf-level light response curve (Fig. 8). We tested three scenarios regarding the distribution of light-limited ϕPSII: (1) constant ϕPSII equal to 0.85 across the leaf depth, (2) increasing ϕPSII from 0.5 at the adaxial surface to 0.85 at the abaxial surface, and (3) constant ϕPSII equal to 0.5 across the leaf depth. Assuming a constant ϕPSII equal to 0.85 resulted in an overly steep initial light response relative to the observed data for both the sun-grown and shade-grown leaves. The second scenario, of an increasing ϕPSII from 0.5 at the adaxial surface to 0.85 at the abaxial surface, closely matched the observed data for the sun-grown leaf but was still too steep for the shade-grown leaf. The third scenario, which assumed a constant ϕPSII equal to 0.5 across the leaf depth, resulted in an underestimation of the light response curve for the sun-grown leaf but closely matched the observed data for the shade-grown leaf.
Figure 8.

Predicted (lines; 1-D model) and observed (points; mean values from Brodersen et al., 2008) leaf-level photosynthesis, An, for the sun-grown (left column) and shade-grown (right column) leaves when irradiated with direct (black) and diffuse (gray) light. Each row represents one of three alternative scenarios with respect to the spatial distribution of light-limited ϕPSII: (1) constant φPSII equal to 0.85 across the leaf depth, (2) decreasing value of ϕPSII from 0.85 at the abaxial surface to 0.5 at the adaxial surface, and (3) constant ϕPSII equal to 0.5 across the leaf depth.
As ϕPSII is typically assumed to be maximal, particularly at low PPFD, the overprediction of the initial light response curve also could be due to a Rubisco limitation. To test this possibility, we ran several scenarios in which ϕPSII was constant at 0.85 across the leaf depth, but Rubisco concentration was distributed differently from Nishio et al. (1993). To bring the slope of the initial light response curve into the range of that observed by Brodersen and Vogelmann (2010) required that the Rubisco concentration distribution peaked strongly in the spongy relative to the palisade mesophyll (Supplemental Fig. S7). It is also worth noting that, between 0 and 50 μmol m−2 s−1 PPFD, the baseline model underpredicted the slope of the observed light response curve (Supplemental Fig. S8), suggesting that ϕPSII is likely close to the maximum at low PPFD levels but may decrease as PPFD increases.
Photosynthetic Tradeoffs under Diffuse Light at Leaf and Canopy Levels
Using the results of our leaf-level model and existing canopy-level light extinction coefficients for diffuse versus direct light, we examined potential photosynthetic tradeoffs at each scale. In our first scenario (Fig. 9), we assumed that direct and diffuse light have canopy-level extinction coefficients of 1.06 and 0.82, respectively (Li et al., 2014). Using our modeled leaf-level light response curves for sun- and shade-grown leaves under diffuse versus direct light (Fig. 5), we predicted An at different cumulative LAI values within the canopy. In the first ∼0.6 m2 m−2, cumulative LAI sun-grown leaves showed higher An in direct compared with diffuse light, indicating that the diffuse light disadvantage at the leaf level dominated the canopy-level enhancement. At ∼0.6 m2 m−2 (i.e. the crossover point; highlighted with the gray box in Figure 9A), diffuse light became advantageous due to the canopy-level benefit of deeper penetration into and greater irradiation of the entire canopy. This crossover point corresponded to ∼750 µmol m−2 s−1 PPFD, corresponding to the divergence of the leaf-level An response to diffuse versus direct light (Fig. 5). Despite the advantage of direct light in the upper canopy, diffuse light resulted in a canopy-level average An of 10.2 µmol m−2 s−1 compared with direct light at 8.6 µmol m−2 s−1, or 19% higher An. As shade-grown sunflower leaves did not preferentially photosynthesize diffuse or direct light, the canopy-level benefit of diffuse light led to equal or higher An throughout the canopy under diffuse compared with direct light (Fig. 9A).
Figure 9.

Derived from Li et al. (2014), the top left graph shows the light availability at various cumulative LAI values from the upper to lower canopy when the extinction coefficient (k) is 1.06 and 0.82 for direct light (solid lines) and diffuse light (dashed lines), respectively. Canopy-level light availability at 0.25*k is shown in the bottom left graph. Leaf-level net CO2 assimilation (An) is shown for sun-grown (middle column) and shade-grown (right column) leaves under diffuse and direct light conditions. Gray boxes indicate the cumulative LAI at which diffuse light leads to greater An than direct light (i.e. the crossover point).
In the second scenario, we reduced the extinction coefficients by 75% (Fig. 9B), which could occur due to, for example, pruning or lower planting density. Notably, such a scenario would likely reduce the maximum cumulative LAI as well. For the sun-grown canopy, this shifts the crossover point to a higher cumulative LAI (∼2.4 m2 m−2), suggesting that the leaf-level effect An dominates deeper into the canopy. If we assume a corresponding drop of 75% in the maximum cumulative LAI to 1.25, this suggests that the leaf-level effect of diffuse light would almost entirely dominate canopy-level An in the simulated sun-grown plant. That is, diffuse light would result in a canopy-level average An of 29.4 µmol m−2 s−1 compared with direct light at 31.8 µmol m−2 s−1, or 8% lower An. Again, as shade-grown sunflower leaves did not preferentially photosynthesize diffuse or direct light, the canopy-level benefit of diffuse light led to equal or higher An throughout the canopy under diffuse compared with direct light. Moreover, due to the very low extinction coefficient, the shade-grown leaf canopy remained completely saturated throughout the canopy (assuming a maximum cumulative LAI of 1.25 m2 m−2).
DISCUSSION
Our findings show that decoupling light availability from photosynthetic capacity by changing light directionality is sufficient to generate significant declines in the photosynthesis of sunflower sun leaves. This decoupling likely corresponds to a mismatch in leaf anatomy and biochemistry relative to its developmental light environment, as photosynthesis of the sun-grown leaf was more strongly affected by light directionality than that of the shade-grown leaf. Our findings build on a growing body of work that used chlorophyll fluorescence profiles to demonstrate that mesophyll anatomy and light quality affect light absorption (Vogelmann and Han, 2000; Vogelmann and Evans, 2002; Johnson et al., 2005; Brodersen and Vogelmann, 2010). Previous studies normalized fluorescence profiles by maximum fluorescence within a given leaf. Instead, we used leaf-level absorption values under diffuse and direct light to normalize mesophyll fluorescence profiles, permitting direct comparison of absorption at any distance from the leaf abaxial surface (Fig. 1; Eq. 7). Such normalization reveals distinct differences among sun and shade leaves and across PPFD scenarios with respect to the maximum absorption probability and the slope of the absorption probability along the leaf depth. In comparison with direct light, the sun-grown leaf illuminated with diffuse light showed higher absorption in the upper palisade, which then declined steeply with increasing depth. Conversely, under both direct and diffuse light, shade leaves exhibited more even light absorption probability from the upper to the lower surface.
Terashima and Saeki (1985) demonstrated that a steeper slope of the light absorption curve can lead to suboptimal photosynthesis with respect to light use. Thus, the steeper slope of the absorption profile observed by Brodersen and Vogelmann (2010) for sun leaves illuminated with diffuse light should correspond to the observed reduction in photosynthesis compared with direct irradiance (Brodersen et al., 2008). Indeed, we similarly predict 11% lower An for the sun-grown leaf under diffuse versus direct light using a novel 1-D leaf diffusion-reaction model parameterized with previously published data, effectively reconstructing measured light response curves under the two light conditions (Fig. 5). Using a sensitivity analysis, we individually varied eight geometric and six biochemical parameters to test for the robustness of the sun-grown leaf’s observed photosynthetic sensitivity to diffuse light (Fig. 6). Considering all the scenarios tested, direct light resulted in 0.5 to 3.1 µmol m−2 s−1 greater photosynthetic output than diffuse light at 750 µmol m−2 s−1 PPFD for the sun-grown leaf. For the shade-grown leaf, photosynthetic output was between 0.8 µmol m−2 s−1 greater and 0.3 µmol m−2 s−1 lower under diffuse versus direct light.
The mechanism underlying the shade-grown sunflower leaf’s reduction in LUE is elucidated by comparing j∞, je, and jmax at different distances from the abaxial surface (Figs. 2 and 3). Previous studies have suggested that jmax should be distributed proportionally to light absorption to achieve maximum LUE (Terashima and Saeki, 1985; Farquhar, 1989). Yet, the spatial distribution of jmax within the leaf is not well characterized because it is difficult to measure with current techniques (Evans, 2009). In fact, jmax profiles have only been described for two species, Spinacia oleracea (Nishio et al., 1993; Evans and Vogelmann, 2003) and Eucalyptus pauciflora (Evans and Vogelmann, 2006). However, instead of tracking the light absorption profile, jmax of S. oleracea was observed to more closely follow Rubisco concentration (Nishio et al., 1993; Terashima et al., 2009). By assuming that jmax was proportional to Rubisco concentration in our model, adaxial regions of the leaf reached jmax prior to abaxial regions, resulting in excess adaxial absorption and unutilized abaxial jmax (Fig. 3). This effect was amplified under diffuse light. Such differences are less dramatic in the shade leaf, which exhibited a similar absorption profile under diffuse and direct light. While our model did not incorporate biochemical feedbacks in response to excess light absorption, it is likely that such excess absorption would be dissipated via nonphotochemical quenching pathways (Demmig-Adams, 1998), a possible direction for future modeling efforts.
Another possibility is that jmax is proportional to mesophyll volume (Xiao et al., 2016). In our model, such an assumption resulted in a leaf-level light response curve that was similar to the Rubisco proportionality assumption and that also fit the observed data well (Fig. 7). When assuming that jmax was proportional to the absorption profile, the shape of the leaf-level light response curve deviated more noticeably from the observed data, with a distinct plateau around 1,250 µmol m−2 s−1 PPFD. A very poor match between modeled and observed data occurred when we assumed that jmax was distributed proportionally to chlorophyll concentration. This resulted from a strong mismatch between the absorption profile, which peaked in the upper portion of the palisade mesophyll, and the chlorophyll distribution profile, which peaked in the spongy mesophyll. Such a mismatch would lead to a high level of excess absorption in the upper palisade and a substantial underutilization of jmax in the lower palisade and spongy regions. In all cases, the sun-grown leaf exhibited greater LUE under direct versus diffuse light conditions.
The j∞ curve (Figs. 2 and 3) describes the light absorbed by chlorophyll that drives electron transport within PSII: hence, β and ϕPSII in Equation 7. Yet, how β and ϕPSII are distributed along the leaf depth is not well understood (Evans, 2009). For instance, only small differences in β were observed between sun and shade chloroplasts (Evans, 1988). However, Evans (1987) found evidence that wavelength contributed to differences in β due to an excitation imbalance between PSI and PSII. More recent work suggests that the effect of this excitation imbalance on ϕPSII is greatest at wavelengths where absorption by carotenoids and nonphotosynthetic pigments is insignificant (Hogewoning et al., 2012). The ϕPSII of light absorption reflects numerous and dynamic biochemical processes and is even confounded with β (Evans, 2009). Hence, at low PPFD, wavelength-dependent reductions in ϕPSII are attributable to the excitation balance between PSI and PSII, along with the rate of light absorption by carotenoids and nonphotosynthetic pigments (Evans, 1987; Terashima et al., 2009; Hogewoning et al., 2012). Moreover, as certain regions of the leaf exceed their maximum electron transport capacity, leaf-level ϕPSII also begins to drop, leading to a change in the slope of the leaf-level light response curve (Fig. 8). Depending on the amount of excess light absorption, the leaf can dynamically respond at multiple time scales through nonphotochemical quenching mechanisms that further change ϕPSII (Guadagno et al., 2010).
Our model accounts for light-limited ϕPSII along the leaf depth, assuming that it is independent of PPFD intensity up to the point when jmax is reached (although ϕPSII may even vary at low PPFD; Hogewoning et al., 2012). This approach clearly delineates between light-limited ϕPSII and leaf-level changes in ϕPSII due to heterogenous saturation of jmax throughout the leaf.
By assuming constant values of 0.85 for light-limited ϕPSII and 0.45 for β, we were unable to accurately predict the observed leaf-level light response curves for the sun-grown or shade-grown leaf (Fig. 8). Instead, we best predicted the sun-grown leaf’s light response curve by assuming that ϕPSII increased linearly from 0.5 at the adaxial surface to 0.85 at the abaxial surface (similar to the observations of Oguchi et al. [2011]). The shade-grown leaf predictions, on the other hand, best matched the observed data by assuming a constant ϕPSII of 0.5 throughout the leaf. While the reasons for this discrepancy are unclear, it is possible that the sun- and shade-grown leaves differentially incurred photoinhibition due to excess light absorption during the light acclimation period. Specifically, Brodersen et al. (2008) acclimated both sets of leaves at 500 µmol m−2 s−1, which would likely induce different degrees of photoinhibition for the sun-grown versus shade-grown leaf. Without spatially resolved data on the degree of nonphotochemical quenching throughout each leaf, however, we cannot be certain of the mechanism underlying these apparent differences in light-limited ϕPSII between sun-grown and shade-grown leaves.
Another interesting result was the presence of a more substantial [CO2] drawdown within the intercellular airspace and chloroplast stroma in the sun-grown compared with shade-grown leaf (Fig. 4). The presence of a Ci (both Cias and Cliq) profile, and its relative importance, have been debated (Parkhurst, 1994; von Caemmerer, 2000; Piel et al., 2002; Ho et al., 2016). Here, we present modeling evidence that this drawdown existed in the intercellular airspace and chloroplast stroma of amphistomatous sun-grown leaf and was substantial. A relatively small, but notable, difference in this Ci profile of 9 to 12 ppm existed between direct and diffuse light. Furthermore, the drawdown between the intercellular airspace and the chloroplast stroma averaged 65 ppm, with a maximum of 93 ppm, in the sun-grown leaf under direct light. Interestingly, the location of the lowest Ci region corresponded to the saturation of electron transport capacity. Nonetheless, the thinner amphistomatous shade-grown leaf had a lower Ci difference within the leaf intercellular airspace (34 ppm average and 55 ppm maximum), which resulted from having a more even assimilation throughout the leaf and less overall demand for CO2 due to having less chloroplast volume per leaf area. Hence, a substantial Ci profile is most likely present, as demonstrated previously by Parkhurst (1994), implying that the intercellular airspace resistance would be finite and significant. This confirms the experimental evidence of Parkhurst and Mott (1990) for both amphistomatous and hypostomatous leaves and implies that both sun-grown and shade-grown leaves would be prone to a substantial variation in Ci within the airspace and chloroplast stroma. Moreover, diffuse light weakened the ability of the sun-grown leaf to draw down [CO2] within the leaf in comparison with direct light conditions.
Unlike the canopy, diffuse light leads to shallower penetration than direct light within sun-grown leaves. Furthermore, we demonstrated that sun-grown sunflower leaves excessively absorb diffuse light in the upper palisade cells at the expense of light availability in the lower palisade and spongy mesophyll. Thus, the leaf-level photosynthetic response to diffuse light in sunflower occurred opposite to the expected canopy-level increases in LUE (Gu et al., 2002; Alton et al., 2007; Urban et al., 2007, 2012; Alton, 2008; Kanniah et al., 2013; Williams et al., 2014; Cheng et al., 2015). We combined our leaf-level model with canopy-level observations of diffuse and direct light penetration to investigate this tradeoff (Fig. 9). When canopy-level extinction coefficients were relatively high (i.e. 1.06 and 0.82 for diffuse and direct light, respectively; Li et al., 2014), we predicted that deeper diffuse light penetration into the canopy of sun-grown leaves dominated the photosynthetic benefit of direct light within the upper canopy (Fig. 9). These predictions align with previous observations of the diffuse light enhancement of primary productivity in agricultural and natural systems (Alton, 2008; Kanniah et al., 2012). However, it has been observed that, as LAI drops (e.g. in savannahs and peat lands), the positive effect of diffuse light on primary productivity often becomes nonsignificant (Kanniah et al., 2012, 2013). Assuming that a drop in LAI tends to correlate with a lower canopy-level extinction coefficient, our model suggests that the photosynthetic benefit of direct light may become more pronounced in low-LAI systems. Such a mechanism, in addition to more similar canopy-level extinction coefficients between direct and diffuse light, could explain the dissociation between diffuse light and primary productivity as LAI decreases. Testing such a hypothesis in numerous agricultural and natural ecosystems could be an interesting path for future research, especially given recent work suggesting that a phenological bias may have contributed to a dramatic overestimation of diffuse light’s positive effect on primary productivity (Williams et al., 2016). Our model provides the opportunity to mechanistically link interleaf and canopy-level absorption gradients to explicitly test such effects of diffuse and direct light on photosynthesis.
CONCLUSION
Light directionality affects photosynthesis at the leaf and canopy levels, and our model gives additional insight into the mechanisms that govern the light utilization of different directional quality within the leaf. We demonstrate that sunflower shade leaves similarly absorb direct and diffuse light, leading to a similar photosynthetic output regardless of light directionality. Sun-grown sunflower leaves, however, photosynthesize more efficiently under direct than diffuse light due to more even light distribution and absorption in the mesophyll as PPFD increases, leading to a more homogenous saturation of jmax and, ultimately, a greater [CO2] drawdown within the mesophyll. Previous studies suggest that canopy-level net primary productivity is higher under diffuse compared with direct light, likely due to deeper penetration within the canopy. These observations, in light of our findings, imply a photosynthetic tradeoff at the leaf and canopy levels. We use our model to illustrate how the leaf-level decline in photosynthesis under diffuse light may have an increasing impact as the canopy-level extinction coefficient declines, for example, in lower LAI agricultural and natural systems. Thus, changes in light directionality associated with climate change will likely affect photosynthesis at both the leaf and, as shown previously, canopy levels. This study provides an important step in quantitatively linking internal light absorption to photosynthesis, which can be used to improve predictions of how natural and agricultural vegetation will respond to future light environments.
MATERIALS AND METHODS
Light Absorption Profiles
Previously measured light absorption profiles for sunflower (Helianthus annuus) were used in this study (Brodersen and Vogelmann, 2010). We averaged red, green, and blue light absorption profiles, assuming equal weights between colors, to simulate a combined white light absorption response as was used previously to measure gas exchange for sunflower leaves (Brodersen et al., 2008). We then calculated the likelihood of light absorption at any position between the leaf abaxial and adaxial surfaces, or the light absorption probability distribution (Fig. 1). To do this, we normalized the light absorption profiles measured by Brodersen and Vogelmann (2010) such that the integral of the curve equaled leaf-level absorption (hence, units of m−1). Thus, direct comparison among anatomically different leaves was possible.
1-D Photosynthesis Model
1-D Porous Medium FEM of CO2 Diffusion and Photosynthesis
We developed an open-source 1-D porous medium FEM of CO2 diffusion and photosynthesis using R statistical software (R Core Team, 2016; for code, see Supplemental Texts S1–S6). Compared with models based on the circuit-resistance analog, FEM can more accurately describe the interactive processes of CO2 diffusion and photosynthetic reaction within a spatially explicit leaf geometry (Parkhurst, 1994; Aalto and Juurola, 2002; Tholen and Zhu, 2011; Ho et al., 2016). We assume that since sunflower leaves have a relatively high stomatal density and a relatively porous, isotropic mesophyll airspace network, a 1-D model accurately represents the interaction between CO2 diffusional limitation and reactive demand. All parameters and constants used in the model are defined in Table I.
Leaf Geometry, Material Properties, and Boundary Conditions
We defined a simplified 1-D leaf geometry consisting of a stomatal inlet and a combination of intercellular airspace and palisade/spongy mesophyll cells. Corresponding approximately with Brodersen et al. (2008), leaf thickness was assumed to be 215 or 275 µm (transverse) for shade and sun leaves, respectively. At the upper and lower leaf boundaries, we assumed a constant concentration of 0.015 mol CO2 m−3, or 340 ppm. This value corresponds to a 15% reduction in CO2 relative to ambient levels of 400 ppm due to, for example, boundary layer resistance. We represented the mesophyll as a porous medium consisting of a reactive palisade and spongy tissue connected airspace. Consequently, each porous medium layer is geometrically defined by its airspace fraction (i.e. porosity, ϕ), airspace tortuosity (τ), and reactive chloroplast volume per mesophyll surface area (Vs). We represented the mesophyll as a combination of palisade and spongy cells defined by a difference in porosity and mesophyll surface area per leaf cross-sectional area (Sm). Palisade and spongy mesophyll cells were assumed to have porosity of 0.1 and 0.3 m3 m−3, respectively, and a tortuosity of 1.55 m m−1 (Syvertsen et al., 1995). Palisade mesophyll cells were defined such that, if they spanned the adaxial to abaxial surface, the sun leaf would have an Sm of 40 m2 m−2. Similarly, if spongy mesophyll cells spanned the adaxial to abaxial surface, the sun leaf would have an Sm of 6.5 m2 m−2. Based on measurements by Brodersen et al. (2008), the sun leaf and shade leaf were assumed to have 60% and 45% fpal, respectively, resulting in leaf-level Sm of 26.4 and 16.8 m2 m−2.
Each cell was assumed to be surrounded by a thin diffusion barrier defined by a conductance (gliq) to CO2 of 0.25 mm s−1, which integrates the diffusional limitations of the cell wall, plasmalemma, cytosol, chloroplast envelope, and chloroplast stroma. This value of gliq falls between previous estimates, which range from 0.08 to 1 mm s−1 (Evans et al., 2009). As sunflower has a relatively high chloroplast volume-to-mesophyll surface area ratio (Tomás et al., 2013), we assumed a value of 1.74 × 10⁻⁶ m3 stroma m−2 Vs, a value that is twice that assumed by Tholen and Zhu (2011). In our model, we represent the stroma and mitochondria as a single volume assuming a mitochondria-to-stroma volume ratio of 0.03 m3 m−3 (Tholen and Zhu, 2011).
Porous Medium Diffusion-Reaction Equation
We developed a FEM to solve a set of partial differential equations that describe CO2 diffusion, photosynthesis, and respiration throughout the 1-D leaf geometry. The partial differential equations were solved for steady state using the R library deSolve (Soetaert et al., 2010). Specifically, the diffusive flux of CO2 through the stomatal boundaries, intercellular airspace, and mesophyll cells was described by:
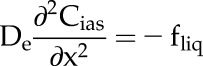 |
(1) |
| (2) |
where
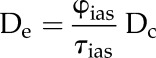 |
(3) |
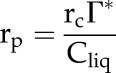
is the effective diffusivity of a porous medium composed of a porous intercellular airspace with a given porosity (φias; m3 m−3) and tortuosity (τias; m m−1), Dc is the diffusion coefficient (m2 s−1) for CO2 in the intercellular airspace, Cias is the [CO2] (mol m−3) at a depth z in the intercellular airspace, fliq is the volumetric rate of CO2 diffusion from the intercellular airspace into the chloroplast stroma (mol m−3 s−1), rc is the volumetric rate of ribulose 1,5-bisphosphate (RuBP) carboxylation (mol m−3 s−1), rd is the volumetric respiration rate (mol m−3 s−1), and rp is the volumetric photorespiration rate by Rubisco (mol m−3 s−1).
The volumetric rate of CO2 diffusion from the intercellular airspace into the chloroplast stroma, fliq, is defined as:
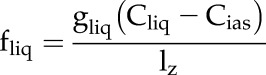 |
(4) |
where gliq is the CO2 conductance from the intercellular airspace into the chloroplast stroma (m s−1), Cliq (mol m−3) is the [CO2] in the stroma, and lz is the finite element length through which diffusion occurs (m).
The RuBP reaction term, rc, is derived from a biochemical model of C3 photosynthesis (Farquhar et al., 1980; von Caemmerer, 2000) in which the volumetric rate of CO2 fixation in the chloroplast is calculated as the minimum of the Rubisco-limited carboxylation rate, wc, and the RuBP regeneration-limited carboxylation rate, wj:
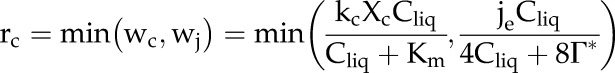 |
(5) |
where kc (s−1) is the catalytic rate of Rubisco, Xc (mol m−3) is the Rubisco concentration in the chloroplast, Km (mol m−3) is the effective Michaelis-Menten constant for Rubisco in the presence of oxygen, je (mol m−3 s−1) is the volumetric electron transport rate at an element of depth z (m) from the leaf adaxial surface, and Γ* (mol m−3) is the CO2 compensation point in the absence of mitochondrial respiration.
For each element at depth z, the electron transport rate, je, was calculated by the following rectangular hyperbolic equation (Terashima and Saeki, 1985):
| (6) |
where Θ is the curve’s convexity parameter between 0 and 1, je is the electron transport rate (mol e− m3 s−1), jmax is the rate capacity of PSII for electron transport (mol e− m3 s−1), and j∞ is the electron transport potential for a given incoming PPFD assuming unlimited jmax (mol e− m−3 s−1), defined as:
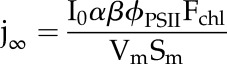 |
(7) |
where I0 is the incident PPFD (mol m−2 s−1), α is the leaf-level absorption (mol mol−1), β is the fraction of light absorbed by pigments associated with PSII (mol mol−1), ϕPSII is the quantum yield of PSII electron transport (mol e− transported by PSII mol−1 quanta absorbed), Fchl is the normalized chlorophyll fluorescence profile, Vm is the reactive chloroplast volume per mesophyll surface area (m3 m−2), and Sm is the mesophyll surface area per leaf surface area (m2 m−2).
In our model, each finite element has a thickness of ∼1 µm, which is smaller than the typical length of a chloroplast and similar to its width. Thus, within each element, we assume that Θ in Equation 6 equals 1 (Terashima and Saeki, 1985; Xiao et al., 2016), reflecting previous observations of light response curves measured for isolated cells and chloroplasts (Terashima and Saeki, 1985). When Θ equals 1, Equation 6 simplifies to:
| (8) |
As our model has subchloroplast spatial resolution, we assume that ϕPSII is independent of PPFD up to the point when electron transport capacity is reached (although ϕPSII may actually vary at low PPFD; Hogewoning et al., 2012). The quantum yield of PSII electron transport is often measured at the leaf surface and assumed to be homogenous throughout the leaf at a value of 0.85 for light-limited conditions (Evans, 1987; von Caemmerer, 2000; Xiao et al., 2016). The occurrence of a value below 1 arises from spectral differences in ϕPSII observed across the visible light range in which a minimum value occurs around 460 nm and a maximum occurs near 620 nm (Evans, 1987). Substantial variation exists among species in their spectrally explicit ϕPSII response curves, especially between 400 and 520 nm (McCree, 1971; Inada, 1976). Depending on the wavelength, reductions in ϕPSII are attributable to absorption by carotenoids and nonphotosynthetic pigments, along with imbalanced excitation between PSI and PSII (Evans, 1987; Terashima et al., 2009; Hogewoning et al., 2012). While ϕPSII appears to be independent of developmental PPFD (i.e. low versus high light; Evans, 1987), spectral differences between sun and shade conditions reduce ϕPSII for shade-type compared with sun-type leaves from 400 to 660 nm (Hogewoning et al., 2012). The relative distribution of PSI/PSII, chlorophyll a/b, carotenoids, and nonphotosynthetic pigments varies along the leaf depth (Terashima and Inoue, 1984; Nishio et al., 1993), suggesting that ϕPSII likely does as well (Evans, 2009). Reflecting this uncertainty about the spatial distribution of light-limited ϕPSII in sun and shade leaves, we tested several scenarios: (1) constant ϕPSII of 0.85 at all leaf depths, (2) constant ϕPSII of 0.55 at all leaf depths, and (3) decreasing ϕPSII with depth from 0.55 at the adaxial surface to 0.85 at the abaxial surface.
Interleaf chlorophyll fluorescence profiles, Fz, were measured under diffuse and direct irradiance in both sun- and shade-grown sunflower leaves as described above. Similar to Evans (2009), we assumed that cross-sectional fluorescence profiles describe the distribution of light absorption throughout the leaf. Thus, by multiplying leaf-level absorption, α, by normalized fluorescence distribution, Fz, we obtain the light absorption at any position z. Leaf-level absorption of sun and shade leaves was assumed to equal 0.72 and 0.69, respectively, based on Brodersen et al. (2008), and an additional reduction by 0.96 was applied in the case of diffuse light based on Gorton et al. (2010).
The maximum electron transport rate at depth z, jmax, was defined such that it sums to leaf-level electron transport, Jmax. We tested four scenarios regarding the distribution of electron transport throughout the leaf, assuming that it is proportional to the (1) Rubisco concentration, (2) light absorption profile, (3) mesophyll volume, or (4) chlorophyll distribution. Only a few studies have directly estimated the distribution of electron transport capacity along the leaf depth (Nishio et al., 1993; Evans and Vogelmann, 2003, 2006). In Spinacea oleracea, electron transport capacity closely tracked Rubisco concentration along the leaf depth (scenario 1). Theoretically, however, electron transport capacity should be distributed proportionally to light absorption to achieve maximum LUE (scenario 2; Terashima and Saeki, 1985; Farquhar, 1989). Additionally, we tested a scenario in which leaves distribute electron transport capacity proportionally to mesophyll volume (Xiao et al., 2016) and a scenario in which it is distributed proportionally to chlorophyll distribution. In the baseline scenario, we assumed that Rubisco concentration, Xc, was distributed based on the values measured by Nishio et al. (1993; Fig. 9). The maximum Xc occurred at around 60 and 75 μm from the adaxial surface, and the average of the entire distribution equaled the leaf-level value of Xc given in Table I.
In our model, we represented the stroma and mitochondria as a single volume; thus, the respiration rate 2.2 mol m−3 mitochondria s−1 was converted to a stroma volume basis assuming 0.03 m3 mitochondria m−3 stroma (Tholen and Zhu, 2011), resulting in a volumetric respiration rate, rd, of 0.066 mol m−3 s−1. The volumetric respiration rate was assumed to be constant and independent of the rate of photosynthesis.
We calculate the rate of photorespiratory CO2 release by Rubisco in the chloroplast, rp, according to the model by Farquhar et al. (1980) as:
 |
(9) |
Net CO2 assimilation on a leaf area basis, An, was calculated as:
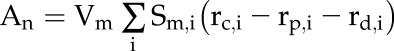 |
(10) |
such that An is the sum of rc, rp, and rd in each element, i, multiplied by the mesophyll volume per mesophyll surface area, Vm, and the mesophyll surface area per leaf area of each element, Sm,i. Since Sm,i is a function of element position, we account for the variation in mesophyll surface area between palisade and mesophyll tissue.
Sensitivity Analysis of Biochemical and Geometric Parameters
We tested the sensitivity of our model results by individually varying eight geometric and six biochemical parameters (Table II). Parameters were varied to test a broad range of potential, but realistic, values that enveloped the baseline scenario. The eight geometric parameters varied were stroma volume-to-mesophyll ratio (Vs), tortuosity of the intercellular airspace (τ), leaf surface area-to-spongy/palisade mesophyll surface area ratio (Sm,spg/Sm,pal), porosity of the spongy/palisade intercellular airspace (ϕspg/ϕpal), combined conductance of the cell wall, plasmalemma, cytosol, chloroplast envelope, and chloroplast stroma (gliq), and the fraction of palisade relative to spongy mesophyll cells (fpal). The six biochemical parameters varied were Rubisco concentration (Xc), Rubisco effective Michaelis-Menten constant (Km), catalytic rate of Rubisco (kc), maximum leaf-level photosynthetic electron transport rate (Jmax), fraction of light absorbed by PSII (β), and leaf-level light absorption (α). Table II shows the alternative values tested for each of these parameters. Across these scenarios, we compared leaf-level average net assimilation from 0 to 1,500 µmol m−2 s−1 PPFD (Ān) and the fitted leaf-level light response convexity parameter (Θ) under direct and diffuse light.
Photosynthetic Tradeoffs under Diffuse Light at Leaf and Canopy Levels
Using the results of our leaf-level model and existing canopy-level light extinction coefficients for diffuse versus direct light, we can examine potential photosynthetic tradeoffs at each scale. The amount of light available within a canopy, I, is often described by the Beer-Lambert equation as:
| (11) |
where I0 is the PPFD at the upper surface of the canopy, k is the extinction coefficient, and LAIc is the cumulative leaf area index at any position from the top to the bottom of the canopy (m2 m−2). For a given LAIc, a higher value of k corresponds with a greater fraction of light absorption at any layer within the canopy.
Canopy-level extinction coefficients for diffuse versus direct light were measured previously for glasshouse-grown tomato (Solanum lycopersicum; Li et al., 2014). For the same canopy, direct and diffuse light had extinction coefficients of 1.06 and 0.82, respectively, indicating deeper penetration into and more even irradiation of the entire canopy via diffuse light. Such differences in canopy-level extinction coefficients are thought to underlie the corresponding increases in photosynthesis under diffuse light.
For this example, we assume that similar patterns in extinction coefficients hold for sunflower. Then, we predict An along the LAIc profile using our leaf-level light response curves for sun- and shade-grown leaves under diffuse versus direct light. We assume that each plant has entirely sun- or shade-grown leaves. Next, we test the effect of reducing the extinction coefficients by 50%, which could occur due to, for example, pruning or a lower density of plants.
Supplemental Data
The following supplemental materials are available.
Supplemental Figure S1. Scenario in which maximum electron transport is proportional to absorption profile under direct and diffuse light conditions.
Supplemental Figure S2. Scenario in which maximum electron transport is proportional to mesophyll volume under direct and diffuse light conditions.
Supplemental Figure S3. Scenario in which maximum electron transport is proportional to chlorophyll distribution under direct and diffuse light conditions.
Supplemental Figure S4. Scenario in which maximum electron transport is proportional to absorption profile.
Supplemental Figure S5. Scenario in which maximum electron transport is proportional to mesophyll volume.
Supplemental Figure S6. Scenario in which maximum electron transport is proportional to chlorophyll distribution.
Supplemental Figure S7. For the sun-grown leaf, predicted and observed (mean values from Brodersen et al., 2008) leaf-level photosynthesis and Rubisco concentration at different distances from the leaf adaxial surface.
Supplemental Figure S8. Predicted and observed (mean values from Brodersen et al., 2008) leaf-level photosynthesis for the baseline scenario of the sun-grown leaf at low PPFD levels.
Supplemental Text S1. Light response curves for Helianthus annuus leaves irradiated with diffuse and direct light from Brodersen et al. (2008).
Supplemental Text S2. Chlorophyll fluorescence profile for shade-grown Helianthus annuus leaves irradiated with diffuse light based on Brodersen et al. (2010).
Supplemental Text S3. Chlorophyll fluorescence profile for sun-grown Helianthus annuus leaves irradiated with diffuse light based on Brodersen et al. (2010).
Supplemental Text S4. Chlorophyll fluorescence profile for shade-grown Helianthus annuus leaves irradiated with direct light based on Brodersen et al. (2010).
Supplemental Text S5. Chlorophyll fluorescence profile for sun-grown Helianthus annuus leaves irradiated with direct light based on Brodersen et al. (2010).
Supplemental Text S6. R code for 1D Leaf FEM Model.
Supplementary Material
Glossary
- LUE
light use efficiency
- LAI
leaf area index
- 1-D
one-dimensional
- FEM
finite element model
- PPFD
photosynthetic photon flux density
- RuBP
ribulose 1,5-bisphosphate
Footnotes
This work was supported by an Esau Postdoctoral Fellowship and by the Fonds de Recherche du Québec: Nature et Technologie (postdoctoral scholarship to G.T.-R.).
Articles can be viewed without a subscription.
References
- Aalto T, Juurola E (2002) A three-dimensional model of CO2 transport in airspaces and mesophyll cells of a silver birch leaf. Plant Cell Environ 25: 1399–1409 [Google Scholar]
- Alton PB. (2008) Reduced carbon sequestration in terrestrial ecosystems under overcast skies compared to clear skies. Agric Meteorol 148: 1641–1653 [Google Scholar]
- Alton PB, North PR, Los SO (2007) The impact of diffuse sunlight on canopy light-use efficiency, gross photosynthetic product and net ecosystem exchange in three forest biomes. Glob Change Biol 13: 776–787 [Google Scholar]
- Brient F, Bony S (2013) Interpretation of the positive low-cloud feedback predicted by a climate model under global warming. Clim Dyn 40: 2415–2431 [Google Scholar]
- Brodersen CR, Vogelmann TC (2010) Do changes in light direction affect absorption profiles in leaves? Funct Plant Biol 37: 403–412 [Google Scholar]
- Brodersen CR, Vogelmann TC, Williams WE, Gorton HL (2008) A new paradigm in leaf-level photosynthesis: direct and diffuse lights are not equal. Plant Cell Environ 31: 159–164 [DOI] [PubMed] [Google Scholar]
- Carslaw KS, Lee LA, Reddington CL, Pringle KJ, Rap A, Forster PM, Mann GW, Spracklen DV, Woodhouse MT, Regayre LA, et al. (2013) Large contribution of natural aerosols to uncertainty in indirect forcing. Nature 503: 67–71 [DOI] [PubMed] [Google Scholar]
- Cheng SJ, Bohrer G, Steiner AL, Hollinger DY, Suyker A, Phillips RP, Nadelhoffer KJ (2015) Variations in the influence of diffuse light on gross primary productivity in temperate ecosystems. Agric Meteorol 201: 98–110 [Google Scholar]
- Demmig-Adams B. (1998) Survey of thermal energy dissipation and pigment composition in sun and shade leaves. Plant Cell Physiol 39: 474–482 [Google Scholar]
- Evans J. (1987) The dependence of quantum yield on wavelength and growth irradiance. Aust J Plant Physiol 14: 69 [Google Scholar]
- Evans JR. (1988) Acclimation by the thylakoid membranes to growth irradiance and the partitioning of nitrogen between soluble and thylakoid proteins. Funct Plant Biol 15: 93–106 [Google Scholar]
- Evans JR. (2009) Potential errors in electron transport rates calculated from chlorophyll fluorescence as revealed by a multilayer leaf model. Plant Cell Physiol 50: 698–706 [DOI] [PubMed] [Google Scholar]
- Evans JR, Kaldenhoff R, Genty B, Terashima I (2009) Resistances along the CO2 diffusion pathway inside leaves. J Exp Bot 60: 2235–2248 [DOI] [PubMed] [Google Scholar]
- Evans JR, Vogelmann TC (2003) Profiles of C-14 fixation through spinach leaves in relation to light absorption and photosynthetic capacity. Plant Cell Environ 26: 547–560 [Google Scholar]
- Evans JR, Vogelmann TC (2006) Photosynthesis within isobilateral Eucalyptus pauciflora leaves. New Phytol 171: 771–782 [DOI] [PubMed] [Google Scholar]
- Farquhar GD. (1989) Models of integrated photosynthesis of cells and leaves. Philos Trans R Soc Lond B Biol Sci 232: 357–367 [Google Scholar]
- Farquhar GD, von Caemmerer S, Berry JA (1980) A biochemical model of photosynthetic CO2 assimilation in leaves of C3 species. Planta 149: 78–90 [DOI] [PubMed] [Google Scholar]
- Gorton HL, Brodersen CR, Williams WE, Vogelmann TC (2010) Measurement of the optical properties of leaves under diffuse light. Photochem Photobiol 86: 1076–1083 [DOI] [PubMed] [Google Scholar]
- Greenwald R, Bergin MH, Xu J, Cohan D, Hoogenboom G, Chameides WL (2006) The influence of aerosols on crop production: a study using the CERES crop model. Agric Syst 89: 390–413 [Google Scholar]
- Gu L, Baldocchi D, Verma SB, Black TA, Vesala T, Falge EM, Dowty PR (2002) Advantages of diffuse radiation for terrestrial ecosystem productivity. J Geophys Res Atmos 107: 1–23 [Google Scholar]
- Guadagno CR, Virzo De Santo A, D’Ambrosio N (2010) A revised energy partitioning approach to assess the yields of non-photochemical quenching components. Biochim Biophys Acta 1797: 525–530 [DOI] [PubMed] [Google Scholar]
- Ho QT, Berghuijs HNC, Watté R, Verboven P, Herremans E, Yin X, Retta MA, Aernouts B, Saeys W, Helfen L, et al. (2016) Three-dimensional microscale modelling of CO2 transport and light propagation in tomato leaves enlightens photosynthesis. Plant Cell Environ 39: 50–61 [DOI] [PubMed] [Google Scholar]
- Hogewoning SW, Wientjes E, Douwstra P, Trouwborst G, van Ieperen W, Croce R, Harbinson J (2012) Photosynthetic quantum yield dynamics: from photosystems to leaves. Plant Cell 24: 1921–1935 [DOI] [PMC free article] [PubMed] [Google Scholar]
- Inada K. (1976) Action spectra for photosynthesis in higher plants. Plant Cell Physiol 17: 355–365 [Google Scholar]
- Johnson DM, Smith WK, Vogelmann TC, Brodersen CR (2005) Leaf architecture and direction of incident light influence mesophyll fluorescence profiles. Am J Bot 92: 1425–1431 [DOI] [PubMed] [Google Scholar]
- Johnstone JA, Dawson TE (2010) Climatic context and ecological implications of summer fog decline in the coast redwood region. Proc Natl Acad Sci USA 107: 4533–4538 [DOI] [PMC free article] [PubMed] [Google Scholar]
- Kanniah KD, Beringer J, Hutley L (2013) Exploring the link between clouds, radiation, and canopy productivity of tropical savannas. Agric Meteorol 182–183: 304–313 [Google Scholar]
- Kanniah KD, Beringer J, North P, Hutley L (2012) Control of atmospheric particles on diffuse radiation and terrestrial plant productivity: a review. Prog Phys Geogr 36: 209–237 [Google Scholar]
- Li T, Heuvelink E, Dueck TA, Janse J, Gort G, Marcelis LFM (2014) Enhancement of crop photosynthesis by diffuse light: quantifying the contributing factors. Ann Bot (Lond) 114: 145–156 [DOI] [PMC free article] [PubMed] [Google Scholar]
- McCree KJ. (1971) The action spectrum, absorptance and quantum yield of photosynthesis in crop plants. Agric Meteorol 9: 191–216 [Google Scholar]
- Mercado LM, Bellouin N, Sitch S, Boucher O, Huntingford C, Wild M, Cox PM (2009) Impact of changes in diffuse radiation on the global land carbon sink. Nature 458: 1014–1017 [DOI] [PubMed] [Google Scholar]
- Nishio JN, Sun J, Vogelmann TC (1993) Carbon fixation gradients across spinach leaves do not follow internal light gradients. Plant Cell 5: 953–961 [DOI] [PMC free article] [PubMed] [Google Scholar]
- Oguchi R, Douwstra P, Fujita T, Chow WS, Terashima I (2011) Intra-leaf gradients of photoinhibition induced by different color lights: implications for the dual mechanisms of photoinhibition and for the application of conventional chlorophyll fluorometers. New Phytol 191: 146–159 [DOI] [PubMed] [Google Scholar]
- Oguchi R, Hikosaka K, Hirose T (2003) Does photosynthetic light acclimation need change in leaf anatomy? Plant Cell Environ 26: 505–512 [Google Scholar]
- Parkhurst DF. (1994) Tansley Review No. 65. Diffusion of CO2 and other gases inside leaves. New Phytol 126: 449–479 [DOI] [PubMed] [Google Scholar]
- Parkhurst DF, Mott K (1990) Intercellular diffusion limits to CO2 uptake in leaves: studies in air and helox. Plant Physiol 94: 1024–1032 [DOI] [PMC free article] [PubMed] [Google Scholar]
- Piel C, Frak E, Le Roux X, Genty B (2002) Effect of local irradiance on CO2 transfer conductance of mesophyll in walnut. J Exp Bot 53: 2423–2430 [DOI] [PubMed] [Google Scholar]
- R Core Team (2016) R: A Language and Environment for Statistical Computing. R Foundation for Statistical Computing, Vienna, Austria. https://www.R-project.org/
- Soetaert K, Petzoldt T, Setzer W (2010) Solving differential equations in R: package deSolve. J Stat Softw 33: 1–2520808728 [Google Scholar]
- Syvertsen JP, Lloyd J, McConchie C, Kriedemann PE, Farquhar GD (1995) On the relationship between leaf anatomy and CO2 diffusion through the mesophyll of hypostomatous leaves. Plant Cell Environ 18: 149–157 [Google Scholar]
- Terashima I, Fujita T, Inoue T, Chow WS, Oguchi R (2009) Green light drives leaf photosynthesis more efficiently than red light in strong white light: revisiting the enigmatic question of why leaves are green. Plant Cell Physiol 50: 684–697 [DOI] [PubMed] [Google Scholar]
- Terashima I, Hanba YT, Tazoe Y, Vyas P, Yano S (2006) Irradiance and phenotype: comparative eco-development of sun and shade leaves in relation to photosynthetic CO2 diffusion. J Exp Bot 57: 343–354 [DOI] [PubMed] [Google Scholar]
- Terashima I, Inoue Y (1984) Comparative photosynthetic properties of palisade tissue chloroplasts and spongy tissue chloroplasts of Camellia japonica L.: functional adjustment of the photosynthetic apparatus to light environment within a leaf. Plant Cell Physiol 25: 555–563 [Google Scholar]
- Terashima I, Saeki T (1985) A new model for leaf photosynthesis incorporating the gradients of light environment and of photosynthetic properties of chloroplasts within a leaf. Ann Bot (Lond) 56: 489–499 [Google Scholar]
- Tholen D, Zhu XG (2011) The mechanistic basis of internal conductance: a theoretical analysis of mesophyll cell photosynthesis and CO2 diffusion. Plant Physiol 156: 90–105 [DOI] [PMC free article] [PubMed] [Google Scholar]
- Tomás M, Flexas J, Copolovici L, Galmés J, Hallik L, Medrano H, Ribas-Carbó M, Tosens T, Vislap V, Niinemets Ü (2013) Importance of leaf anatomy in determining mesophyll diffusion conductance to CO2 across species: quantitative limitations and scaling up by models. J Exp Bot 64: 2269–2281 [DOI] [PMC free article] [PubMed] [Google Scholar]
- Urban O, Janouš D, Acosta M, Czerný R, Marková I, Navrátil M, Pavelka M, Pokorný R, Šprtová M, Zhang R, et al. (2007) Ecophysiological controls over the net ecosystem exchange of mountain spruce stand: comparison of the response in direct vs. diffuse solar radiation. Glob Change Biol 13: 157–168 [Google Scholar]
- Urban O, Klem K, Ač A, Havránková K, Holišová P, Navrátil M, Zitová M, Kozlová K, Pokorný R, Šprtová M, et al. (2012) Impact of clear and cloudy sky conditions on the vertical distribution of photosynthetic CO2 uptake within a spruce canopy. Funct Ecol 26: 46–55 [Google Scholar]
- Urban O, Klem K, Holišová P, Šigut L, Šprtová M, Teslová-Navrátilová P, Zitová M, Špunda V, Marek MV, Grace J (2014) Impact of elevated CO2 concentration on dynamics of leaf photosynthesis in Fagus sylvatica is modulated by sky conditions. Environ Pollut 185: 271–280 [DOI] [PubMed] [Google Scholar]
- Vogelmann TC, Evans JR (2002) Profiles of light absorption and chlorophyll within spinach leaves from chlorophyll fluorescence. Plant Cell Environ 25: 1313–1323 [Google Scholar]
- Vogelmann TC, Han T (2000) Measurement of gradients of absorbed light in spinach leaves from chlorophyll fluorescence profiles. Plant Cell Environ 23: 1303–1311 [Google Scholar]
- von Caemmerer S. (2000) Biochemical Models of Leaf Photosynthesis. CSIRO, Canberra, Australia [Google Scholar]
- Williams IN, Riley WJ, Kueppers LM, Biraud SC, Torn MS (2016) Separating the effects of phenology and diffuse radiation on gross primary productivity in winter wheat. J Geophys Res G Biogeosciences 121: 1903–1915 [Google Scholar]
- Williams M, Rastetter EB, Van der Pol L, Shaver GR (2014) Arctic canopy photosynthetic efficiency enhanced under diffuse light, linked to a reduction in the fraction of the canopy in deep shade. New Phytol 202: 1267–1276 [DOI] [PubMed] [Google Scholar]
- Xiao Y, Tholen D, Zhu XG (2016) The influence of leaf anatomy on the internal light environment and photosynthetic electron transport rate: exploration with a new leaf ray tracing model. J Exp Bot 67: 6021–6035 [DOI] [PMC free article] [PubMed] [Google Scholar]
Associated Data
This section collects any data citations, data availability statements, or supplementary materials included in this article.