Abstract
We report on combining a self-aspirated sampling probe and an ESI source using a single metal capillary which is electrically grounded and safe for use by the operator. To generate an electrospray, a negative H.V. is applied to the counter electrode of the ESI emitter to operate in positive ion mode. The sampling/ESI capillary is enclosed within another concentric capillary similar to the arrangement for a standard pneumatically assisted ESI source. The suction of the liquid sample is due to the Venturi effect created by the high-velocity gas flow near the ESI tip. In addition to serving as the mechanism for suction, the high-velocity gas flow also assists in the nebulization of charged droplets, thus producing a stable ion signal. Even though the potential of the ion source counter electrode is more negative than the mass spectrometer in the positive ion mode, the electric field effect is not significant if the ion source and the mass spectrometer are separated by a sufficient distance. Ion transmission is achieved by the viscous flow of the carrier gas. Using the present arrangement, the user can hold the ion source in a bare hand and the ion signal appears almost immediately when the sampling capillary is brought into contact with the liquid sample. The automated analysis of multiple samples can also be achieved by using motorized sample stage and an automated ion source holder.
Keywords: ambient mass spectrometry, remote mass spectrometry, electrospray ionization, in-situ MS
INTRODUCTION
In the case where the absolute amount of a sample is not critical, it would be beneficial to perform high throughput mass spectrometry with minimal or no sample preparation for the rapid screening of multiple samples and the in-vivo analysis of living specimens in their native state. The development of “ambient mass spectrometry” has grown rapidly in response to this need. The term, which is nearly synonymous with “in-situ MS,” first appeared in Science in 2006,1) to describe the ambient ionization capability of DESI (desorption electrospray ionization) and DART (direct analysis in real time). Since then, a more refined term such as “ambient ionization mass spectrometry” has also been used in the literature to cover all kinds of atmospheric pressure ion sources that can be used directly with raw samples without or with minimum clean-up or a separation step. There are a large number of ambient ionization sources, each with their own name and acronym, but the ionization mechanisms are largely based on ESI and gas phase chemical ionization.
Ambient MS is usually performed with commercial mass spectrometers with its original ESI or APCI source removed to accommodate the custom-made ion source. Representative examples are DESI, in which high-velocity charged droplets are splashed onto the sample surface to extract and ionize the surface constituent,2) and DART, in which hot metastable helium atoms are used to thermally desorb and to ionize surface compounds.3) Other ESI variants are ELDI (electrospray-assisted laser desorption ionization),4) PESI (probe electrospray),5) liquid junction sampling ESI,6) direct ESI for tissue samples,7,8) and paper substrates.9–11) APCI variants include the use of a dielectric barrier discharge source for the ionization of gaseous compounds.12–14)
Ambient ionization is usually conducted in close proximity to the ion sampling inlet of the mass spectrometer to maximize ion transmission. Additional measures are needed when dealing with a large sized sample or a sample stage that cannot be fitted close to the MS instrument. A number of methods, including AFAI (Air Flow Assisted Ionization) have been developed to address this issue.15) These techniques use pneumatic assistance to transport the ion generated by DESI or ESI and is performed, at a distance of about 0.5~>1 m from the ion inlet of the mass spectrometer.15,16) Recently, we also performed in-vivo MS on living mouse that was located approximately 2 m away from the MS using probe electrospray ionization (PESI).17) The ion was collected remotely using a 1/8 inch metallic tube and a small auxiliary pump was used to provide additional negative pressure.17) In addition to ions, neutral aerosol generated remotely by laser ablation can also be transported to an ESI source for post-ionization.18) Recently, a remotely operated REIMS (Rapid Evaporative Ionization Mass Spectrometry) ion source has been incorporated into surgical devices such as electric and ultrasonic scalpels to sample and ionize the aerosol generated during the incision and the removal of tumors.19) The system consisted of an electrosurgical knife, REIMS, and a diagnostic data processing unit is referred to as an intelligent knife or “iKnife.”20)
In principle, in-situ ionization can be performed by direct electrospray simply by placing a capillary needle in contact with the sample liquid at one end and generating ESI at the other end. Ideally, the capillary needle should be short so that the liquid can be easily taken up and be sprayed purely by electrostatic and capillary actions. Such an arrangement was adopted by some research groups using a nanoESI capillary with the non-emitting end dipped into the target liquid/specimen.21) However, for most commercial instruments, the first ion sampling flange is held at or near ground potential, and that requires that a living specimen be carefully isolated and slowly charged to a high potential of several kV with respect to the ground. The HV hazard is one of the risks besides the unwanted electrochemical effects on the sample during the charging and discharging processes. Here, we explore a novel arrangement in which the sampling probe and ESI emitter are combined into a single capillary which is held at ground potential. In this study, we evaluated the characteristics of this liquid sampling ion source and discuss some of the issues related to optimization.
EXPERIMENTAL
Ion source unit
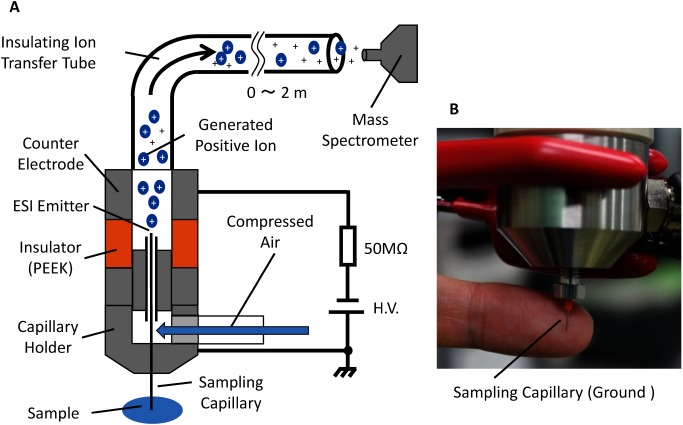
A simplified schematic of the ion source used in this study is shown in Fig. 1A. A stainless steel capillary was used as the sampling probe for a liquid sample at one end, and as the ESI emitter at the other end. The housing unit that held the ESI capillary and the counter electrode were separated with an insulator made of polyetheretherketone (PEEK). The sampling/ESI capillary was inserted into another concentric stainless steel tube (hereafter referred to as the sheath tube) with an i.d. of 0.5 mm. For the default sampling/ESI capillary of 0.2 mm o.d., the gap between the capillary and the sheath tube was ∼0.15 mm. Air from an air compressor flowed through this gap at a high velocity, which creates a reduced pressure around the tip of the ESI emitter due to the Venturi effect which can be described mathematically by the Bernoulli principle. The pressure difference between the ends of the ESI capillary draws the liquid to the tip of the ESI emitter.
Fig. 1. (A) Schematic of the self-aspirated direct sampling ESI source. The sampling capillary is held at ground potential for the safety of the operator as well as for in-vivo and in-situ mass spectrometry. The electrospray is initiated by applying a high negative potential to the counter electrode for detection in the positive ion mode. The ions and charged droplets are transported to the inlet of the mass spectrometer by the carrier gas from an air compressor. (B) Photograph of the fabricated ion source.
In this ion source, the ESI emitter is electrically held at ground or any potential that is suitable for the sample. The electrospray is generated when a high potential is applied to the counter electrode. In the positive ion mode, a negative potential of about −3 kV was applied to the counter electrode. Ions generated in the enclosed ion source unit were transported to a position in close proximity to the ion sampling inlet of the mass spectrometer using a flexible polymer tube (Tygon, i.d.: 3.18 mm, o.d.: 6.35 mm, Formulation: R-3603, Saint-Gobain K.K., Tokyo, Japan). The gap between the ion inlet of the mass spectrometer and the ion transport tube outlet was approximately 2 mm. Two mass spectrometers were used in this study. One was a linear ion trap mass spectrometer (LTQ-Velos), and the other one was a Fourier transform mass spectrometer (Orbitrap Exactive). Both were obtained from Thermo Fisher Scientific, Yokohama, Japan.
ESI/sampling capillary
Three types of capillaries were tested: I) a commercial ESI capillary (New Objective, Woburn, USA) with an i.d. of 50 μm and an o.d. of 320 μm, II) a custom-made capillary with an i.d. of 100 μm and an o.d. of 200 μm, and III) a custom-made capillary with an i.d. of 150 μm and an o.d. of 310 μm. The material used for the custom-made capillary was SUS 304 grade stainless steel (Nilaco, Tokyo, Japan). To fabricate a custom-made capillary, a 5 cm length of the stainless steel tube, purchased commercially from Nilaco, was cut, and the burrs at both ends were removed by electropolishing using a sulfuric acid/phosphoric acid (1/2 v/v) mixture. The electro-polishing was performed by dipping the freshly cut capillary in the etchant and applying a potential of 5 V between the capillary and a counter electrode for about 5 min. Unless otherwise stated, the default capillary was II.
Motorized automatic sampling
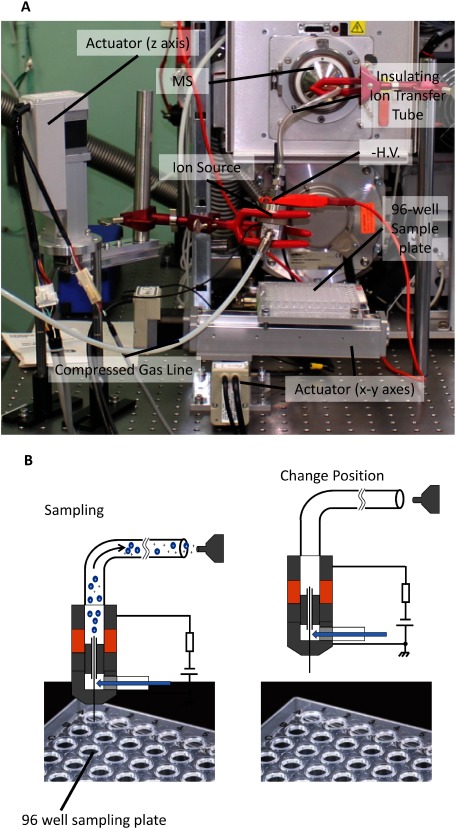
A 3-axes motorized automatic sampling system, as shown in Fig. 2A, was constructed for the multi-sample analysis using the developed ion source. The movement of the sample stage was driven by two linear actuators in horizontal (x–y) axes. The position of the sampling probe/ESI source was controlled by another actuator in the vertical (z) axis. A 96 sample plate was installed on the top of the x–y stage. The movement of sample stage and the operation sequence were controlled using a custom-made program written in C# (Microsoft, Redmond, USA).
Fig. 2. (A) Photograph showing the custom-made automatic sampling system for liquid samples deposited in a 96-well microplate. The sample plate is moved in the horizontal direction by two linear actuators. The position of the sampling probe and ESI is controlled by a third linear actuator moving in the vertical direction. (B) Operating sequence for the automatic sampling process.
Sample preparation
Pure water, generated using Simplicity UV (Millipore, Darmstadt, Germany), was mixed with reagent grade methanol (1 : 1 v/v) for the sample preparation and for cleaning the ESI capillary during the automatic measurement process. Cytochrome c, myoglobin, and ubiquitin were purchased from Sigma-Aldrich (Tokyo, Japan). The concentrations for all samples were 10−5M.
RESULTS AND DISCUSSION
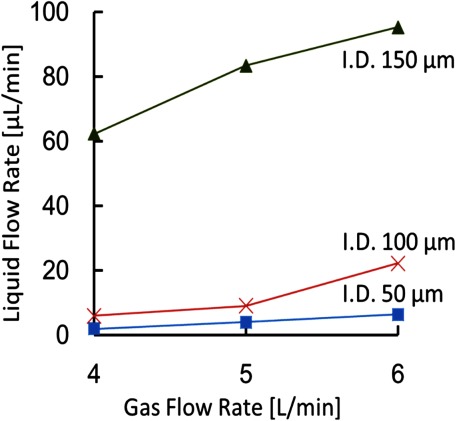
Figure 3 shows the relationship between the flow rates of the carrier gas and the flow rate of a liquid sample for the fabricated ion source. The flow rate was estimated by measuring the time required to aspirate 5 μL of the water/methanol solution. Three sampling/ESI capillaries were tested here: I) i.d.: 50 μm and o.d.: 320 μm, II) i.d.: 100 μm and o.d.: 200 μm, and III) i.d.: 150 μm. and o.d.: 310 μm. The flow rate of air from the compressor was varied from 4 to 6 L/min. The high-velocity gas stream that flowed past the ESI emitter reduced the pressure around its tip, which created a pressure difference between both ends of the ESI capillary. By neglecting the effect of gravity, the pressure difference across the capillary, Δp is given by the Bernoulli Equation by:
| (1) |
where ρ is the density of air, Δp is the differential pressure, v2 is the gas flow velocity (fast) at the tip of the capillary, and v1 is the gas flow velocity at the far end of the streamline which can be neglected in this case. The dimensions of the capillaries and the flow rate of gas determines the velocity of air exiting from the outer capillary and a higher gas flow rate, and hence a higher gas velocity would, therefore, result in a higher liquid volumetric flow rate. The liquid flow rate, QLiq is given by the Hagen–Poiseuille law as:
| (2) |
where r is the inner radius of the capillary, Δp is the differential pressure generated at both ends of the capillary, l is the length of the capillary, and μ is the viscosity coefficient of the sample. The differential pressures calculated with the Hagen–Poiseuille equation for a gas flow rate of 6 L/min are 0.6 bars for Capillary I, 0.1 bars for Capillary II, and 0.1 bars for Capillary III. The corresponding flow velocities are approximately 307 m/s, 125 m/s, and 125 m/s, respectively. Capillary I had the largest o.d., hence, the smallest gap between the capillary and the sheath tube, therefore, the differential pressure was the highest because the gas velocity is the highest. Besides the gap, the differential pressure was also sensitive to the position of the inner capillary. If the inner capillary was adjusted to a position very close to the exit of the sheath tube, it would cause a backflow of gas rather than aspirating the liquid. To obtain an appreciable pressure difference, the inner capillary needed to protrude slightly (0.5–1 mm) from the sheath tube. The reason that capillary II and capillary III have the same differential pressure is that, in the case of Capillary III, the solution flow rate was sufficiently large for our application, and its position had not been fine-tuned to reach the maximum pressure difference. Nevertheless, the ionization efficiency for capillary III was inferior due to a high solution flow rate, and for capillary I, reproducibility was low due to the frequent clogging of the capillary, therefore, Capillary II was chosen as the default capillary and was used throughout this study.
Fig. 3. Relationship between the flow rate of the carrier gas and the flow rate of a liquid sample for the constructed ion source. The flow rate of gas determines the velocity of air flow and the pressure around the ESI emitter, hence the flow rate of the liquid sample that is aspirated into the sampling capillary. The solution is water/methanol (1 : 1 v/v).
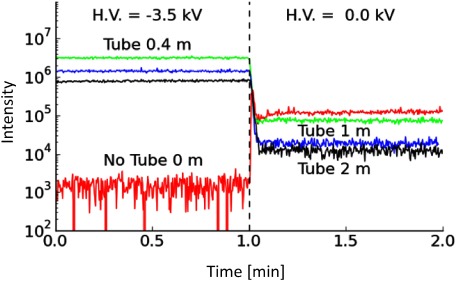
The length of the ion transport tube, (a flexible plastic tube with an i.d. of 3.18 mm that connected the ion source to the ion inlet of the mass spectrometer) was an important parameter in the design of the current ion source. Figure 4 shows a comparison of the total ion intensities for cytochrome c (sum of peak intensities from charge-state 7+ to 14+) acquired using ion transport tubes of different lengths: 0.4, 1, and 2 m. The mass spectrometer used in this measurement was the Orbitrap Exactive spectrometer. A high potential of –3.5 kV was applied to the counter electrode while the sampling/ESI emitter was grounded. The sample was cytochrome c in 0.1% v/v acetic acid prepared in a water/methanol solution. Also shown in the ion chronogram is the effect of removing the H.V. at the counter electrode. In addition to the length of the tube, there was a 2 mm gap between the inlet of the mass spectrometer and the outlet of the ion transfer tube. The flow rate of air was 6 L/min. Ion signals could also be observed, even without the application of H.V. to the counter electrode because the gas velocity in our experiment was relatively high compared to normal ESI, thus permitting an ionization process similar to that of supersonic spray to take place.22) Nevertheless, the ion signal was relatively weak without H.V.
Fig. 4. Total ion intensities for cytochrome c from charge-states 7+ to 14+ acquired using ion transport tubes with different lengths. Green: 0.4 m, Blue: 1 m, Black: 2 m, and Red: 0 m. The concentration of the samples is 10−5 M in 0.1% (v/v) acetic acid water/methanol 1 : 1 solution. A high potential of −3.5 kV was applied to the counter electrode while the ESI emitter was held at ground potential. Also shown in the ion chronogram is the effect of removing the −3.5 kV from the counter electrode.
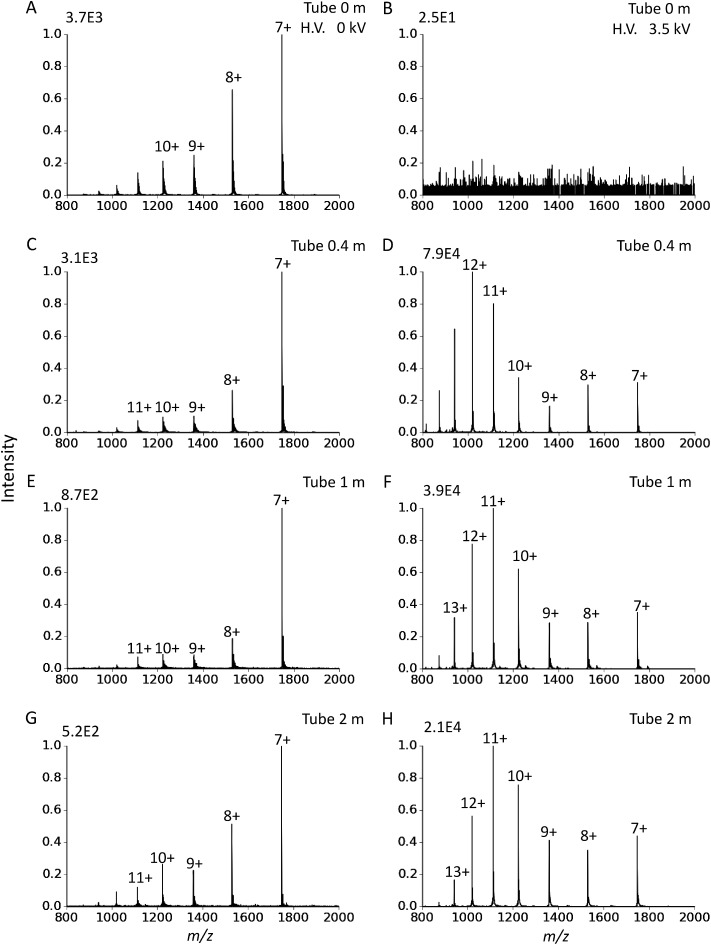
The corresponding mass spectra for cytochrome c acquired using ion transport tubes of different lengths are shown in Fig. 5. In Figs. 5A and 5B, no ion transport tube was used. Ion loss was greater when a longer ion transport tube was used. On the other hand, when the ion source was placed in close proximity to the MS inlet (Tube length=0 m), the ion signal was minimal with the application of HV because the electric field between the ion source and MS repels the ions, thus preventing them from entering the inlet. The strength of the electric field decays with distance. In this study, we found that a separating distance of ∼0.4 m between the ion source and MS inlet was sufficient to make the repulsive electric force negligible or be balanced out by the drag force from the viscous flow. In addition to the drop in overall ion intensities, Figs. 5D, 5F, and 5H show that the charge-state distribution is shifted slightly towards the lower charge state with increasing length of the ion transport tube. This observation is in agreement with the electrosonic spray for which the average charge state decreases with increasing distance between the spray tip and the inlet.23)
Fig. 5. Mass spectra of cytochrome c acquired using different lengths of ion transport tubes before and after the application of −3.5 kV to the counter electrode. (A) and (B) : 0 m (without ion transport tube), (C) and (D): 0.4 m, (E) and (F): 1 m, (G) and (H): 2 m. For (A), (C), (E) and (G), the counter electrode is at ground potential, while for (B), (D), (F) and (H), the counter electrode is held at −3.5 kV.
Figure 6 shows an automated analysis of multiple samples using the present ion source and an automated sample stage. A standard 96-well plate was used and each well contained either 100 μL of analyte or cleaning solution. The LTQ-Velos spectrometer was used in this measurement. The MS acquisition time for each sample well was set to 60 s. When a sampling capillary with an i.d. of 100 μm was used in conjunction with a gas flow rate of 6 L/min, the solution flow rate was ∼22 μL/min. Therefore each measurement for a particular sample consumed approximately 22 μL of sample solution. Cleanings solution samples were placed between each actual sample to clean the sampling capillary before the start of the next measurement to reduce memory effects. The cleaning solvent was a 1 : 1 (v/v) mixture of methanol and water. The ion chronogram shows the selected ion signal for cytochrome c (red, charge-state 8+), myoglobin (green, 13+) and ubiquitin (blue, 6+). Ion signals appeared almost immediately when the sampling capillary was dipped into the liquid sample. In this measurement, the tailing in the ion chronogram during the cleaning process for cytochrome c, myoglobin, and ubiquitin were 3.6, 12, and 6 s, respectively. The minimum time required for the cleaning of capillary depends on the sample concentration, solution viscosity, and the affinity of the sample for the capillary surface. Overall, it was well below 20 s, and this could be further shortened by optimizing the composition of cleaning solvent, surface modification of the ESI capillary, and by employing a shorter capillary.
Fig. 6. Analysis of multiple samples using the present ion source and an automated sample stage. Ion chronogram shows the selected ion signal for cytochrome c (red, charge-state 8+), myoglobin (green, 13+) and ubiquitin (blue, 6+). Ion signals appear almost immediately once the sampling capillary comes into contact with the liquid sample. Each measurement lasts for 60 s. A cleaning step was added in the operating sequence before the start of the next measurement to reduce memory effects. The cleaning solvent was water/methanol 1 : 1. The inner diameter of the sampling/ESI capillary was a 100 μm.
CONCLUSION
A simple remote sampling electrospray ion source was developed in which the solution was self-aspirated into the ESI capillary due to the pressure difference between both ends of the sampling/ESI capillary. The pressure drop around the ESI tip was due to a Venturi effect created by the high-velocity gas flow through the ESI tip. The high-velocity gas also provided pneumatic assistance to the ESI to generate highly stable ion signals that were similar to signals produced using turbo ion spray and supersonic spray techniques. The sampling capillary was electrically held at ground or any potential that was suitable for use in the measurement. It was safe for the operator to hold the sampling device in the bare hands. Further work on improving the efficiency of ion transmission and the speed of capillary cleaning will be reported in the future.
Acknowledgments
The work described in this paper was supported by a Grant-in-Aid for Scientific Research (Grant No. 26505003) from the Japan Society for the Promotion of Science.
Mass Spectrom (Tokyo) 2016; 5(2): S0068
References
- 1) R. G. Cooks, Z. Ouyang, Z. Takats, J. M. Wiseman. Ambient mass spectrometry. Science 311: 1566–1570, 2006. [DOI] [PubMed] [Google Scholar]
- 2) Z. Takáts, J. M. Wiseman, B. Gologan, R. G. Cooks. Mass spectrometry sampling under ambient conditions with desorption electrospray ionization. Science 306: 471–473, 2004. [DOI] [PubMed] [Google Scholar]
- 3) R. B. Cody, J. A. Laramée, H. D. Durst. Versatile new ion source for the analysis of materials in open air under ambient conditions. Anal. Chem. 77: 2297–2302, 2005. [DOI] [PubMed] [Google Scholar]
- 4) J. Shiea, M.-Z. Huang, H.-J. HSu, C.-Y. Lee, C.-H. Yuan, I. Beech, J. Sunner. Electrospray-assisted laser desorption/ionization mass spectrometry for direct ambient analysis of solids. Rapid Commun. Mass Spectrom. 19: 3701–3704, 2005. [DOI] [PubMed] [Google Scholar]
- 5) L. C. Chen, K. Nishidate, Y. Saito, K. Mori, D. Asakawa, S. Takeda, T. Kubota, H. Hori, K. Hiraoka. Characteristics of probe electrospray generated from a solid needle. J. Phys. Chem. B 112: 11164–11170, 2008. [DOI] [PubMed] [Google Scholar]
- 6) G. J. Van Berkel, V. Kertesz, K. A. Koeplinger, M. Vavrek, A.-N. T. Kong. Liquid microjunction surface sampling probe electrospray mass spectrometry for detection of drugs and metabolites in thin tissue sections. J. Mass Spectrom. 43: 500–508, 2008. [DOI] [PubMed] [Google Scholar]
- 7) J. Liu, H. Wang, R. G. Cooks, Z. Ouyang. Leaf spray: Direct chemical analysis of plant material and living plants by mass spectrometry. Anal. Chem. 83: 7608–7613, 2011. [DOI] [PubMed] [Google Scholar]
- 8) B. Hu, L. Wang, W.-C. Ye, Z.-P. Yao. In vivo and real-time monitoring of secondary metabolites of living organisms by mass spectrometry. Sci. Rep. 3: 2104, 2013. [DOI] [PMC free article] [PubMed] [Google Scholar]
- 9) H. Wang, J. Liu, R. G. Cooks, Z. Ouyang. Paper spray for direct analysis of complex mixtures using mass spectrometry. Angew. Chem. Int. Ed. 122: 889–892, 2010. [DOI] [PubMed] [Google Scholar]
- 10) H. Wang, N. E. Manicke, Q. Yang, L. Zheng, R. Shi, R. G. Cooks, Z. Ouyang. Direct analysis of biological tissue by paper spray mass spectrometry. Anal. Chem. 83: 1197–1201, 2011. [DOI] [PMC free article] [PubMed] [Google Scholar]
- 11) J. Liu, H. Wang, N. E. Manicke, J.-M. Lin, R. G. Cooks, Z. Ouyang. Development, characterization, and application of paper spray ionization. Anal. Chem. 82: 2463–2471, 2010. [DOI] [PubMed] [Google Scholar]
- 12) K. Hiraoka, S. Ninomiya, L. C. Chen, T. Iwama, M. K. Mandal, H. Suzuki, O. Ariyada, H. Furuya, K. Takekawa. Development of double cylindrical dielectric barrier discharge ion source. Analyst (Lond.) 136: 1210–1215, 2011. [DOI] [PubMed] [Google Scholar]
- 13) L. C. Chen, Z. Yu, H. Furuya, Y. Hashimoto, K. Takekawa, H. Suzuki, O. Ariyada, K. Hiraoka. Development of ambient sampling chemi/chemical ion source with dielectric barrier discharge. J. Mass Spectrom. 45: 861–869, 2010. [DOI] [PubMed] [Google Scholar]
- 14) N. Na, M. Zhao, S. Zhang, C. Yang, X. Zhang. Development of a dielectric barrier discharge ion source for ambient mass spectrometry. J. Am. Soc. Mass Spectrom. 18: 1859–1862, 2007. [DOI] [PubMed] [Google Scholar]
- 15) J. He, F. Tang, Z. Luo, Y. Chen, J. Xu, R. Zhang, X. Wang, Z. Abliz. Air flow assisted ionization for remote sampling of ambient mass spectrometry and its application. Rapid Commun. Mass Spectrom. 25: 843–850, 2011. [DOI] [PubMed] [Google Scholar]
- 16) R. B. Dixon, M. S. Bereman, D. C. Muddiman, A. M. Hawkridge. Remote mass spectrometric sampling of electrospray- and desorption electrospray-generated ions using an air ejector. J. Am. Soc. Mass Spectrom. 18: 1844–1847, 2007. [DOI] [PMC free article] [PubMed] [Google Scholar]
- 17) K. Yoshimura, L. C. Chen, H. Johno, M. Nakajima, K. Hiraoka, S. Takeda. Development of non-proximate probe electrospray ionization for real-time analysis of living animal. Mass Spectrom. (Tokyo) 3: S0048, 2014. [DOI] [PMC free article] [PubMed] [Google Scholar]
- 18) L. R. Compton, B. Reschke, J. Friend, M. Powell, A. Vertes. Remote laser ablation electrospray ionization mass spectrometry for non-proximate analysis of biological tissues. Rapid Commun. Mass Spectrom. 29: 67–73, 2015. [DOI] [PubMed] [Google Scholar]
- 19) K.-C. Schäfer, J. Dénes, K. Albrecht, T. Szaniszló, J. Balog, R. Skoumal, M. Katona, M. Tóth, L. Balogh, Z. Takáts. In vivo, in situ tissue analysis using rapid evaporative ionization mass spectrometry. Angew. Chem. Int. Ed. 48: 8240–8242, 2009. [DOI] [PubMed] [Google Scholar]
- 20) J. Balog, L. Sasi-Szabó, J. Kinross, M. R. Lewis, L. J. Muirhead, K. Veselkov, R. Mirnezami, B. Dezső, L. Damjanovich, A. Darzi, J. K. Nicholson, Z. Takáts. Intraoperative tissue identification using rapid evaporative ionization mass spectrometry. Sci. Transl. Med. 5: 194ra93, 2013. [DOI] [PubMed] [Google Scholar]
- 21) P. A. Kottke, F. L. Degertekin, A. G. Fedorov. Scanning mass spectrometry probe: A scanning probe electrospray ion source for imaging mass spectrometry of submerged interfaces and transient events in solution. Anal. Chem. 82: 19–22, 2010. [DOI] [PMC free article] [PubMed] [Google Scholar]
- 22) A. Hirabayashi, M. Sakairi, H. Koizumi. Sonic spray ionization method for atmospheric pressure ionization mass spectrometry. Anal. Chem. 66: 4557–4559, 1994. [Google Scholar]
- 23) Z. Takáts, J. M. Wiseman, B. Gologan, R. G. Cooks. Electrosonic spray ionization. A gentle technique for generating folded proteins and protein complexes in the gas phase and for studying ion–molecule reactions at atmospheric pressure. Anal. Chem. 76: 4050–4058, 2004. [DOI] [PubMed] [Google Scholar]


