Abstract
Longitudinal Myelin Water Imaging was carried out in vivo to characterize white matter damage following dorsal column transection (DC Tx) injury at the lumbar level L1 of rat spinal cords. A transmit-receive implantable coil system was used to acquire multiple spin-echo (MSE) quantitative T2 data from the lumbar spinal cords of 16 rats at one week pre-injury as well as 3 and 8 weeks post-injury (117 microns in-plane resolution and 1.5 mm slice thickness). In addition, ex vivo MSE and DTI data were acquired from cords fixed and excised at 3 or 8 weeks post injury using a solenoid coil. The MSE data were used to generate Myelin Water Fractions (MWFs) as a surrogate measure of myelin content, while DTI data were acquired to study damage to the axons. Myelin damage was assessed histologically with Eriochrome cyanine (EC) and Myelin Basic Protein in degenerated myelin (dgen-MBP) staining, and axonal damage was assessed by neurofilament-H in combination with neuron specific beta-III-tubulin (NF/Tub) staining. These MRI and histological measures of injury were studied in the dorsal column at 5 mm cranial and 5 mm caudal to injury epicenter. MWF increased significantly at 3 weeks post-injury at both the cranial and caudal sites, relative to baseline. The values on the cranial side of injury returned to baseline at 8 weeks post-injury but remained elevated on the caudal side. This trend was found in both in vivo and ex vivo data. This MWF increase was likely due to the presence of myelin debris, which were cleared by 8 weeks on the cranial, but not the caudal, side. Both EC and dgen-MBP stains displayed similar trends. MWF showed significant correlation with EC staining (R = 0.63, p = 0.005 in vivo and R = 0.74, p = 0.0001 ex vivo). MWF also correlated strongly with the dgen-MBP stain, but only on the cranial side (R = 0.64, p = 0.05 in vivo; R = 0.63, p = 0.038 ex vivo). This study demonstrates that longitudinal MWI in vivo can accurately characterize white matter damage in DC Tx model of injury in the rat spinal cord.
Introduction
Functional loss following spinal cord injury (SCI) is largely caused by the interruption or demyelination of axonal tracts in the white matter. In particular, many axons that remain intact following injury lose their function due to myelin degradation as a result of oligodendrocytes undergoing cell death [1, 2]. Myelin is essential for the conduction of nervous signals [3], and the initial loss of myelin and subsequent chronic demyelination process has been proposed to play a major role in the loss of motor and sensory function and poor recovery following SCI [4]. Myelin repair has therefore been identified as a major goal in many experimental therapies for SCI. In some ways, re-establishing myelin around existing axons appears easier than reconstructing neurons and re-growing their connections [5, 6]. Therefore, significant effort has been directed to designing restoration therapies that rebuild myelin at the injury site by cellular transplantation [7]. Pre-clinical assessment of the efficacy of such therapies would strongly benefit from a non-invasive technique capable of measuring myelin content repetitively over prolonged periods of time.
MRI is currently the most effective radiological method for assessing SCI. However, standard MRI techniques are unable to directly measure the myelin content in white matter tracts, since most of NMR signal from myelin protons has completely decayed before it can be recorded ( since the T2 of these protons is typically much shorter than 1 ms [8]). Several methods have been developed to identify myelin indirectly by studying properties of water associated with myelin sheaths and its interaction with protons associated with proteins and lipids that form myelin sheaths. One such technique, called Myelin Water Imaging (MWI), exploits the differences in T2 relaxation times between various water compartments in the Central Nervous System (CNS), including water trapped in between myelin sheaths, intra-/extra-axonal water, and free water in CSF [9]. MWI provides a surrogate measure of myelin content by calculating the Myelin Water Fraction (MWF), which is the fractional amount of water trapped between myelin bilayers, as identified by the relative amplitude of the short T2 components of multi-exponential decay curves extracted from the multiple spin echo images [10]. Histological analysis has shown good correlation between myelin content and MWF in normal and diseased brain and spinal cord tissue [11, 12].
In a previous work, we have successfully applied MWI to measurements of myelin content in excised rat spinal cords [12, 13]. Specifically, in a dorsal column transection (DC Tx) model we have shown that MWF correlates better with the myelin content assessed by histology than the more commonly used measure of transverse diffusivity. Recently, we applied ex vivo MWI to characterize the efficacy of transplant skin-progenitor cell-derived Schwann cells (SKP-SC) therapy in neuroprotection and white matter repair following a contusion injury in rat spinal cord [14]. Our results showed good correlation with histology and demonstrated that the structural effect of SKP-SC therapy in rat spinal cords is measurable by examining lesion size, myelin water fraction, and longitudinal diffusivity ex vivo. These and other results thus strongly suggest that MWI is a good candidate for non-invasive longitudinal assessment of re-myelination therapies in the pre-clinical setting.
In this work, we present results of an in vivo longitudinal Myelin Water Imaging measurements in the DC Tx model. This model is particularly suitable to evaluate the sensitivity of MWI to spinal cord pathology because of the well defined injury pattern, which shows degeneration at the fasciculus gracilis cranial to injury, and the cortico-spinal tract (CST) caudal to injury. The main objective of this study was to determine the applicability of MWI in assessing temporal changes of myelin content in the in vivo rat spinal cord following injury. Axonal damage was assessed with DTIdata, which were acquired ex vivo only to minimize the in vivo experiment time.
Materials and methods
Animal procedures
All experimental procedures were carried out in compliance with guidelines of the Canadian Council for Animal Care and were approved by the institutional Animal Care Committee. Sixteen adult male Sprague-Dawley rats (250–300 g) were obtained from a breeding facility at the University of British Columbia and acclimatized for seven days prior to the beginning of the study. The animals were randomly divided into 2 groups: 8 animals were scanned at two time points (2 days pre-injury and 3 weeks post-injury), and the remaining animals were scanned at 3 time points (2 days pre-injury, 3 and 8 weeks post-injury).
9 days before dorsal column transection, rectangular coils 22 x 19 mm were surgically implanted over the lower thoracic and lumbar spine (T12/L1) as described previously [15]. The coils were secured by suturing the arches to the closest rib, i.e. cranial arch was sutured to the 11th rib, and the caudal arch to the 13th rib. A baseline MRI scan was performed 7 days later (2 days pre-injury) as described below.
Dorsal column transection was carried out as described before [13]. Briefly, animals were anesthetized with 2% isofluorane and placed in prone position within a stereotaxic surgical frame; the skin on the neck was then shaved and disinfected. A laminectomy of the T12 lamina was performed with a pair of small rongeurs. The dorsal column transection was performed with a pair of micro-scissors. Inflicting injury one week following the RF coil implantation required opening the wound to re-expose the spinal column.
For MRI experiments, animals were anaesthetized with isofluorane (5% induction, 2% maintenance) mixed with medical air and positioned supine in a specially designed holder. Respiratory rate and body temperature were monitored using an MRI compatible monitoring system (SA Instruments, Stony Brook, NY). Heated circulating water was used to maintain the body temperature at 37°C.
At three weeks post-injury, the 8 animals in the first group were deeply anaesthetized by an overdose of chlorohydrate (100 mg/kg i.p., BDH Chemicals, Toronto ON, Canada) and perfused intracardially with phosphate buffered saline (PBS) for 3 minutes followed by freshly hydrolyzed paraformaldehyde (4%) in 0.1M sodium phosphate buffer at pH 7.4. Spinal cords were then harvested and post-fixed overnight in the same fixative. Ex vivo MRI measurements were carried out one day after the excision and post-fixation of the cords. The remaining animals were sacrificed at eight weeks post-injury in the same manner. The detailed timeline of the study is shown in Figure 1.
Figure 1.
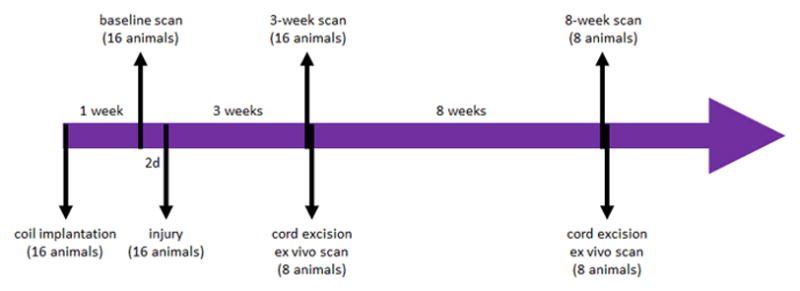
Timeline of the study: 16 animals underwent baseline scan one week following the coil implantation procedure; two days after the baseline scans all animals underwent DC Tx injury; 3 weeks post injury all animals underwent in vivo scan; 8 animals were sacrificed immediately following the scan, their cords excised and scanned ex vivo 24 hours later; the remaining 8 animals were scanned in vivo at 8 weeks post injury, sacrificed immediately following the scan, and their cords excised and imaged ex vivo 24 hours later.
MRI experiments
MRI was carried out on a 7T animal scanner (Bruker, Biospin Gmbh, Germany). All rats were scanned in vivo with the MWI technique 2 days before injury (1 week after coil implantation) and 3 weeks after injury. The cords from one half of the rats were excised after the 3 week post-injury scans and scanned ex vivo using MWI and DTI techniques. The remaining rats were maintained and scanned in vivo using MWI at 8 weeks post-injury, with subsequent cord excision and ex vivo MWI and DTI scans one day later.
For the in vivo experiments, an implantable coil system was used for pulse transmission and signal reception. The coil system consisted of a rectangular loop (22 x 19 mm), surgically implanted over the lumbar spinal cord and inductively coupled to an external 3 cm diameter pick up coil. The ex vivo experiments used a five-turn solenoid coil with 15 mm inner diameter and 20 mm length. The excised spinal cords were placed in a plastic tube filled with the fixative, alongside a plastic rod to prevent it from bending.
Myelin Water Imaging was carried out using a single slice, multi echo sequence [16] with the following parameters: FOV = 3 cm in vivo/2.56 cm ex vivo, matrix size 256 x 256, TR/TE = 1500/6.378 ms, 48 echoes, slice thickness = 1.5 mm in vivo/1.0 mm ex vivo, and 6 averages. The in vivo acquisition was triggered by the respiratory sensor. The triggering resulted in 10–20% increase in total imaging time, which increased slightly SNR of the acquired images, and had a minimal effect on the T2 decay curves. The measurements were carried out on two slices positioned 5 mm cranial and 5 mm caudal to the injury site. Locations of these slices were referenced to the epicentre of injury identified from the T2-weighted anatomical images acquired in sagittal and coronal slice orientations.
The ex vivo DTI data were collected from the excised cords using a multi-slice spin-echo sequence with the following parameters: TR/TE = 2000/21.337 ms, matrix size 128 × 128, FOV = 1.28 cm, slice thickness 1 mm, 4 averages, diffusion sensitizing gradients in six non-collinear directions using icosahedral encoding scheme [17] and b = 750s/mm2. The DTI data were acquired ex vivo only to minimize the already long acquisition time in vivo. The main purpose of collecting the DTI data was to assess the extent of axonal damage, which cannot be done with MWI only. The DTI results were subsequently compared to histology (see below).
Histology
Following the ex vivo MRI, the excised cords were cryoprotected in a stepwise immersion in 12%, 18% and 24% sucrose (in 0.1M phosphate buffer) and snap frozen in dry-ice cooled isopentane. Serial cross sections of the spinal cords were generated on a cryostat at 20 micron thickness (Microm, Heidelberg, Germany). The location of the sections along the cord corresponded to the positions of the MRI slices (i.e. 5 mm cranial and 5 mm caudal to injury, as measured from the cranial end of the excised cord with ex vivo MRI). The frozen spinal cord sections were thawed and stained in Eriochrome–cyanine (EC) solution (0.16% EC, 0.4% sulfuric acid and 0.4% ferric chloride) at room temperature for 10 min. After a gentle rinse in distilled water, slides were differentiated in 0.5% ferric ammonium sulfate at room temperature for about 2 minutes, counterstained with 1% Neutral Red and cover-slipped using Entellan mounting medium (EM Science, Gibbstown, NJ).
In addition, the sections were immunostained with an antibody to Myelin Basic Protein in degenerating myelin (“dgen-MBP”, 1:1000, Chemicon Inc. Temecula, CA), or a rabbit anti-neurofilament-H antibody (NF/Tub, 1:500, Serotec, Oxford, UK) in combination with an antibody to neuronal class III β-Tubulin (1:500, Covance, Berkeley, CA) to stain axons, as described previously [13].
Images of histological sections were collected using Northern Eclipse software (Empix Imaging Inc., Mississauga, ON, Canada) on a Zeiss Axioplan 2 microscope. The exposure time, gain and limit setting were adjusted to give maximum contrast between white and grey matter, and were kept the same throughout the measurements of a specific stain. The histological sections were processed using Image J 1.43u (National Institutes of Health, USA). The EC images were collected at 5x magnification in standard bright field illumination. The dgen-MBP and axonal stain images were collected at 10x magnification using Epifluorescence microscope.
Data processing and analysis
Data from both in vivo and ex vivo experiments were processed with software procedures developed in-house using Matlab (The MathWorks Inc., Natick, MA). Complex CPMG data were phased using temporal phase correction [18] and the real part of the data was used for further processing. CPMG data were modeled for stimulated echoes generated by the imperfect refocusing pulses, using the Extended Phase Graph Algorithm [19]. Continuous T2 distributions were calculated from the ROIs manually drawn around the dorsal column (Figure 2a) using non-negative least squares (NNLS) analysis [20] with the cross-validated regularizer value [21]. Myelin Water Fraction (MWF) values were calculated in the ROIs by integrating the T2 distribution between 7.75 and 20 ms and dividing the result by the total integral of the T2 distribution.
Figure 2.
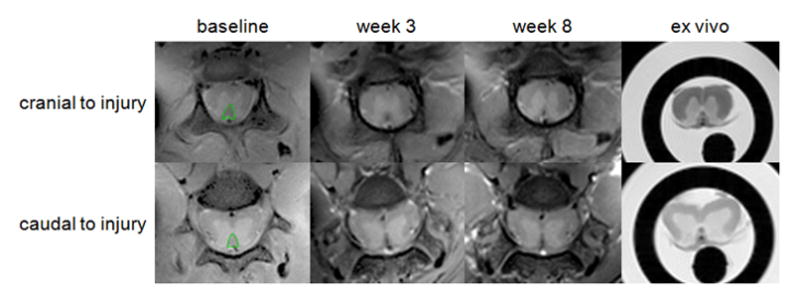
(a) The first echoes of the CPMG data acquired in vivo at baseline (left) and at 3 weeks (middle) and 8 weeks (right) post injury and ex vivo. Shown are axial cross-sections acquired 5 mm cranial (top) and 5 mm caudal (bottom) to the injury site. Manually drawn ROIs encompassing the dorsal column are marked in green.
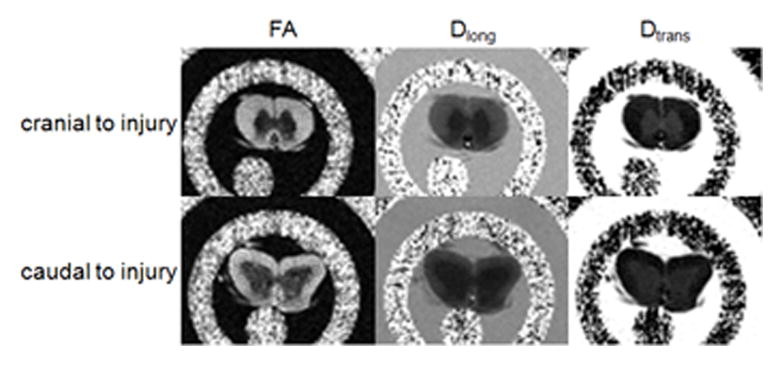
(b) Parametric maps calculated from the DTI data: fractional anisotropy (FA – left), longitudinal diffusivity (Dlong – middle) and transverse diffusivity (Dtrans – right) acquired ex vivo 5 mm cranial (top) and 5 mm caudal (bottom) to injury.
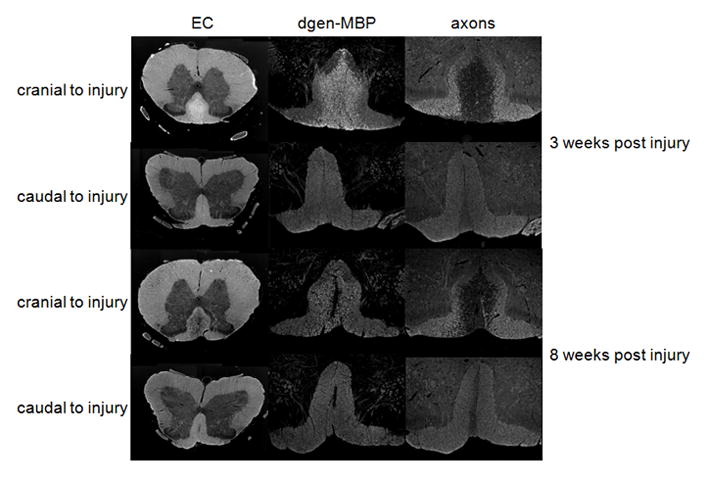
(c) Myelin stain (Eriochrome cyanine EC – left), degenerated myelin stain (dgen-MBP – middle) and axonal stain (right) from spinal cords excised 3 weeks (top two rows) and 8 weeks (bottom two rows) post injury. Only dorsal column (DC) is shown for the dgen-MBP and axonal stains. Notice increased EC staining in the dorsal column at 3 weeks post-injury on the cranial side due to large amount of myelin debris, as confirmed by the increase in dgen-MBP stain. Myelin debris are largely cleared at 8 weeks post-injury, as confirmed by the dgen-MBP stain, and significant demyelination is confirmed by the lower optical density of the EC stain.
DTI data were processed with the software procedures available on the MRI scanner. These procedures were used to diagonalize the diffusion tensor and to generate maps of principal diffusivities (λ1, λ2, λ3) and Fractional Anisotropy (FA). Software procedures developed in-house with Igor Pro (Wave Metrics Inc., Lake Oswego, OR) were used to calculate average values of FA and longitudinal and transverse diffusivities (Dlong and Dtrans) in the manually drawn ROIs encompassing the dorsal column.
For all histological stains, the average optical density was calculated from the manually drawn ROIs encompassing the dorsal column. To minimize variability due to tissue processing, these measurements were normalized to the average optical density from the ROIs manually drawn around the lateral parts of the dorsal column. Care was taken to include only the uninjured tissue in these ROIs (Figure 3).
Figure 3.
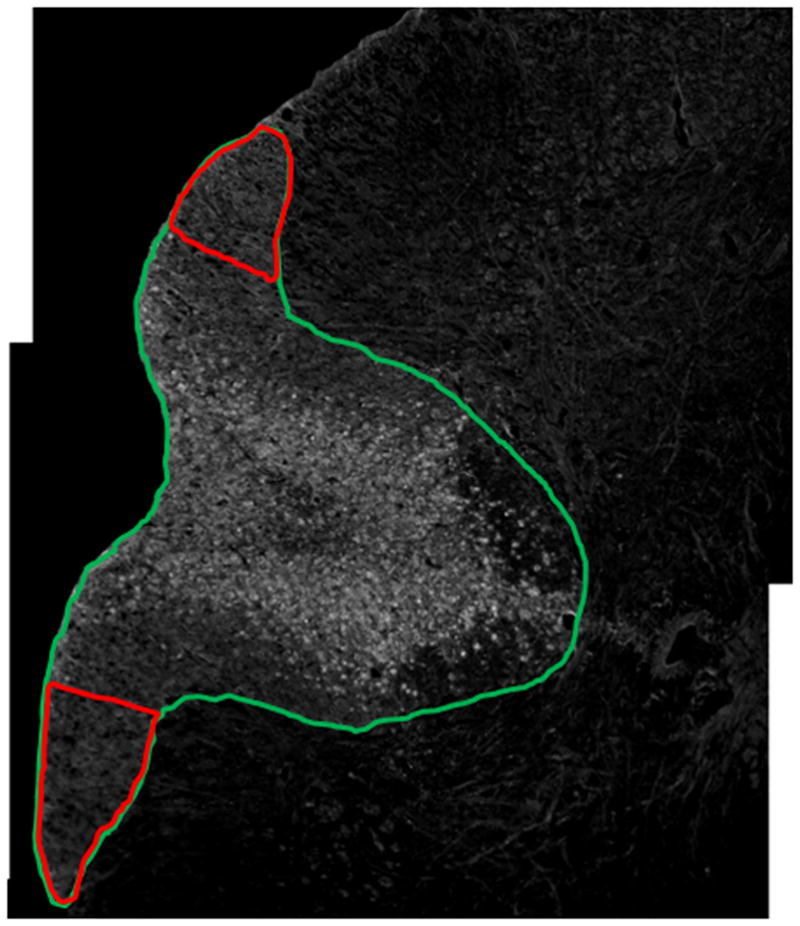
Histological section immunostained with dgen-MBP. The green ROI shows the entire dorsal column, while the red ROIs show the uninjured lateral dorsal column regions used for normalization.
Statistical analyses were carried out using MedCalc 12.4 (MedCalc Software, Mariakerke, Belgium). Data across all the experimental groups showed normal distribution, as shown by the Kolmogorov-Smirnov test, therefore parametric tests were used in all statistical analyses. Paired (where possible) or two-tail independent t-test was carried out to test for significant changes in MRI and histology parameters between experimental groups; the changes were considered statistically significant for p < 0.05. Correlation between MRI and histology was assessed by calculating the Pearson correlation coefficient.
Results
Three animals had to be euthanized due to health problems at different times throughout the experiment and the MRI data quality collected from one animal was not suitable for further processing. Overall, good quality MRI data were collected in vivo from 16 animals at baseline, 14 animals at 3 weeks post injury and 5 animals at 8 weeks post injury. The ex vivo data were collected from 6 animals each at 3 and 8 weeks post injury.
Figure 4 shows representative T2 distributions acquired at baseline and 3 and 8 weeks post-injury from the dorsal column 5 mm cranial (Figure 4a) and 5 mm caudal (Figure 4b) to injury. As can be seen from the signal decay curves, a potential flow artifact due to the presence of a large vessel at the bottom of the dorsal column (see Figure 2a) was minimized by the selection of the ROIs. Table 1 shows the average MWF values and optical densities of EC and dgen-MBP stains at different time points. MWF increased significantly at 3 weeks post-injury on both the cranial and the caudal site, as compared to baseline. The values on the cranial side of injury returned to baseline at 8 weeks post-injury; however, they remained elevated on the caudal side. Ex vivo data also show significant decrease in MWF values on the cranial side at 8 weeks as compared to 3 weeks, and unchanged MWF values on the caudal side. Both EC and dgen-MBP stains showed similar trends (Table 1).
Figure 4.
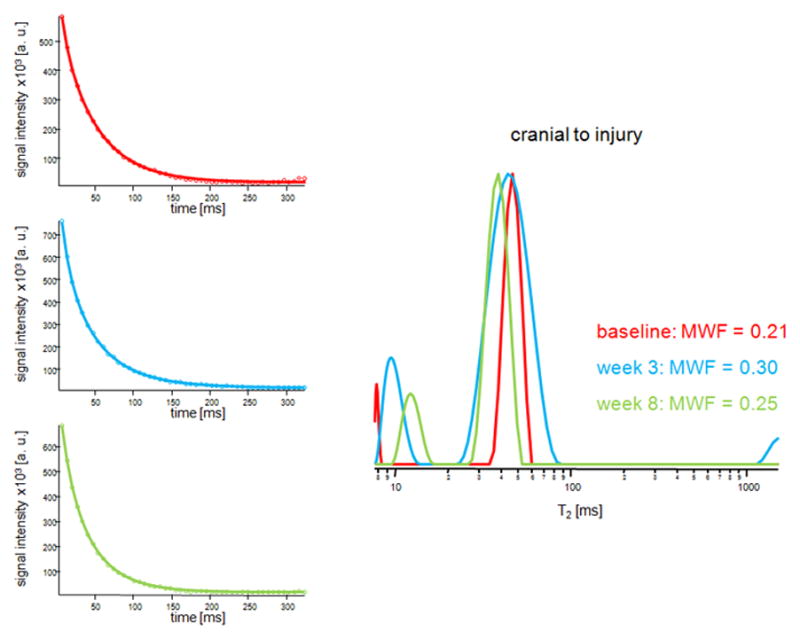
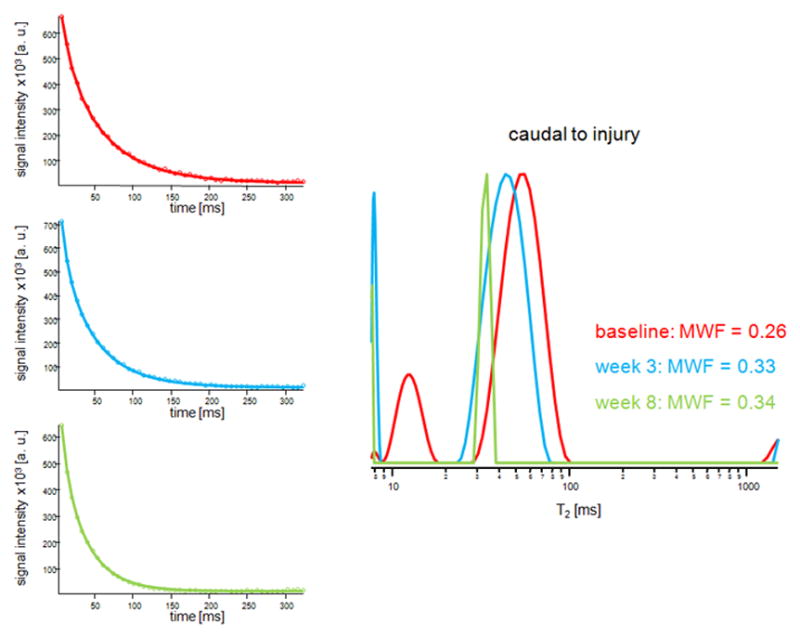
Representative T2 decay curves and fitted models (left) and the T2 distributions from the dorsal column acquired at baseline (red) and 3 weeks (blue) and 8 weeks (green) post injury. Shown are distributions from the slices 5 mm cranial (a) and 5 mm caudal (b) to the injury site.
Table 1.
Average Myelin Water Fraction (MWF) values and optical densities of functional (EC) and degenerated (dgen-MBP) myelin stains at baseline and at 3 weeks and 8 weeks post injury.
| MWF (in vivo) | MWF (ex vivo) | EC stain | dgen-MBP stain | |||||
|---|---|---|---|---|---|---|---|---|
| cranial | caudal | cranial | caudal | cranial | caudal | cranial | caudal | |
| baseline | 0.24 ± 0.07 | 0.22 ± 0.05 | - | - | - | - | - | - |
| 3 weeks | 0.30 ± 0.05a, b | 0.30 ± 0.06a | 0.48 ± 0.02d, e | 0.42 ± 0.04 | 1.07 ± 0.04d | 1.02 ± 0.04 | 1.43 ± 0.29f | 1.01 ± 0.06 |
| 8 weeks | 0.24 ± 0.01 | 0.32 ± 0.05c | 0.37 ± 0.02 | 0.40 ± 0.06 | 0.85 ± 0. 03 | 1.06 ± 0.06 | 1.22 ± 0.07 | 1.11 ± 0.12 |
significantly different than baseline (p < 0.05)
significantly different than 8 weeks (p < 0.05)
significantly different than baseline (p < 0.01)
significantly different than 8 weeks (p < 0.001)
significantly different than caudal (p < 0.01)
significantly different than caudal (p < 0.05)
Table 2 shows the average values of FA, Dlong and Dtrans, as well as the optical density of the axonal stain at 3 and 8 weeks post injury. At 3 weeks post-injury, all parameters showed significantly lower values on the cranial side, as compared to the caudal side, suggesting more significant axonal damage cranial to injury (Table 2).
Table 2.
Average Fractional Anisotropy (FA), and longitudinal (Dlong) and transverse (Dtrans) diffusivities values, and optical densities of axonal stain at 3 weeks and 8 weeks post injury.
| FA | Dlong | Dtrans | axonal stain | |||||
|---|---|---|---|---|---|---|---|---|
| cranial | caudal | cranial | caudal | cranial | caudal | cranial | caudal | |
| 3 weeks | 0.46 ± 0.09 a | 0.77 ± 0.05 | 0.67 ± 0.15b | 0.95 ± 0.09 | 0.33 ± 0.06c | 0.19 ± 0.03 | 0.47 ± 0.12c | 0.65 ± 0.11 |
| 8 weeks | 0.43 ± 0.11 b | 0.71 ± 0.12 | 0.58 ± 0.14a | 1.09 ± 0.19 | 0.28 ± 0. 10 | 0.29 ± 0.15 | 0.51 ± 0.18 | 0.64 ± 0.05 |
significantly different than caudal (p < 0.001)
significantly different than caudal (p < 0.01)
significantly different than caudal (p < 0.05)
MWF (combined values from the cranial and caudal sites) correlated strongly with the average optical density of the EC stain both in vivo (R = 0.63, p = 0.0047, Figure 5a) and ex vivo (R = 0.74, p = 0.0001, Figure 5b). MWF also correlated strongly with the dgen-MBP stain on the cranial side (R = 0.64, p = 0.05 in vivo; R = 0.63, p = 0.038 ex vivo). Both FA and Dlong correlated strongly with the axonal stain (FA: R = 0.47, p = 0.038; Dlong: 0.6, p = 0.005). Surprisingly, there was no correlation between Dtrans and either of the myelin stains (EC or dgen-MBP).
Figure 5.
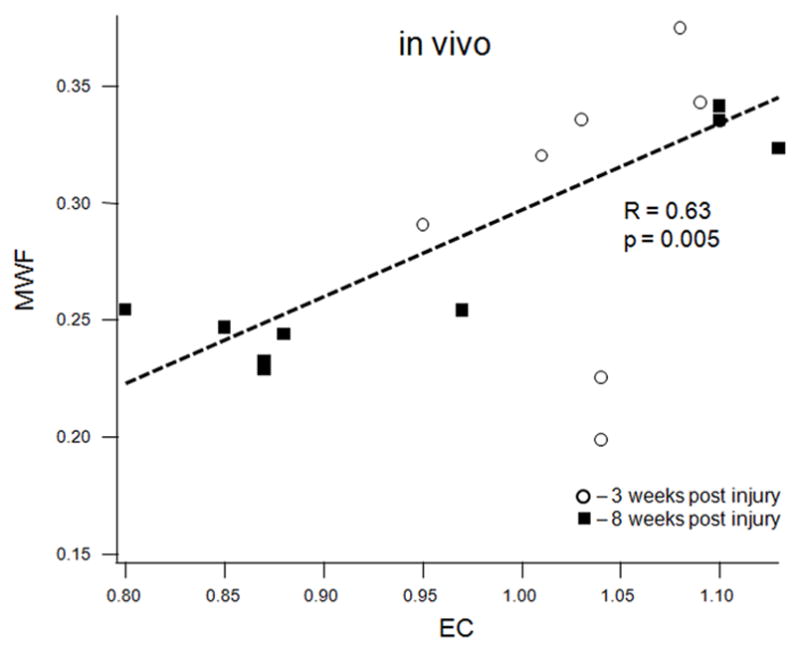
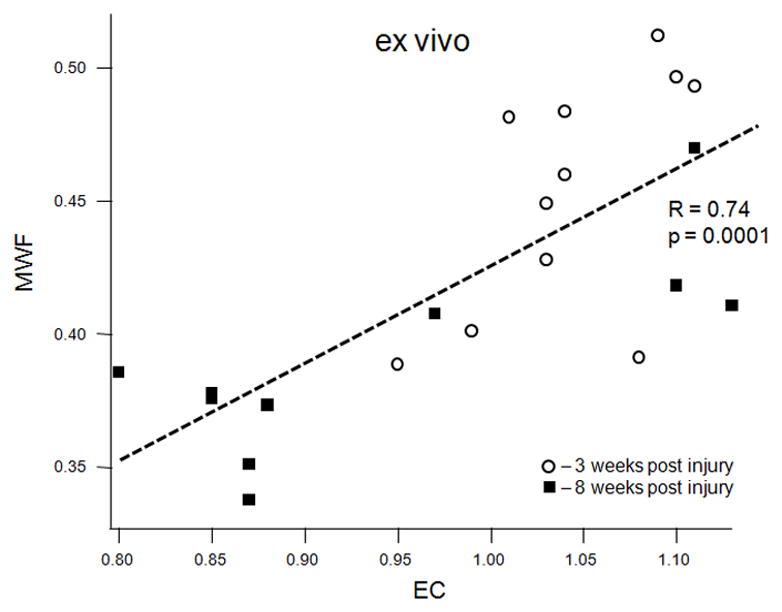
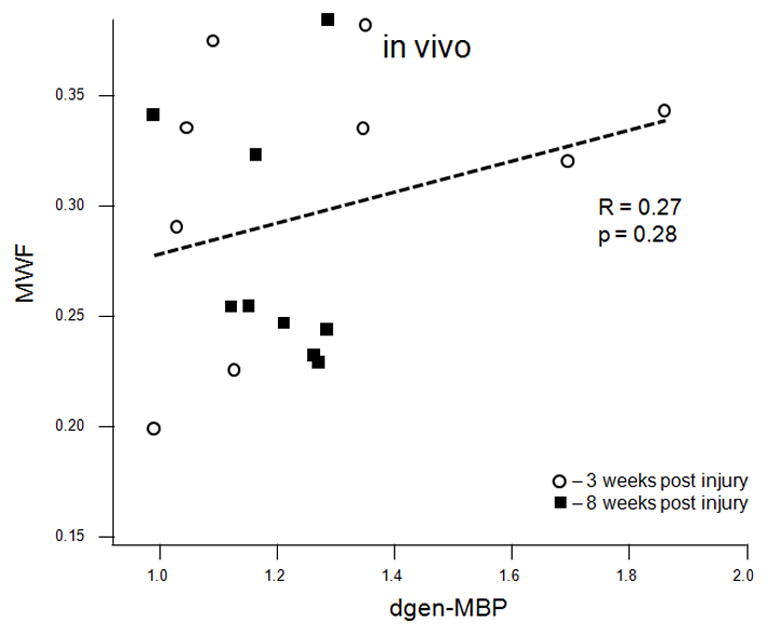
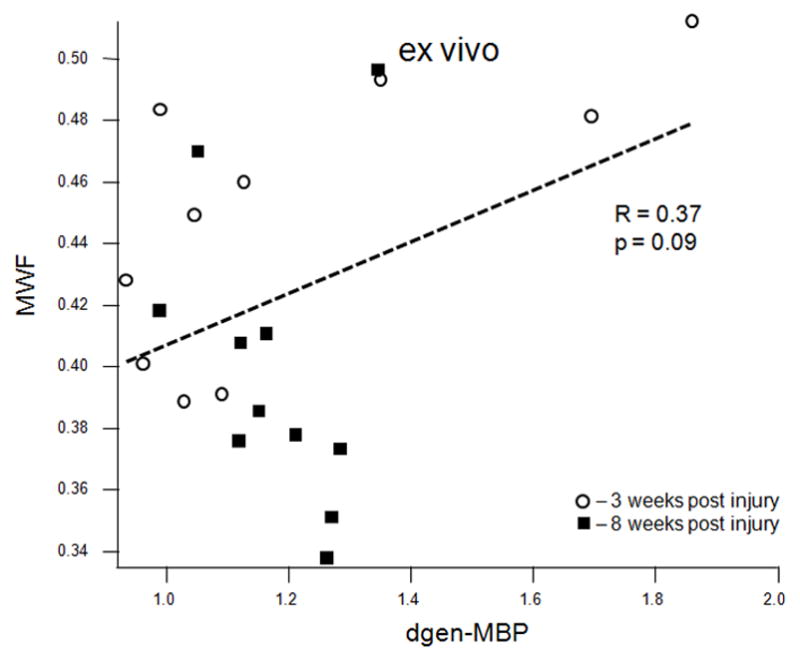
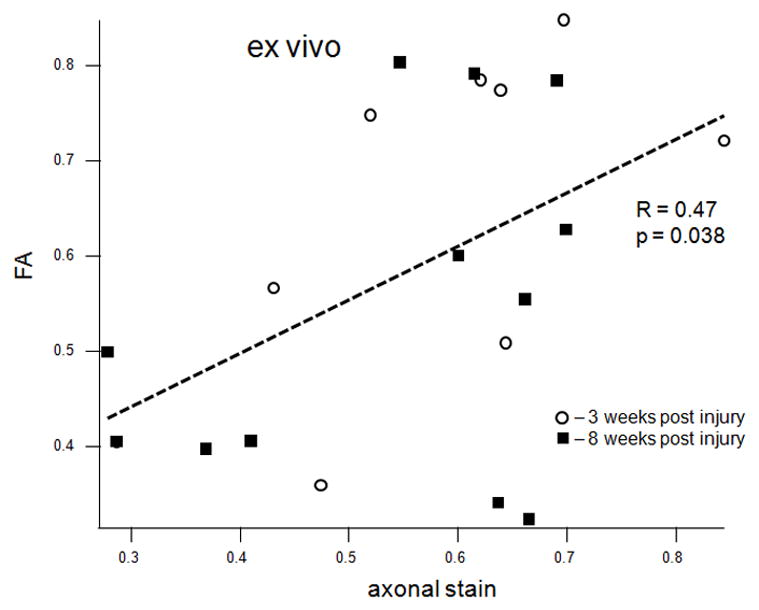
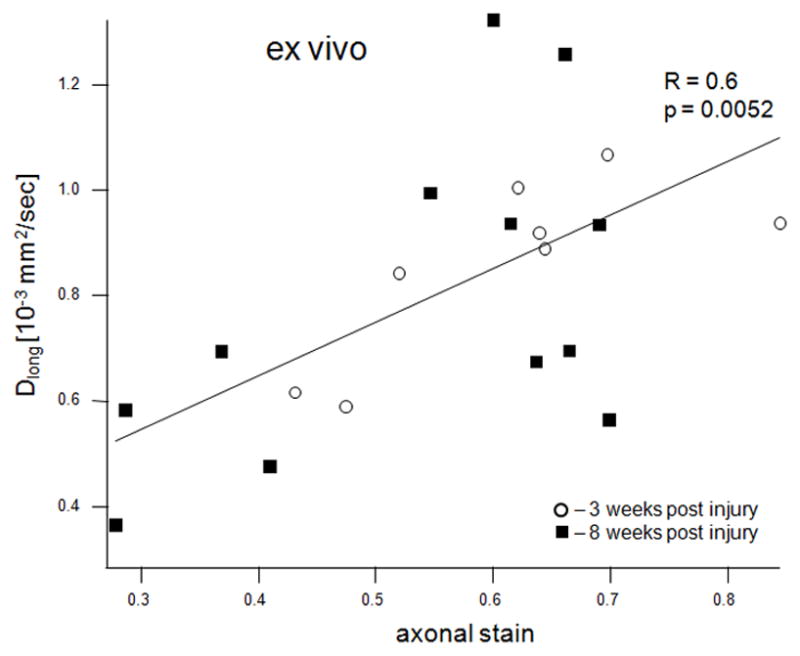
Scatter plots of various MRI parameters vs. normalized optical densities of the histological stains: MWF vs. EC stain for the in vivo (a) and ex vivo (b) data, MWF vs. dgen-MBP stain for the in vivo (c) and ex vivo (d) data, FA vs. axonal stain (e) and Dlong vs. axonal stain (f). The straight lines indicate linear regression fit. Axes on all plots, with the exception of the longitudinal diffusivity (e) are unitless, since the FA and MWF have fractional values, as do the normalized optical densities of all the histological stains. MWF values include measurements include both cranial and caudal sites.
Discussion
Myelin Water Imaging (MWI) has been used extensively in studying the demyelination process in MS patients [11], and it has been shown that MWF correlates well with the amount of myelin measured by histology [10]. However, the application of this technique in rat spinal cord in vivo is challenging due to stringent requirements of very high spatial resolution, SNR and B1 field homogeneity. Thus, very few myelin water imaging studies in rat spinal cord ex vivo [12, 13, 22] or in vivo [12, 23–25] have been reported. In this paper we present the very first, to our knowledge, longitudinal in vivo MWI study in injured rat spinal cord. We used the dorsal column transection (DC Tx) model because of the well defined pattern of the resulting injury, i.e. degeneration of the fasciculus gracilis cranial to injury and degeneration of the cortico-spinal tract (CST) caudal to injury.
MWI was carried out at baseline (2 days prior to injury; one week after coil implantation) and at 3 and 8 weeks post-injury. There was a significant increase in MWF at 3 weeks post injury both cranially and caudally to the injury site. The MWF increase cranially to injury is consistent with our previous ex vivo results [13], which likely reflects the presence of myelin debris as a result of the early Wallerian degeneration, most notably seen in fasciculus gracilis. Although it is not entirely clear why MWF is increased in myelin debris, our preliminary data suggest that it may be related to the increased water space in between myelin sheaths in myelin debris (see more discussion on this issue below). Similarly, the MWF increase caudal to injury is likely due to Wallerian degeneration in CST, with a potential contribution from fasciculus cuneatus and the axonal dieback in the fasciculus gracilis [13]. In addition, there is degeneration of sensory afferents that enter the spinal cord cranial to the injury and bifurcate to send a short descending branch caudally. These degenerating afferents may also contribute to the Wallerian degeneration observed caudally to injury in this study. The increase in MWF at 3 weeks post-injury is consistent with the elevated optical density in the myelin stains, both for functional myelin (EC) and myelin debris (dgen-MBP). At 8 weeks post injury, MWF returned to pre-injury values on the cranial side, but remained elevated on the caudal side. This is likely due to progressive clearance of the myelin debris in the fasciculus gracilis cranially to injury [13], as was confirmed by the significant decrease in the EC stain. The dgen-MBP optical densities also decreased at 8 weeks from the 3 week values; however this difference was not statistically significant (Table 1). Both EC and dgen-MBP remained elevated on the caudal side 8 weeks post-injury. This is most likely due to some prolonged retraction and retrograde degeneration of the sensory ascending fibres caudal to injury.
DTI data were collected only ex vivo due to time limitations of the in vivo experiments, thus no baseline values of the DTI parameters are available. At 3 weeks post-injury both FA and Dlong were significantly lower on the cranial side, as compared to the caudal side, while Dtrans was significantly higher cranially than caudally. On the caudal side, all three parameters showed values similar to those acquired from the normal cords in our previous study [13]. This suggests that at 3 weeks post-injury axonal damage of the ascending fibres dominate on the cranial side of injury, which is confirmed by the axonal stain (Table 2). Dtrans values were higher cranially to injury at 3 weeks post injury. This, according to work by Song at al. [26, 27], may suggest lower myelin content, which is not consistent with the MWF values or the EC and dgen-MBP stains. However, Dtrans may also depend on the axonal count and extra-cellular water fraction [28], which would make the relationship between radial diffusivity and the state of myelin complicated in such a complex biological model. In addition, the increased Dtrans values may result from the presence of edema, however the normal average diffusivity values (Dave = 0.44 ± 0.08 here; data not shown) would suggest that this is not the case. There were no significant differences in either DTI parameters or axonal stain between the 3 and 8 week time points, which is consistent with our previous ex vivo data [13].
MWF values correlated significantly with the EC stain, both in vivo and ex vivo (Figures 5a and 5b). MWF also correlated significantly with the dgen-MBP stain, but only on the cranial side. This is likely because we expect more myelin debris on the cranial side since the ascending sensory tract is larger than the descending CST, particularly in the lumbar cord. Hence the main contribution to myelin debris comes from the sensory ascending fibres (fasciculus gracilis) on the cranial side. This significant correlation is consistent with our previous results showing that the presence of myelin debris will result in the increased MWF values [29]. Although the mechanism for this increase is not entirely clear, our recent preliminary data suggest that there is indeed larger amount of myelin water in myelin debris due to loosening of the myelin sheaths as a result of injury [29]. This also suggests that one needs to be careful interpreting the MWI data in cases when the myelin debris is present. However, both DTI and magnetization transfer (MT) techniques suffer from a similar limitation, as neither of them is able to distinguish between debris and functional myelin [13, 30]. In fact, as shown in this study, EC staining has the same limitation, which is why dgen-MBP stain was used to positively identify myelin debris.
As mentioned above, the current results generally correspond well to our previous ex vivo study of the same injury model in the cervical cord. There are however essential differences between the two studies related to the data acquisition and processing and the model itself. Due to lower SNR of the in vivo T2 data it was not possible to generate high enough quality MWF maps for all animals, thus the MWF values were calculated from the average T2 distributions from selected ROIs. In addition, due to lower spatial resolution than the one achieved ex vivo, and the smaller size of the dorsal column in the lumbar spine, as compared to the cervical cord in the ex vivo study, it was difficult to consistently select ROIs encompassing only individual white matter tracts. Hence the ROIs were selected from the entire dorsal column, leading to potential dilution of the injury effects by including all the dorsal column white matter tracts rather than only the ones expected to show the most damage. In addition, the location of injury (L1 in the current study vs. C5 in the ex vivo study) might have resulted in a different injury pattern, since the calibre of the sensory afferent axons from the legs are larger at L1 than in the cervical spinal cord. In addition, relative contribution of the CST to the dorsal column is relatively smaller at L1 than at C5. The L1 level for the injury site was selected to improve SNR in CPMG data acquired with the implanted coils due to smaller distance between the implanted and the pick-up coils. However, the repetitive measurements of the same animals at baseline, 3 weeks and 8 weeks post-injury in the current study provides a significant advantage over the previous cross-sectional ex vivo study.
There are several limitations of the current study. The above mentioned low SNR and spatial resolution are the two major factors. The inability of generating consistent MWF maps is, however, not only related to lower SNR of the in vivo data. The presence of a blood vessel at the dorsal part of the dorsal column (Figure 2a) also has a significant effect on the T2 data quality, causing severe blood flow artefacts in consecutive echo images. One solution to this problem would be to apply flow compensation mechanism, however at the expense of the increased echo time.
Our MWI technique employs a single slice CPMG sequence; therefore two separate measurements were needed to collect data from both cranial and caudal sides of the injury. This resulted in a relatively long acquisition time and prevented us from collecting DTI data in vivo. We are currently working on a 3D version of our CPMG sequence, thus in future applications acquiring combined MWI and DTI data in vivo should be possible.
Another limitation of this study is a relatively small number of animals, especially in the group scanned at 8 weeks post injury (5 animals). This was caused by losing three animals throughout the study due to health problems, and by poor data quality obtained from one animal. Nevertheless, despite the described shortcomings, our results reached statistical significance.
In conclusion, this work presents the very first, to our knowledge, longitudinal in vivo MWI study in injured rat spinal cord. MWI showed significant changes in myelin content over time post injury and the MWF significantly correlated with histology. Results of this study strongly suggest that MWI can be very useful in studying progression of clinically relevant models of SCI and the effects of potential therapy.
Acknowledgments
The authors would like to thank Mr. Thomas Prasloski for providing the Stimulated Echo correction software and Mr. Joel Bluman for providing phase correction software. This work has been supported by the Canadian Institutes of Health Research (MOP #89882) and the Natural Sciences and Engineering Research Council of Canada (RGPIN #327525-07). PR acknowledges support from EU FP7 program PIRSES-GA-2008-230863 (EuroCanMRI). WT holds the Rick Hansen Man in Motion Chair in Spinal Cord Injury Research.
Footnotes
Part of this work has been presented at the 20th Annual Meeting of the International Society for Magnetic Resonance in Medicine, abstract #619.
References
- 1.Blight AR. Cellular morphology of chronic spinal cord injury in the cat: analysis of myelinated axons by line-sampling. Neuroscience. 1983;10:521–543. doi: 10.1016/0306-4522(83)90150-1. [DOI] [PubMed] [Google Scholar]
- 2.Blight AR. Delayed demyelination and macrophage invasion: a candidate for secondary cell damage in spinal cord injury. Cent Nerv Syst Trauma. 1985;2:299–315. doi: 10.1089/cns.1985.2.299. [DOI] [PubMed] [Google Scholar]
- 3.Webster HP. Myelin injury and repair. Adv Neurol. 1993;59:67–73. [PubMed] [Google Scholar]
- 4.Salgado-Ceballos H, Guizar-Sahagun G, Feria-Velasco A, Grijalve I, Espitia L, Ibarra A, Madrazo I. Spontaneus long-term remyelination after traumatic spinal cord injury in rats. Brain Res. 1998;782:126–135. doi: 10.1016/s0006-8993(97)01252-3. [DOI] [PubMed] [Google Scholar]
- 5.Kocsis JD. Restoration of function by glial cell transplantation into demyelinated spinal cord. J Neurotrauma. 1999;16:695–703. doi: 10.1089/neu.1999.16.695. [DOI] [PubMed] [Google Scholar]
- 6.Kocsis JD, Akiyama Y, Lankford KL, Radtke C. Cell transplantation of peripheral-myelin-forming cells to repair the injured spinal cord. J Rehabil Res Dev. 2002;39:287–298. [PubMed] [Google Scholar]
- 7.Biernaskie J, Sparling JS, Liu J, Shannon CP, Plemel JR, Xie Y, Miller FD, Tetzlaff W. Skin-derived precursors generate myelinating Schwann cells that promote remyelination and functional recovery after contusion spinal cord injury. J Neurosci. 2007;27:9545–9559. doi: 10.1523/JNEUROSCI.1930-07.2007. [DOI] [PMC free article] [PubMed] [Google Scholar]
- 8.Henkelman RM, Stanisz GJ, Graham SJ. Magnetization transfer in MRI: a review. NMR Biomed. 2001;14:57–64. doi: 10.1002/nbm.683. [DOI] [PubMed] [Google Scholar]
- 9.Whittall KP, MacKay AL. Quantitative interpretation of NMR relaxation data. J Magn Reson. 1989;84:134–152. [Google Scholar]
- 10.Laule C, Leung E, Lis DK, Traboulsee AL, Paty DW, MacKay AL, Moore GR. Myelin water imaging in multiple sclerosis: quantitative correlations with histopathology. Mult Scler. 2006;12:747–753. doi: 10.1177/1352458506070928. [DOI] [PubMed] [Google Scholar]
- 11.Laule C, Vavasour IM, Moore GR, Oger J, Li DK, Paty DW, MacKay AL. Water content and myelin water fraction in multiple sclerosis. A T2 relaxation study. J Neurol. 2004;251:284–293. doi: 10.1007/s00415-004-0306-6. [DOI] [PubMed] [Google Scholar]
- 12.Kozlowski P, Liu J, Yung AC, Tetzlaff W. High-resolution myelin water measurements in rat spinal cord. Magn Reson Med. 2008;59:796–802. doi: 10.1002/mrm.21527. [DOI] [PubMed] [Google Scholar]
- 13.Kozlowski P, Raj D, Liu J, Lam C, Yung AC, Tetzlaff W. Characterizing white matter damage in rat spinal cord with quantitative MRI and histology. J Neurotrauma. 2008;25:653–676. doi: 10.1089/neu.2007.0462. [DOI] [PubMed] [Google Scholar]
- 14.Yung AC, Assinck P, Wu L, Tetzlaff W, Kozlowski P. Ex vivo myelin water and DTI measurements of SKP-SC transplanted cell therapy in contused rat spinal cord: correlation with histology. Proceedings of 19th Meeting of ISMRM; Montreal. 2011; p. 2459. [Google Scholar]
- 15.Yung AC, Kozlowski P. Signal-to-noise ratio comparison of phased-array vs. implantable coil for rat spinal cord MRI. Magn Reson Imaging. 2007;25:1215–1221. doi: 10.1016/j.mri.2007.01.006. [DOI] [PubMed] [Google Scholar]
- 16.Poon CS, Henkelman RM. Practical T2 quantitation for clinical applications. J Magn Reson Imaging. 1992;2:541–553. doi: 10.1002/jmri.1880020512. [DOI] [PubMed] [Google Scholar]
- 17.Madi S, Hasan KM, Narayana PA. Diffusion tensor imaging of in vivo and excised rat spinal cord at 7 T with an icosahedral encoding scheme. Magn Reson Med. 2005;53:118–125. doi: 10.1002/mrm.20304. [DOI] [PubMed] [Google Scholar]
- 18.Bjarnason TA, Laule C, Bluman J, Kozlowski P. Temporal phase correction of multi echo T2 Magnetic Resonance images. J Magn Reson. 2013;231:22–31. doi: 10.1016/j.jmr.2013.02.019. [DOI] [PMC free article] [PubMed] [Google Scholar]
- 19.Prasloski T, Mädler B, Xiang QS, MacKay A, Jones C. Applications of stimulated echo correction to multicomponent T2 analysis. Magn Reson Med. 2012;67:1803–1814. doi: 10.1002/mrm.23157. [DOI] [PubMed] [Google Scholar]
- 20.Whittall KP, MacKay AL, Graeb DA, Nugent RA, Li DK, Paty DW. In vivo measurement of T2 distributions and water contents in normal human brain. Magn Reson Med. 1997;37:34–43. doi: 10.1002/mrm.1910370107. [DOI] [PubMed] [Google Scholar]
- 21.Golub GH, Heath M, Wahba G. Generalized cross-validation as a method for choosing a good ridge parameter. Technometrics. 1979;21:215–223. [Google Scholar]
- 22.Dula AN, Gochberg DF, Valentine HL, Valentine WM, Does MD. Multiexponential T2, magnetization transfer, and quantitative histology in white matter tracts of rat spinal cord. Magn Reson Med. 2010;63:902–909. doi: 10.1002/mrm.22267. [DOI] [PMC free article] [PubMed] [Google Scholar]
- 23.Kozlowski P, Yung AC, Chen SH, Liu J, Tetzlaff W. In vivo myelin water imaging in rat spinal cord. Proceedings of 19th Meeting of ISMRM; Montreal. 2011; p. 2458. [Google Scholar]
- 24.Harkins KD, Valentine WM, Gochberg DF, Does MD. Microanatomical correlates of multi-exponential T2 & quantitative MT in pathological rat spinal white matter. Proceedings of 19th Meeting of ISMRM; Montreal. 2011; p. 2261. [Google Scholar]
- 25.Harkins KD, Dula AN, Does MD. Effect of intercompartmental water exchange on the apparent myelin water fraction in multiexponential T2 measurements of rat spinal cord. Magn Reson Med. 2012;67:793–800. doi: 10.1002/mrm.23053. [DOI] [PMC free article] [PubMed] [Google Scholar]
- 26.Song SK, Sun SW, Ramsbottom MJ, Chang C, Russell J, Cross AH. Dysmyelination revealed through MRI as increased radial (but unchanged axial) diffusion of water. Neuroimage. 2002;17:1429–36. doi: 10.1006/nimg.2002.1267. [DOI] [PubMed] [Google Scholar]
- 27.Song SK, Yoshino J, Le TQ, Lin SJ, Sun SW, Cross AH, Armstrong RC. Demyelination increases radial diffusivity in corpus callosum of mouse brain. Neuroimage. 2005;26:132–140. doi: 10.1016/j.neuroimage.2005.01.028. [DOI] [PubMed] [Google Scholar]
- 28.Schwartz ED, Cooper ET, Fan Y, Jawad AF, Chin CL, Nissanov J, Hackney DB. MRI diffusion coefficients in spinal cord correlate with axon morphometry. Neuroreport. 2005;16:73–76. doi: 10.1097/00001756-200501190-00017. [DOI] [PubMed] [Google Scholar]
- 29.Chen HS, Holmes N, Liu J, Tetzlaff W, Kozlowski P. Myelin Water Measurements in the Presence of Myelin Debris. Proceedings of 19th Meeting of ISMRM; Montreal. 2011; p. 405. [Google Scholar]
- 30.McCreary CR, Bjarnason TA, Skihar V, Mitchell JR, Yong VW, Dunn JF. Multiexponential T2 and magnetization transfer MRI of demyelination and remyelination in murine spinal cord. Neuroimage. 2009;45:1173–1182. doi: 10.1016/j.neuroimage.2008.12.071. [DOI] [PMC free article] [PubMed] [Google Scholar]


