Abstract
Purpose
To develop and evaluate an image‐domain noise reduction method for multi‐energy CT (MECT) data.
Methods
Multi‐Energy Non‐Local Means (MENLM) is a technique that uses the redundant information in MECT images to achieve noise reduction. In this method, spatio‐spectral features are used to determine the similarity between pixels, making the similarity evaluation more robust to image noise. The performance of this MENLM filter was tested on images acquired on a whole‐body research photon counting CT system. The impact of filtering on image quality was quantitatively evaluated in phantom studies in terms of image noise level (standard deviation of pixel values), noise power spectrum (NPS), in‐plane and cross‐plane spatial resolution, CT number accuracy, material decomposition performance, and subjective low‐contrast spatial resolution using the American College of Radiology (ACR) CT accreditation phantom. Clinical feasibility was assessed by performing MENLM on contrast‐enhanced swine images and unenhanced cadaver head images using clinically relevant doses and dose rates.
Results
The phantom studies demonstrated that the MENLM filter reduced noise substantially and still preserved the shape and peak frequency of the NPS. With 80% noise reduction, MENLM filtering caused no degradation of high‐contrast spatial resolution, as illustrated by the modulation transfer function (MTF) and slice sensitivity profile (SSP). CT number accuracy was also maintained for all energy channels, demonstrating that energy resolution was not affected by filtering. Material decomposition performance was improved with MENLM filtering. The subjective evaluation using the ACR phantom demonstrated an improvement in low‐contrast performance. MENLM achieved effective noise reduction in both contrast‐enhanced swine images and unenhanced cadaver head images, resulting in improved detection of subtle vascular structures and the differentiation of white/gray matter.
Conclusion
In MECT, MENLM achieved around 80% noise reduction and greatly improved material decomposition performance and the detection of subtle anatomical/low‐contrast features while maintaining spatial and energy resolution. MENLM filtering may improve diagnostic or functional analysis accuracy and facilitate radiation dose and contrast media reduction for MECT.
Keywords: CT dose reduction, image denoising, multi‐energy CT , non‐local means filtering, photon counting CT
1. Introduction
Recent developments in multi‐energy CT (MECT) have brought new functionality to X‐ray CT.1 Dual‐energy CT has demonstrated its value in novel clinical applications, such as iodine quantification,2, 3 monochromatic imaging,4, 5 bone removal,6, 7 kidney stone characterization,8, 9 and gout imaging.10, 11, 12 Photon counting detector‐based CT (PCCT) may further benefit clinical CT by offering improved energy resolution,13, 14, 15 higher dose efficiency,16 and better signal‐to‐noise ratio (SNR) properties.17, 18, 19, 20
Various algorithms have been proposed to effectively control image noise for MECT to improve image quality and/or quantitative accuracy.18, 21, 22, 23, 24, 25, 26, 27, 28 Since MECT images acquired at different energies are usually perfectly registered in the image domain, pixels at the same spatial coordinates represent exactly the same object and are associated with same structures, albeit with different contrast levels. Hence, one may exploit the exploiting data redundancies in the energy domain to achieve noise reduction. Leng et al. proposed an energy‐domain filtration method that used a composite image with much lower noise to effectively reduce noise in energy bin‐based images to that of the composite image.21 The same concept has also been applied in other noise reduction algorithms, it can occur in either image‐domain or projection‐domain, or as iterative approaches.25, 26, 29 In addition to exploiting features in the energy domain between the original MECT images, noise reduction was also performed on secondary images generated from distinct multi‐energy measurements. Kalender et al. developed a method utilizing noise correlations in material‐specific images to reduce noise.23 Schmidt presented a method to maximize the CNR of a mixed image by blending images from separate energy bin‐based images.18 Recently, noise reduction for MECT was also performed together with quantitative basis material decomposition by iterative methods with smoothness regularization of basis material density.24, 27, 28, 30
In this work, we propose a different approach to exploiting the intrinsic redundant information in MECT images by searching for similar spatio‐spectral features to reduce image noise while preserving spatial and energy resolution. The algorithm works on reconstructed images directly to achieve fast noise reduction. The filtered images not only improve the detection of relevant anatomical information, but also reduce the noise magnification that occurs in the post‐processing steps.
The proposed method is based on a state‐of‐the‐art edge‐preserving noise reduction algorithm, non‐local means (NLM).31 NLM searches for similar pixels in the original image and then performs a weighted average of such pixels to achieve noise reduction. The similarity between the pixel to be filtered and all other pixels is quantitatively determined by the summed square difference (SSD) between the features associated with the pixels. Pixels with lower SSD yield higher similarity and hence receive higher weight for averaging.
The accurate evaluation of similarity between pixels has a huge impact on the noise reduction performance. Hence, the optimal feature definition should consider carefully the characteristics of the images to be filtered. In conventional NLM algorithms, 2D spatial patches are used as features to search for the similarity.31 For 3D data such as volumetric CT images, spatial features can be extended to 3D blocks to calculate similarity.32
The similarity measurement should not be limited to spatial features alone, especially for high‐dimensional images. In time‐resolved CT images, for example, we found that the partial temporal profile of a pixel can be used to effectively utilize redundant information in both spatial and temporal domains, and is robust to patient motion.33 Similarly, it is expected that incorporation of the energy and spatial characteristics of MECT images across 3D spatial domain and multiple energy channels may allow one to achieve optimal noise reduction.
In this work, we describe the fundamental principles of our approach, evaluate the effect of filtering parameters on noise and resolution, and demonstrate its effectiveness by quantitatively evaluating spatial and energy resolution using phantom experiments, and qualitatively using data acquired in living animal and cadaver head scans.
2. Methods
2.A. Multi‐energy non‐local means (MENLM) method
Our algorithm is based on the following observations. First, the pixel values (or CT numbers) in CT images measure the effective linear attenuation coefficient (LAC) of a type of material for a given incident X‐ray spectrum and are a function of the material's effective atomic number and density. In conventional CT, a material's LAC is only evaluated at a single energy spectrum. Therefore, materials with different compositions and densities can have similar LAC values at certain X‐ray energy spectrum. However, in MECT, LAC measurements can be acquired at two or more different energy spectra to build an energy profile (or spectral features) for each pixel.
The energy profile can be exploited for noise reduction. To help explain this algorithm, consider a set of 2D MECT images acquired at four different X‐ray energies that are stacked together to form a 3D volume [Fig. 1(a)]. Each block in a plane represents a pixel evaluated at certain spatial location and X‐ray energy. The 4 pixels values associated with the same spatial location form an energy profile (curves in Figs. 1(b) and 1(c)). Although different materials can have similar LAC values at a certain energy (e.g., calcium and iodine in energy channels E2 and E3, Fig. 1(b)), they can be distinguished by their distinct energy profiles, which allows material differentiation and also pixel similarity evaluation. The same principle also can be applied to separate a given material with different densities because the differences in material densities yield differences in LACs in measurements at all X‐ray energies [Fig. 1(c)]. Hence, a small difference in density between two pixels can yield a large difference in the SSD between the two energy profiles, which can be beneficial for preserving features with small variations in intensity (or low contrast).
Figure 1.

MENLM exploits energy profiles to benefit similarity calculations between different pixels. (a). An illustration of MECT images, (b). Pixels with different material compositions and densities may have similar LACs in an energy channel (e.g., calcium and Iodine in E2 and E3). However, the different LAC values in other energy channels yield distinct energy profiles. (c). Pixels with the same material composition (blue blocks in sub‐figure (a)) but different densities can still be differentiated because density differences also lead to different energy profiles in all energy channels.
In addition, because the pixels at distinct energy channels are perfectly registered in the image domain, we can incorporate the spatial features together with the spectral features to improve the robustness of similarity calculations. As illustrated in Fig. 2, MENLM extracts the spatial feature associated with each pixel (e.g., 3 × 3 patches in plane) and stacks the 2D patch at different energies to form a 3D block. The pixel similarity is evaluated by calculating the SSDs between different blocks associated with the center pixels. In MECT, edges, such as subtle anatomical structures, may not be well defined due to high image noise. Our approach utilizes the core concept of conventional NLM algorithms, which exploit spatial features to achieve noise reduction and preserve edges, but enhances this with the use of spectral features.31
Figure 2.
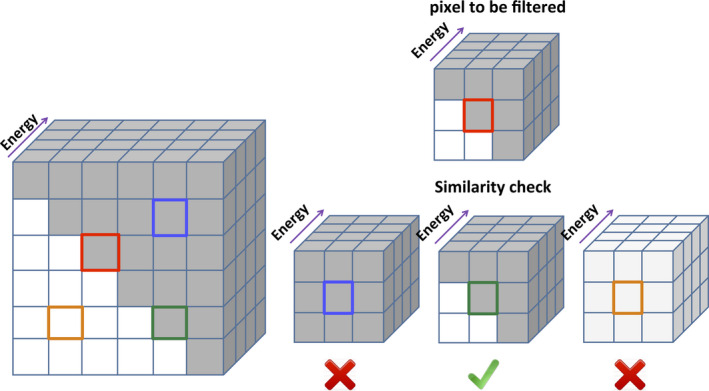
MENLM also exploits spatial features to reduce noise and preserve edges. Different spatial features (e.g., 3 × 3 patches in the spatial domain) can be incorporated together with energy profiles in the similarity calculation, making the similarity evaluation robust to image noise. When filtering a pixel (red) on an edge, the spatial features helps to detect similar edge pixels (e.g., green) and exclude unlike ones (e.g., blue and orange).
Finally, the difference in image noise levels in distinct energy channels should also be considered to correctly evaluate the similarity between pixels. Energy channels associated with higher noise should be weighted less for the similarity calculation, and vice versa.
In this study, we focus on the noise reduction of 4D MECT data (3D in space and 1D in energy). The algorithm can be described by the following equation:
| (1) |
where I’(i 0 ,e 0 ) is the filtered pixel value at spatial coordinate i 0 measured in energy channel e 0 , I (i,e 0 ) are the pixel intensities in the original images measured in the same energy channel, is the search window in the spatial domain, which is usually a 3D block with equal dimension in all three dimensions in space so that it contains pixels. is the spatial offset of the evaluated pixel in the spatial feature P, which is usually a 3D block with equal dimension in all three dimensions in space so that it contains pixels. E is the length of the energy profile used for the similarity evaluation. Hence, the contribution of each pixel I at energy e 0 to filtering is determined by calculating the mean square difference between two 4D blocks (3D spatial + 1D energy) centered at the spatial location of i 0 and i. represents the image noise variance in the energy channel e and was manually determined by ROI measurements in a homogenous region in the original images.
In this way, the similarity was determined using multi‐energy measurements, but the averaging was only performed in distinct energy channels to avoid possible signal leakage across different energy channels. The exponential function in the formula is used to scale the weight within the range [0, 1]. Finally, a weighted average of all pixels in the spatial search window yields the filtered pixel value. h is a parameter used to control the amount of noise reduction. Hence, the four filtering parameters are as follows: search window size in space , spatial block size , energy channels used to evaluate pixel similarity , and filtering strength h.
2.B. Image quality evaluation of the MENLM method
To assess the impact of filtering on image quality, the proposed MENLM filter was applied to MECT images acquired using a research whole‐body PCCT scanner (Siemens Healthcare, Forchheim, Germany).34, 35 The data were acquired using “chess mode,” where data from all 16 sub‐pixels of the detector were combined to simultaneously generate four threshold‐based images by counting photons above different energy thresholds. Three additional bin‐based images were derived by subtracting the photon counts between adjacent thresholds. In the proposed method, only the four threshold‐based images associated were used for the calculation of pixel similarity (and weight), as they represent the original measurements and have lower noise than the bin‐based images. Because the pixels at different energy channels are perfectly registered in space and represent the same material, the weight determined from threshold‐based data was applied to filter the noisy bin‐based images. We used universal parameter settings for all tests except for the filtering strength h, that is, . In the following sections, we evaluate the effect of h on image noise and spatial resolution. From these results, we then determine the filtering strength h that is used for the remaining tests.
2.B.1. Evaluation of MENLM using phantom studies
We performed a series of phantom studies to quantitatively evaluate the influence of MENLM filtering on image quality in terms of image noise level (quantified by the standard deviation of CT number in a uniform region), noise power spectrum (NPS), in‐plane and cross‐plane spatial resolution, energy profile accuracy, and low‐contrast resolution.
The image noise and NPS were measured using a 20 cm diameter cylindrical phantom filled with water. The acquisition and reconstruction parameters are found in Table 1. To test the noise reduction capabilities of the proposed algorithm, the phantom was scanned at two dose levels. Images were reconstructed with a quantitative, medium smooth kernel (D30). The low‐dose (25.1 mGy) images were denoised using the MENLM filter with the strength setting h varying from 0.7 to 1.5. A procedure following the general framework described previously was used to calculate a 2D NPS for the three image set: high dose, low dose, low dose with MENLM denoising.36 A circular average of the 2D NPS was taken to yield a 1D NPS profile. To suppress the estimation variations, a number of overlapped ROIs were used to smooth the NPS curves.37
Table 1.
Acquisition and reconstruction parameters used to scan the phantoms
| Exam | Noise & NPS | MTF | SSP | CT # Accuracy | ACR | Pig | Cadaver head |
|---|---|---|---|---|---|---|---|
| Parameters | |||||||
| Detector Collimation, mm | 32 × 0.5 | ||||||
| Tube potential, kV | 140 | ||||||
| Energy thresholds, keV | [25, 45, 65, 85] | [20, 50, 63, 83] | |||||
| Tube current, mA | 400/100 | 80 | 140 | 140 | 400 | 540 | 220 |
| Rotation time, s | 1.0 | 0.5 | 0.5 | 1.0 | 0.5 | 0.5 | 1.0 |
| Acquisition FOV, mm | 275 | ||||||
| Scan mode | Head | ||||||
| Pitch | N/Aa | 0.5 | 0.5 | N/Aa | 0.6 | 0.6 | 0.6 |
| CTDIvol, mGy | 101.1/25.1 | 10.1 | 17.7 | 35.5 | 50.5 | 68.4 | 55.5 |
| Image thickness, mm | 2.0 | 1.0 | 0.5 | 2.0 | 5.0 | 3.0 | 1.0 |
| Image interval, mm | 0.8 | 1.0 | 0.1 | 0.8 | 1.0 | 2.0 | 1.0 |
| Reconstruction kernel | D30 | D40 | |||||
| Reconstruction FOV, mm | 200 | 50 | 50 | 200 | 200 | 275 | 275 |
N/A refers to sequential scan.
The in‐plane spatial resolution was evaluated using the modulation transfer function (MTF) measured using a 0.125 mm diameter tantalum wire. The acquisition and reconstruction parameters are found in Table 1. Reconstructed images were also denoised using the MENLM filter, with filtering strength h set to achieve 30–80% noise reductions. The MTF for both original and filtered images was calculated using a previously described method.38
The cross‐plane spatial resolution was evaluated using the slice sensitivity profile (SSP), which was measured using a thin gold foil phantom (25 μm thickness) that was embedded inside a tissue‐equivalent plastic cylinder with a diameter of 23 mm (QRM, Moehrendorf, Germany). The acquisition and reconstruction parameters are found in Table 1. Reconstructed images were also denoised using the MENLM filter, with filtering strength h set to achieve 80% noise reduction. For each image, the maximum CT number within a region of interest (ROI) centered over the gold foil was recorded after background subtraction. The SSP was plotted as the normalized CT number as a function of slice location.
The impact of filtering strength h on CT number accuracy was evaluated using scans of CaCl2 and iodinated‐contrast‐material water solutions, and their mixtures, in a 20 cm semi‐anthropomorphic water tank (referred to as calcium and iodine solution phantom). The acquisition and reconstruction parameters are found in Table 1. Images were denoised using the MENLM filter, again with filtering strength h set to achieve 80% noise reduction. ROIs were drawn on each material sample to measure CT numbers in both threshold‐ and bin‐based images. An in‐house developed calibration‐based image‐domain material decomposition method was applied to access the impact of MENLM filtering on material decomposition peformance.15 The material decomposition performed was assessed by the appearance of basis material density maps and the root mean square error (RMSE) calculated based on the known truth of basis material density values.
The low‐contrast resolution was evaluated subjectively using the low‐contrast resolution module of the American College of Radiology (ACR) CT accreditation phantom. The acquisition and reconstruction parameters are found in Table 1. The MENLM filter was applied on the reconstructed images with the filtering strength h set to achieve 80% noise reduction.
2.B.2. Clinical feasibility testing
Pig scan
After institutional animal care and use committee approval, one 3‐month‐old female swine was scanned using a head CT scan protocol. The acquisition and reconstruction parameters are found in Table 1. Images were denoised using the MENLM filter, with filtering strength h set to achieve 80% noise reduction; the results were compared with the Filtered Back Projection (FBP) images.
Cadaver head scan
With approval of our institutional biospecimen committee, a fresh‐frozen human cadaver head was obtained from our institution's department of anatomy. The acquisition and reconstruction parameters are found in Table 1. Images were reconstructed using a D40 kernel and were denoised using the MENLM filter, with filtering strength h set to achieve 80% noise reduction; the results were compared with the Filtered Back Projection (FBP) images.
3. Results
3.A. Evaluation of MENLM using phantom studies
3.A.1. Image noise level and filtering strength h
By varying the filtering strength h, the amount of noise reduction was determined for all threshold‐ and bin‐based images (Table 2).
Table 2.
Evaluation of filtering strength h on the amount of noise reduction, where noise reduction was averaged for all threshold‐ and bin‐based images
| Filtering Strength (h) | 0.7 | 0.8 | 0.9 | 1.0 | 1.2 | 1.5 |
| Noise Reduction (%) | 36.9 ± 7.7 | 45.9 ± 7.8 | 53.8 ± 7.3 | 60.6 ± 6.5 | 70.4 ± 5.1 | 80.1 ± 3.1 |
3.A.2. Noise power spectrum
Figure 3 shows that the NPS of the MENLM‐filtered (h = 0.9) low‐dose FBP images generally had similar shapes and magnitudes as those of the high‐dose FBP images, but with a noticeable shift of the peak frequency toward lower frequencies. Similar behaviors were observed for all threshold‐ and bin‐based images, except for the threshold‐ and bin‐based images associated with the lowest energy thresholds (e.g., [20,140 keV] and [25,45 keV]). The peak frequency tended to shift more toward the lower frequency end with increased filtering strength (Fig. 4).
Figure 3.
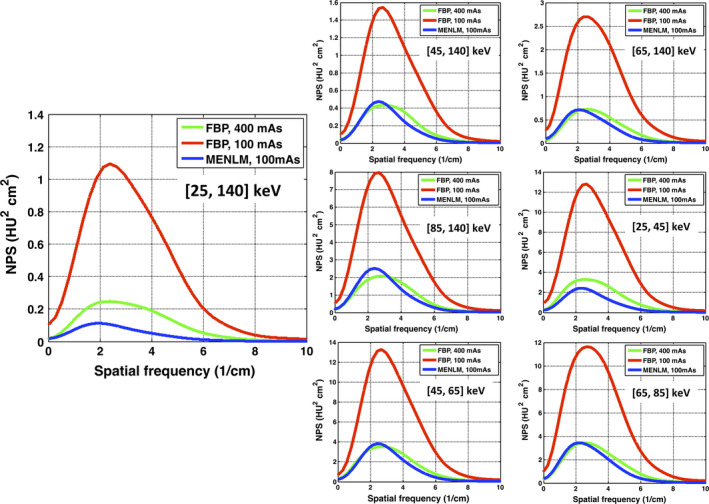
Comparison of NPSs between the FBP images and MENLM‐filtered images with 50% noise reduction.
Figure 4.
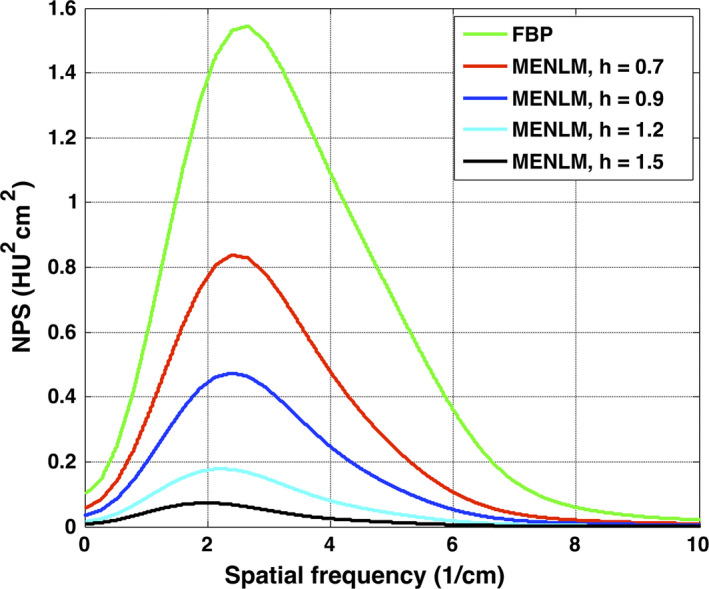
Dependence of NPS on filtering strength for threshold‐based images [45,140 keV].
3.A.3. High‐contrast spatial resolution
The MTF curves of the images reconstructed with the FBP reconstruction algorithm and MENLM with different filtering strengths h are shown in Fig. 5 for the threshold‐based image with the lowest energy threshold. The MTF was essentially unchanged with up to 80% noise reduction (h = 1.5) although slight changes were observed in some images with higher noise reduction (data not shown). The same behavior was observed for all other energy threshold‐based and bin‐based images (Fig. 6). Hence, in the following experiments, we adopted a filtering strength of h = 1.5 to evaluate the image quality after filtering.
Figure 5.
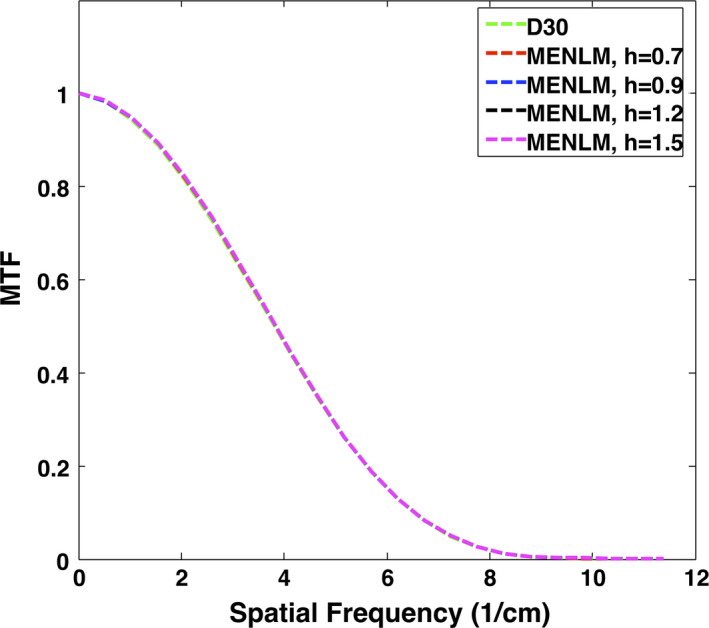
Dependence of in‐plane spatial resolution on filtering strength for Threshold 1 images [25,140 keV]. [Color figure can be viewed at wileyonlinelibrary.com]
Figure 6.
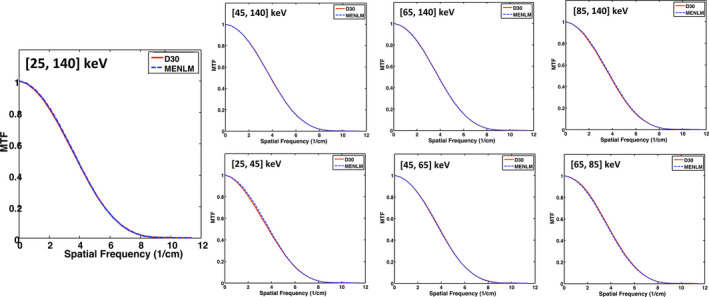
Comparison of changes in in‐plane spatial resolution between the FBP image (D30) and MENLM with 80% noise reduction for all threshold‐ and bin‐based images. [Color figure can be viewed at wileyonlinelibrary.com]
The SSPs for both FBP and filtered images are shown in Fig. 7. The SSPs before and after the MENLM filtering did not change, demonstrating that cross‐plane spatial resolution was not affected by the filter with 80% noise reduction.
Figure 7.
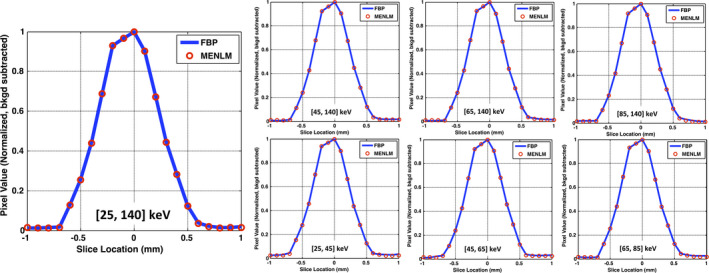
Comparison of changes in cross‐plane spatial resolution between the FBP image and MENLM with 80% noise reduction. [Color figure can be viewed at wileyonlinelibrary.com]
3.A.4. CT # accuracy
Figure 8 shows the FBP image of the calcium and iodine water solution phantom and the MENLM filtered image. ROI measurements of all samples demonstrated that the CT number accuracy was well preserved in all threshold‐ and bin‐based images, with maximum differences of only 2.3 HU (Table 3). This demonstrated that energy resolution was preserved in the MENLM filtered images.
Figure 8.

Illustration of the calcium and iodine solution phantom used for the CT number accuracy evaluation. Left: Original FBP image of (85, 140) keV (W/L = 400/40); Middle: MENLM image (W/L = 400/40); Right: Difference image between FBP and MENLM images (W/L = 15/0 HU). The mean and standard deviation of CT numbers inside the dotted ROI were −0.3 ± 19.2 and −0.4 ± 4.1 HU for the FBP and MENLM images, respectively. No obvious structures were observed in the difference image. The mean and standard deviation of the CT number in the solid circle ROI was 0.2 ± 15.8 HU, demonstrating no signal bias in the calcium and iodine solutions.
Table 3.
Evaluation of CT number change with 80% noise reduction for all threshold‐based and bin‐based images
| Energy Range (keV) | [25, 140] | [45, 140] | [65, 140] | [85, 140] | [25, 45] | [45, 65] | [65, 85] |
|---|---|---|---|---|---|---|---|
| CT # Change (HU) | |||||||
| Sample 1 | 0.1 | −0.1 | 0.5 | 1.8 | 0.7 | 0.6 | −1.2 |
| Sample 2 | 0.7 | 1.2 | 0.2 | 0.9 | 1.9 | −1.7 | 1.8 |
| Sample 3 | 0.6 | 1.9 | 0.9 | 1.2 | 2.3 | −1.6 | 2.4 |
| Sample 4 | 0.6 | 0.8 | 0.5 | 2.0 | 1.9 | 0.1 | −0.2 |
| Sample 5 | 0.7 | 1.2 | 1.0 | 1.6 | 1.9 | 0.6 | 1.4 |
| Sample 6 | 0.7 | −0.1 | 0.5 | 0.6 | 2.0 | 0.7 | −0.5 |
| Sample 7 | 0.6 | 1.2 | 0.7 | −0.3 | 1.3 | 0.5 | 1.9 |
| Sample 8 | 0.0 | 0.3 | 0.8 | 2.3 | −1.0 | 1.2 | −1.0 |
| Mean | 0.5 | 0.8 | 0.6 | 1.3 | 1.4 | 0.1 | 0.6 |
Figure 9 shows that material decomposition results were improved greatly with MENLM filtering. In the material density maps (columns 2–4, bottom row), basis material signals were much easier to detect and the edges were more well defined compared to the material decomposition results based on the raw PCCT images (top row). With noise reduction, the RMSE for calcium, iodine, and water density estimation were 7.2%, 8.0%, and 0.4%, respectively, which were much smaller than the errors from the unfiltered PCCT images (33.8%, 34.8%, and 0.5%, respectively).
Figure 9.
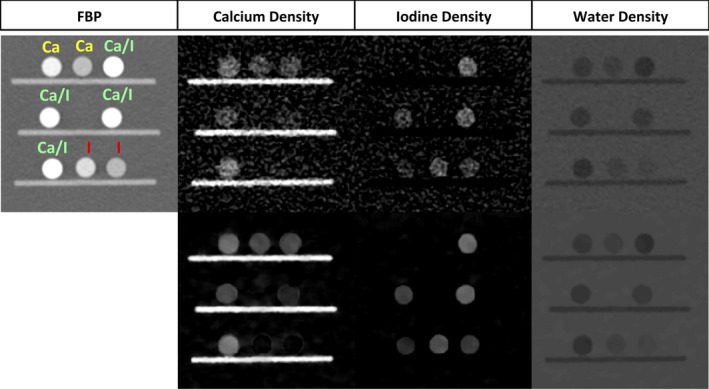
The filtered back projection image (FBP) from one energy threshold (25, 140) keV is shown in the left most column. Both calcium (Ca) and iodine (I) were in solution with water. Ca/I stands for vials that included a mixture of calcium, iodine, and water. Material‐specific images (density maps) calculated using material decomposition are shown before (top row) and after MENLM filtering (bottom row). The MENLM algorithm greatly improves the ability to visualize the respective materials and better delineates the edges of the vials containing the various solutions. The unit of pixel value in each image is in mg/ml. [Color figure can be viewed at wileyonlinelibrary.com]
3.A.5. Low‐contrast resolution
Figure 10 shows the FBP image of the ACR phantom and the MENLM filtered image. In the FBP image, the 6 mm rods are barely visible and the 5 mm rods are totally lost. However, in the MENLM filtered image, all 6 mm and 5 mm rods are clearly visible, indicating improved low‐contrast resolution with the 80% noise reduction. Measurements showed that the mean CT number values were well maintained in the filtered image.
Figure 10.
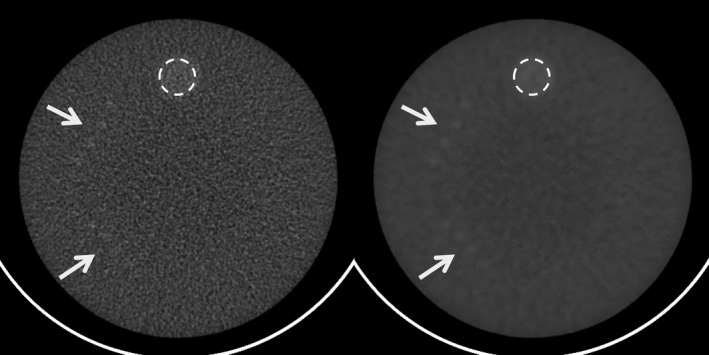
Improved low‐contrast resolution after MENLM filtering (right) comparing to the FBP image (left). Arrows indicate the locations of low‐contrast objects (top: 6 mm rods; Bottom: 5 mm rods). The mean and standard deviation of CT numbers inside the dotted ROI were 99.3 ± 5.5 (left) and 98.6 ± 1.0 HU (right), respectively. W/L = 100/100 HU.
3.B. Clinical feasibility testing
3.B.1. Pig scan
In the threshold‐based pig head images (Fig. 11), MENLM achieved around 80% noise reduction without affecting subtle anatomical structures and energy resolution. This results in enhanced contrast‐to‐noise ratio in all threshold‐based images and improves the differentiation between materials with different composition (e.g., bone and iodinated blood) and/or with different density (e.g., blood vessels with different contrast enhancement).
Figure 11.
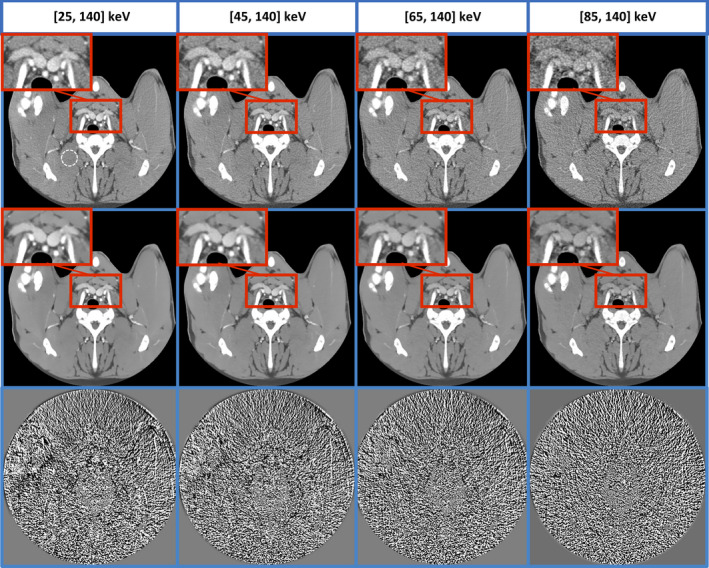
MENLM greatly reduces the noise in threshold‐based images without affecting subtle anatomical structure and energy resolution. In original FBP images (top row, W/L = 400/40 HU), the mean and standard deviation of CT number inside the dotted ROI were 59.6 ± 15.1, 59.9 ± 17.2, 62.2 ± 22.2, and 57.9 ± 32.5, respectively. After MENLM filtering (middle row, W/L = 400/40 HU), the values were 59.5 ± 3.4, 59.5 ± 4.3, 61.5 ± 4.6, and 57.7 ± 7.2, respectively. No obvious image structures or signal bias were observed in the difference images (W/L = 15/0). [Color figure can be viewed at wileyonlinelibrary.com]
In all bin‐based images, MENLM greatly reduced image noise and streaking artifacts, making subtle anatomical structure easier to detect. In low‐energy bin‐based images (Fig. 12, first and second columns, top row) although iodine contrast enhancement is good, small vessels can still be difficult to detect due to the noisy background. After filtering by MENLM, the small vessels are much easier to detect due to the substantial noise reduction (Fig. 12, first and second columns, middle row). Similarly, in high‐energy bin‐based images (Fig. 12, last column, top row), reduced calcium blooming effect, one benefit of photon counting CT, can be observed so that surrounding features (such as lumen inside vessels) can be evaluated without being shaded by bone or high‐density calcification. However, the reduced contrast inside the lumen also makes it difficult to resolve the location and structure of the vessel. After MENLM filtering to control noise, the edge of the vessel can be better resolved with improved CNR and reduced calcium blooming effect (Fig. 12, last column, middle row).
Figure 12.
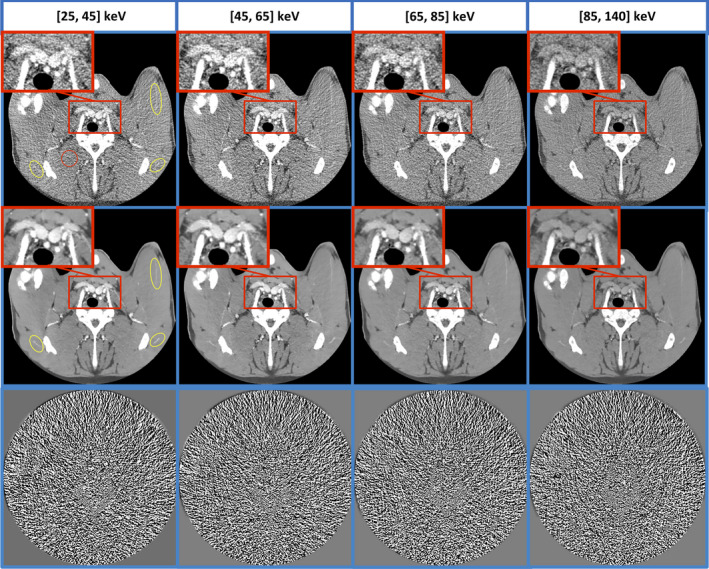
Bin‐based images after MENLM filtering (middle row, W/L = 400/40 HU) improved the detection of subtle enhanced vessels white ROIs in low‐energy bin‐based image) and low‐contrast structures (Close‐ups in high‐energy bin‐based image). In original FBP images (top row, W/L = 400/40 HU.), the mean and standard deviation of CT number inside the red ROI are 62.2 ± 55.6, 62.8 ± 57.8, 67.2 ± 48.8, and 57.9 ± 32.5, respectively. After MENLM filtering, the values are 62.7 ± 9.1, 62.6 ± 10.8, 65.7 ± 9.5, and 57.7 ± 7.2, respectively. No obvious image structures or signal bias were observed in the difference images (W/L = 15/0). [Color figure can be viewed at wileyonlinelibrary.com]
3.B.2. Cadaver head scan
With MENLM filtering, the noise in both threshold‐ and bin‐based images from the cadaver head scan (Fig. 13) was greatly reduced. This greatly enhanced image quality, as evidenced by the improved differentiation between white and gray matter and conspicuity of subtle structures (such as calcifications).
Figure 13.
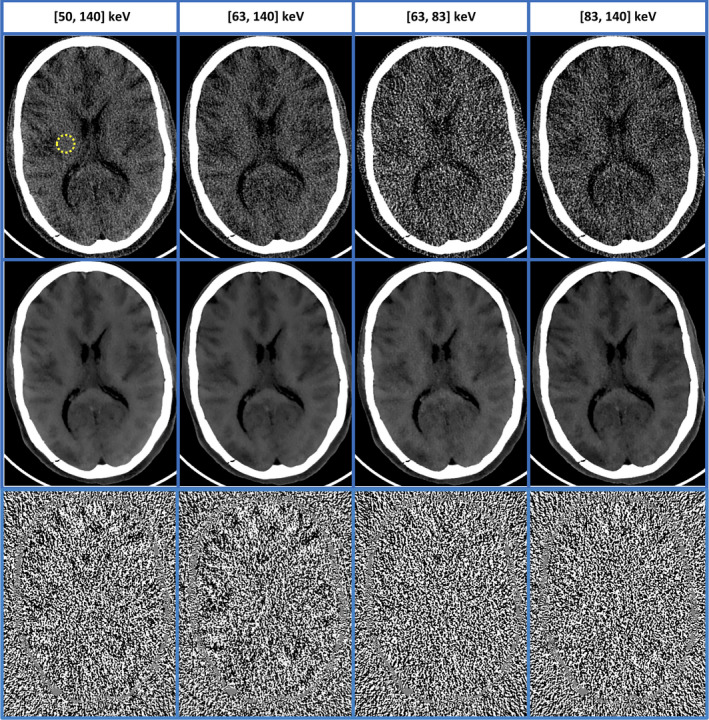
MENLM filtering of two noisy threshold‐based and two bin‐based images (middle row, W/L = 150/20 HU) from a cadaver head scan demonstrated improved low‐contrast resolution. The similarity/weight determined from threshold‐based images provided robustness to noise reduction. (In original FBP images (top row, W/L = 150/20 HU), the mean and standard deviation of the CT number in the dotted ROI were −10.7 ± 15.1 HU, −12.5 ± 18.2 HU, −9.8 ± 40.6 HU, and −13.3 ± 31.1 HU, respectively. With MENLM, the values were −11.3 ± 2.4 HU, −13.1 ± 2.3 HU, −10.0 ± 3.7 HU, and −14.3 ± 3.8 HU, respectively.) No obvious image structures or signal bias were observed in the difference images (W/L = 15/0). [Color figure can be viewed at wileyonlinelibrary.com]
4. Discussion
We presented an image‐domain non‐iterative noise reduction technique to reduce noise in MECT images that can be implemented efficiently. MECT data may require longer pre‐processing, reconstruction, and post‐processing time. Iterative and projection‐domain approaches to noise reduction tend to prolong the time needed to return the final image for viewing. This method processes the reconstructed images directly to achieve fast noise reduction, and it is also convenient since the computation time and the amount of noise reduction can be predetermined.
The presented method differs from other published work that uses a NLM algorithm on spectral or multi‐energy CT data.39 For example, the method from Pan et al. applied the conventional NLM method separately to different energy channels of CT data, which ignored the intrinsic energy‐domain information redundancy in the original data. The work reported by Harm et al.30 was an iterative NLM denoising method based on a very different weight calculation: the similarity between pixels was determined based separately on signal in different CT energy channels and was subsequently averaged in every iteration. Methods similar to ours, however, have been applied to high‐dimensional MRI data where the similarity was evaluated by the pixel value and noise in different channels (proton density, T1 and T2 images).40
As demonstrated by the presented results, MENLM can effectively reduce noise by up to 80% while preserving spatial and energy resolution and improving low‐contrast resolution. This greatly improves the signal to noise ratio in the image, especially for narrow energy bin‐based images, which are associated with high noise levels. Previously, we have reported that decreased beam hardening and calcium blooming were observed in high‐energy bin‐based images and increase contrast enhancement of higher atomic number materials in the low‐energy bin‐based images.35, 41, 42 High‐energy bin‐based images with reduced calcium blooming might improve the accuracy of luminal stenosis quantification, whereas low‐energy bin‐based images with higher contrast may benefit detection of subtle anatomical structures, such as iodine‐filled coronary arteries. However, higher image noise in a narrower energy bin‐based image may offset these benefits, especially for the detection of subtle structures, such as small arteries and calcifications. With MENLM filtering, the noise is greatly reduced and the improved contrast to noise ratio in energy bin‐based images may benefit such tasks, as evidenced by the pig scan and cadaver head results.
The reduced noise and preserved spatial and energy resolution may potentially benefit a series of clinical applications of MECT. Material decomposition, for example, is a primary application of MECT to separate or quantify basis materials from a mixture. However, material decomposition is notorious for its noise magnification, such that basis material images can be too noisy for clinical use. As demonstrated by our three‐basis material decomposition results, with effective noise reduction, both the structure and quantitative accuracy of basis materials were greatly improved in the material density maps. Therefore, MENLM effectively reduced noise without affecting spatial or energy resolution such that the noise levels in the processed images after material decomposition may be adequate to meet clinical requirements. Additionally, the reduction in noise levels may be traded for a large reduction in iodinated contrast usage or radiation dose. Finally, this technique may also benefit image processing techniques (segmentation, classification, etc.) performed on multi‐energy CT images.
An 80% noise reduction with maintained signal fidelity implies a potential 25‐fold radiation dose reduction capability when MENLM is used to maintain image quality. However, slight changes of noise texture (or NPS) were observed in the filtered images (Figs. 3 and 4) and this might affect some relevant clinical tasks. Further clinical studies are required to determine the dose reduction capability of MENLM for different clinical tasks, especially for ones involving low‐contrast detection.43, 44, 45, 46, 47, 48
Our future work will include the optimization of other parameter settings, such as weighting functions, search window, and patch size in space, which are critical to obtaining the optimal balance between noise reduction and image quality. In addition, in this study, we used a manually determined ROI to measure the absolute noise variance in different energy channels for the similarity/weight calculation. This manual noise measurement tends to be subjective and high image noise levels might affect its accuracy. Automatic noise estimation or measurement can be used to overcome this limit. Previously, we developed and validated a fast and accurate method to estimate absolute image noise for the research PCCT system used in this study.20 Such noise estimation results can be more reliable and may alleviate the need the manual noise measurements. A more elegant approach is to perform spatially adaptive noise reduction based on a map of local noise levels. As was demonstrated previously, the filter should take the locally varying noise levels into account to achieve optimal noise reduction.32 We plan to extend the previously developed analytical noise map estimation method for MECT images to further improve the noise reduction performance.
5. Conclusion
We have developed a novel approach to practically and effectively achieve substantial noise reduction for MECT images. The proposed MENLM filter reduced image noise in MECT data by as much as 80% without degrading spatial and energy resolution, while improving material decomposition performance and low‐contrast resolution.
Conflict of interest
CHM receives grant support from Siemens Healthcare for projects unrelated to this work. The other authors have no relevant conflicts of interest to disclose.
6. Acknowledgments
The project described was supported by Grant numbers R01 EB016966 and C06 RR018898 from the National Institute of Health, in collaboration with Siemens Healthcare. The content is solely the responsibility of the authors and does not necessarily represent the official views of the National Institute of Health. The equipment and concepts described in this work are based on a research prototype and are not commercially available. ZL acknowledges fellowship funding from Mayo Graduate School. CHM receives research support from Siemens Healthcare. AM receives royalties from General Electric Company. The authors would like to thank Ms. Kristina M. Nunez for her assistance with manuscript preparation.
References
- 1. McCollough CH, Leng S, Yu L, Fletcher JG. Dual‐ and multi‐energy CT: Principles, technical approaches, and clinical applications. Radiology. 2015;276:637–653. [DOI] [PMC free article] [PubMed] [Google Scholar]
- 2. Chandarana H, Megibow AJ, Cohen BA, et al. Iodine quantification with dual‐energy CT: Phantom study and preliminary experience with renal masses. AJR Am J Roentgenol. 2011;196:W693–W700. [DOI] [PubMed] [Google Scholar]
- 3. Li Y, Shi G, Wang S, Wang S, Wu R. Iodine quantification with dual‐energy CT: Phantom study and preliminary experience with VX2 residual tumour in rabbits after radiofrequency ablation. Br J Radiol. 2013;86:1–9. [DOI] [PMC free article] [PubMed] [Google Scholar]
- 4. Yu LF, Christner JA, Leng S, Wang J, Fletcher JG, McCollough CH. Virtual monochromatic imaging in dual‐source dual‐energy CT: Radiation dose and image quality. Med Phys. 2011;38:6371–6379. [DOI] [PMC free article] [PubMed] [Google Scholar]
- 5. Yuan R, Shuman WP, Earls JP, et al. Reduced iodine load at CT pulmonary angiography with dual‐energy monochromatic imaging: Comparison with standard CT pulmonary angiography–a prospective randomized trial. Radiology. 2012;262:290–297. [DOI] [PubMed] [Google Scholar]
- 6. Buerke B, Wittkamp G, Seifarth H, Heindel W, Kloska SP. Dual‐energy CTA with bone removal for transcranial arteries: Intraindividual comparison with standard CTA without bone removal and TOF‐MRA. Acad Radiol. 2009;16:1348–1355. [DOI] [PubMed] [Google Scholar]
- 7. Johnson TR, Krauss B, Sedlmair M, et al. Material differentiation by dual energy CT: Initial experience. Eur Radiol. 2007;17:1510–1517. [DOI] [PubMed] [Google Scholar]
- 8. Primak AN, Fletcher JG, Vrtiska TJ, et al. Noninvasive differentiation of uric acid versus non‐uric acid kidney stones using dual‐energy CT. Acad Radiol. 2007;14:1441–1447. [DOI] [PMC free article] [PubMed] [Google Scholar]
- 9. Graser A, Johnson TR, Bader M, et al. Dual energy CT characterization of urinary calculi: Initial in vitro and clinical experience. Invest Radiol. 2008;43:112–119. [DOI] [PubMed] [Google Scholar]
- 10. Choi HK, Al‐Arfaj AM, Eftekhari A, et al. Dual energy computed tomography in tophaceous gout. Ann Rheum Dis. 2009;68:1609–1612. [DOI] [PubMed] [Google Scholar]
- 11. Nicolaou S, Yong‐Hing CJ, Galea‐Soler S, Hou DJ, Louis L, Munk P. Dual‐energy CT as a potential new diagnostic tool in the management of gout in the acute setting. AJR Am J Roentgenol. 2010;194:1072–1078. [DOI] [PubMed] [Google Scholar]
- 12. Glazebrook KN, Guimaraes LS, Murthy NS, et al. Identification of intraarticular and periarticular uric acid crystals with dual‐energy CT: Initial evaluation. Radiology. 2011;261:516–524. [DOI] [PubMed] [Google Scholar]
- 13. Roessl E, Proksa R. K‐edge imaging in x‐ray computed tomography using multi‐bin photon counting detectors. Phys Med Biol. 2007;52:4679–4696. [DOI] [PubMed] [Google Scholar]
- 14. Schlomka JP, Roessl E, Dorscheid R, et al. Experimental feasibility of multi‐energy photon‐counting K‐edge imaging in pre‐clinical computed tomography. Phys Med Biol. 2008;53:4031–4047. [DOI] [PubMed] [Google Scholar]
- 15. Li Z, Leng S, Yu L, Yu Z, McCollough CH. Image‐based material decomposition with a general volume constraint for photon‐counting CT. In SPIE Medical Imaging. Bellingham, WA: International Society for Optics and Photonics; 2015:94120T. [DOI] [PMC free article] [PubMed] [Google Scholar]
- 16. Pelc NJ. Recent and future directions in CT imaging. Ann Biomed Eng. 2014;42:260–268. [DOI] [PMC free article] [PubMed] [Google Scholar]
- 17. Taguchi K and Iwanczyk JS. Vision 20/20: Single photon counting x‐ray detectors in medical imaging. Med Phys. 2013;40:100901. [DOI] [PMC free article] [PubMed] [Google Scholar]
- 18. Schmidt TG. Optimal “image‐based” weighting for energy‐resolved CT. Med Phys. 2009;36:3018–3027. [DOI] [PubMed] [Google Scholar]
- 19. Shikhaliev PM. Computed tomography with energy‐resolved detection: A feasibility study. Phys Med Biol. 2008;53:1475–1495. [DOI] [PubMed] [Google Scholar]
- 20. Yu Z, Leng S, Kappler SG, et al. Low‐dose performance of a whole‐body research photon‐counting CT scanner. In SPIE Medical Imaging, San Diego, California, United States: International Society for Optics and Photonics; Vol. 9783 2016. In press. [Google Scholar]
- 21. Leng S, Yu LF, Wang J, Fletcher JG, Mistretta CA, McCollough CH. Noise reduction in spectral CT: Reducing dose and breaking the trade‐off between image noise and energy bin selection. Med Phys. 2011;38:4946–4957. [DOI] [PubMed] [Google Scholar]
- 22. Macovski A, Nishimura DG, Doost‐Hoseini A, Brody WR. Measurement‐dependent filtering: A novel approach to improved SNR. IEEE Trans Med Imaging. 1983;2:122–127. [DOI] [PubMed] [Google Scholar]
- 23. Kalender WA, Klotz E, Kostaridou L. An algorithm for noise suppression in dual energy CT material density images. IEEE Trans Med Imaging. 1988;7:218–224. [DOI] [PubMed] [Google Scholar]
- 24. Niu TY, Dong X, Petrongolo M, Zhu L. Iterative image‐domain decomposition for dual‐energy CT. Med Phys. 2014;41;041901. [DOI] [PubMed] [Google Scholar]
- 25. Manhart M, Fahrig R, Hornegger J, Doerfler A, Maier A. Guided noise reduction for spectral CT with energy‐selective photon counting detectors. Proc CT Meet. 2014;91–94. [Google Scholar]
- 26. Xi Y, Chen Y, Tang RB, Sun JQ, Zhao J. United iterative reconstruction for spectral computed tomography. IEEE Trans Med Imaging. 2015;34:769–778. [DOI] [PubMed] [Google Scholar]
- 27. Dong X, Niu TY, Zhua L. Combined iterative reconstruction and image‐domain decomposition for dual energy CT using total‐variation regularization. Med Phys. 2014;41:051909. [DOI] [PubMed] [Google Scholar]
- 28. Clark DP and Badea CT. Spectral diffusion: An algorithm for robust material decomposition of spectral CT data. Phys Med Biol. 2014;59:6445–6466. [DOI] [PMC free article] [PubMed] [Google Scholar]
- 29. Yu Z, Leng S, Li Z, McCollough CH. Spectral prior image constrained compressed sensing (spectral PICCS) for photon‐counting computed tomography. Phys Med Biol. 2016;61:6707. [DOI] [PMC free article] [PubMed] [Google Scholar]
- 30. Harms J, Wang T, Petrongolo M, Niu T, Zhu L. Noise suppression for dual‐energy CT via penalized weighted least‐square optimization with similarity‐based regularization. Med Phys. 2016;43:2676–2686. [DOI] [PMC free article] [PubMed] [Google Scholar]
- 31. Buades A, Coll B, Morel JM. A review of image denoising algorithms, with a new one. Multiscale Modeling & Simulation. 2005;4:490–530. [Google Scholar]
- 32. Li Z, Yu L, Trzasko JD, et al. Adaptive nonlocal means filtering based on local noise level for CT denoising. Med Phys. 2014;41:011908. [DOI] [PubMed] [Google Scholar]
- 33. Li Z, Yu L, Leng S, et al. A robust noise reduction technique for time resolved CT. Med Phys. 2016;43:347–359. [DOI] [PubMed] [Google Scholar]
- 34. Kappler S, Hannemann T, Kraft E, et al. First results from a hybrid prototype CT scanner for exploring benefits of quantum‐counting in clinical CT. In SPIE Medical Imaging. Vol. 8313. Bellingham, WA: International Society for Optics and Photonics; 2012: 83130X‐83111. [Google Scholar]
- 35. Yu Z, Leng S, Jorgensen SM, et al. Initial results from a prototype whole‐body photon‐counting computed tomography system. In SPIE Medical Imaging. Bellingham, WA: International Society for Optics and Photonics; 2015:94120:94120W. [DOI] [PMC free article] [PubMed] [Google Scholar]
- 36. Siewerdsen JH, Cunningham IA, Jaffray DA. A framework for noise‐power spectrum analysis of multidimensional images. Med Phys. 2002;29:2655–2671. [DOI] [PubMed] [Google Scholar]
- 37. Dolly S, Chen H‐C, Anastasio M, Mutic S, Li H. Practical considerations for noise power spectra estimation for clinical CT scanners. J Appl Clin Med Phys. 2016;17:5841. [DOI] [PMC free article] [PubMed] [Google Scholar]
- 38. Boone JM. Determination of the presampled MTF in computed tomography. Med Phys. 2001;28:356–360. [DOI] [PubMed] [Google Scholar]
- 39. Pan N, Liu H, De Ruiter N, Grasset R. Improving the image quality of spectral CT volume rendering. In 24th International Conference Image and Vision Computing New Zealand. 2009; 203–208.
- 40. Manjon JV, Robles M, Thacker NA. Multispectral MRI De‐noising using non‐local means. In Proc MIUA. Manchester: TINA; 2007. [Google Scholar]
- 41. Yu Z, Leng S, Jorgensen SM, et al. Evaluation of conventional imaging performance in a research whole‐body CT system with a photon‐counting detector array. Phys Med Biol. 2016;61:1572–1595. [DOI] [PMC free article] [PubMed] [Google Scholar]
- 42. Gutjahr R, Halaweish AF, Yu Z, et al. Human imaging with photon counting‐based computed tomography at clinical dose levels: Contrast‐to‐noise ratio and cadaver studies. Invest Radiol. 2016;51:421–429. [DOI] [PMC free article] [PubMed] [Google Scholar]
- 43. McCollough CH, Yu L, Kofler JM, et al. Degradation of CT low‐contrast spatial resolution due to the use of iterative reconstruction and reduced dose levels. Radiology. 2015;276:499–506. [DOI] [PMC free article] [PubMed] [Google Scholar]
- 44. Baker ME, Dong F, Primak A, et al. Contrast‐to‐noise ratio and low‐contrast object resolution on full‐and low‐dose MDCT: sAFIRE versus filtered back projection in a low‐contrast object phantom and in the liver. Am J Roentgenol. 2012;199:8–18. [DOI] [PubMed] [Google Scholar]
- 45. Goenka AH, Herts BR, Obuchowski NA, et al. Effect of reduced radiation exposure and iterative reconstruction on detection of low‐contrast low‐attenuation lesions in an anthropomorphic liver phantom: An 18‐reader study. Radiology. 2014;272:154–163. [DOI] [PubMed] [Google Scholar]
- 46. Yu L, Vrieze TJ, Leng S, Fletcher JG, McCollough CH. Technical Note: Measuring contrast‐and noise‐dependent spatial resolution of an iterative reconstruction method in CT using ensemble averaging. Med Phys. 2015;42:2261–2267. [DOI] [PMC free article] [PubMed] [Google Scholar]
- 47. Li K, Garrett J, Ge Y, Chen G‐H. Statistical model based iterative reconstruction (MBIR) in clinical CT systems. Part II. Experimental assessment of spatial resolution performance. Med Phys. 2014;41:071911. [DOI] [PMC free article] [PubMed] [Google Scholar]
- 48. Schindera ST, Odedra D, Raza SA, et al. Iterative reconstruction algorithm for CT: Can radiation dose be decreased while low‐contrast detectability is preserved? Radiology. 2013;269:511–518. [DOI] [PubMed] [Google Scholar]


