Abstract
Purpose
To improve the performance for localizing epileptic foci, we have developed a joint ictal/inter‐ictal SPECT reconstruction method in which ictal and inter‐ictal SPECT projections are simultaneously reconstructed to obtain the differential image.
Methods
We have developed a SPECT reconstruction method that jointly reconstructs ictal and inter‐ictal SPECT projection data. We performed both phantom and patient studies to evaluate the performance of our joint method for epileptic foci localization as compared with the conventional subtraction method in which the differential image is obtained by subtracting the inter‐ictal image from the co‐registered ictal image. Two low‐noise SPECT projection datasets were acquired using 99mTc and a Hoffman head phantom at two different positions and orientations. At one of the two phantom locations, a low‐noise dataset was also acquired using a 99mTc‐filled 3.3‐cm sphere with a cold attenuation background identical to the Hoffman phantom. These three datasets were combined and scaled to mimic low‐noise clinical ictal (three different lesion‐to‐background contrast levels: 1.25, 1.55, and 1.70) and inter‐ictal scans. For each low‐noise dataset, 25 noise realizations were generated by adding Poisson noise to the projections. The mean and standard deviation (SD) of lesion contrast in the differential images were computed using both the conventional subtraction and our joint methods. We also applied both methods to the 35 epileptic patient datasets. Each differential image was presented to two nuclear medicine physicians to localize a lesion and specify a confidence level. The readers’ data were analyzed to obtain the localized‐response receiver operating characteristic (LROC) curves for both the subtraction and joint methods.
Results
For the phantom study, the difference between the mean lesion contrast in the differential images obtained using the conventional subtraction versus our joint method decreases as the iteration number increases. Compared with the conventional subtraction approach, the SD reduction of lesion contrast at the 10th iteration using our joint method ranges from 54.7% to 68.2% (P < 0.0005), and 33.8% to 47.9% (P < 0.05) for 2 and 4 million total inter‐ictal counts, respectively. In the patient study, our joint method increases the area under LROC from 0.24 to 0.34 and from 0.15 to 0.20 for the first and second reader, respectively. We have demonstrated improved performance of our method as compared to the standard subtraction method currently used in clinical practice.
Conclusion
The proposed joint ictal/inter‐ictal reconstruction method yields better performance for epileptic foci localization than the conventional subtraction method.
Keywords: epileptic foci localization, joint ictal/inter‐ictal SPECT reconstruction
1. Introduction
Epilepsy is one of the most common neurological disorders in children and young adults with devastating economic and psychosocial impacts.1, 2 Epileptic patients with persistent and refractory seizures may be cured with selective surgery to remove the region of cortex that generates seizure, the epileptogenic zone.3, 4, 5 To increase the surgical success rate, epileptic foci must be accurately identified and localized prior to the operation. Single‐photon emission computed tomography (SPECT) currently plays a dominant role in epileptic foci localization based on perfusion imaging with 99mTc‐HMPAO or 99mTc‐ECD, which has rapid uptake into the brain within 30–60 s after tracer injection, reflecting cerebral blood flow (CBF) at the time of the injection.6, 7 Because CBF is closely linked to neuronal activity and the perfusion tracer has negligible redistribution,8, 9 SPECT creates a “snapshot” of brain activity at the time of the injection. Brain perfusion SPECT studies are indicated in localization‐related refractory epilepsy in whom other presurgical evaluation methods including video EEG monitoring (VEM) and MRI provide discordant data.10, 11 It is also used to design the area of intracranial EEG placement before surgery.12 Epileptic foci localization using SPECT consists of two separate studies, where one study depicts the brain when it is not undergoing an epileptic seizure (inter‐ictal SPECT), while the other depicts the brain during an epileptic event (ictal SPECT). Seizure foci can be localized based on their perfusion status; they cause hyperperfusion in the ictal study, and hypoperfusion in the inter‐ictal study, where increased activity between the two studies indicates a focus location. Visual comparison of the ictal and inter‐ictal SPECT images side‐by‐side can be difficult. The conventional subtraction method has been shown to improve the usefulness of SPECT in localizing the surgical seizure focus and is widely used in clinical practice.13, 14 There are three main steps in the subtraction method. First, the reconstructed ictal and inter‐ictal SPECT image volumes are coregistered and normalized to each other. Second, the inter‐ictal volume is subtracted from the ictal volume. Third, the resulting difference image volume (the differential image volume) is overlapped on an MRI to anatomically localize the epileptic focus. A previous study10 showed that the conventional subtraction method described above has 86% sensitivity and 75% specificity for epileptic focus localization using the findings by intracranial electroencephalography (EEG) as the gold standard. However, owing to the possible delay of radiotracer administration during the ictal state in clinical practice, both the sensitivity and specificity can be lowered. Therefore, improving our ability to localize an epileptic focus is desirable.
The differential image obtained using the conventional subtraction method generally has much higher noise than either the ictal or inter‐ictal image alone due to the limited number of counts in a SPECT scan and the fact that the subtraction of two noisy images yields a smaller signal with a higher noise level. One way to overcome this problem is to apply intensive smoothing and/or stop at an early iteration when ictal and inter‐ictal data are reconstructed. However, as a result, the performance of seizure localization may be degraded because large bias can be introduced. Moreover, negative voxel values in the differential images obtained by the subtraction method cannot be avoided.
For an imaging system with limited counts like SPECT, one of the most effective approaches to improve image quality is to correctly model the noise in SPECT projections. Inspired by our previous work on dual‐radionuclide SPECT,15, 16, 17 we propose a novel reconstruction method in which both ictal and inter‐ictal projections are jointly reconstructed while preserving Poisson noise on both scans in a single reconstruction framework. Moreover, the registration transformation between the ictal and the inter‐ictal scans is incorporated within the joint reconstruction to mitigate the effect of the patient's head position mismatch between the two separately acquired scans. Our method generates differential and inter‐ictal image volumes from a single reconstruction step that avoids negative voxel values in the resulting images. In this study, we evaluated the performance of our method for epileptic foci localization using both phantom and patient studies.
2. Materials and methods
First, we explain the conventional subtraction method we used in this work, which is similar to the method used in clinical practice (See Fig. 1, left). Second, we explain our joint ictal/inter‐ictal reconstruction method, which incorporates image registration between two separately acquired SPECT scans (See Fig. 1, right). Third, we describe the evaluation of our approach using both phantom and patient studies.
Figure 1.
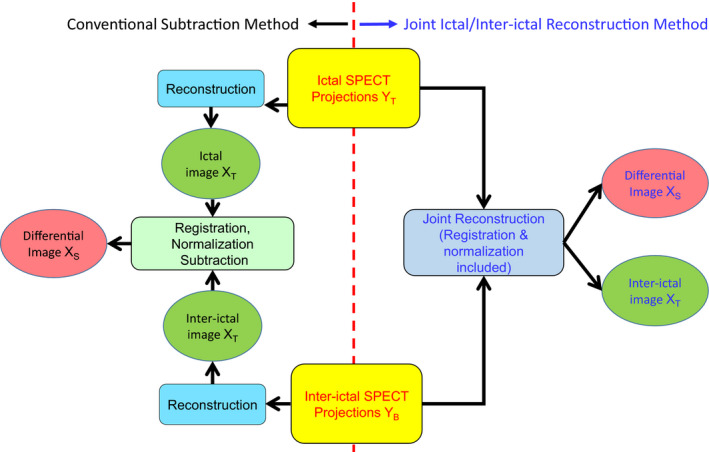
Schematic diagrams for the conventional subtraction (left) and the joint (right) methods to reconstruct the differential image. [Color figure can be viewed at wileyonlinelibrary.com]
2.A. Conventional subtraction method
Protocols for the conventional subtraction method vary from institution to institution although they are similar. In this work, we used the following protocol for a pair of separately acquired ictal and inter‐ictal SPECT scans. First, the ictal and inter‐ictal projection data were reconstructed separately using an ordered‐subset expectation maximization (OSEM) algorithm with 10 iterations. Second, the resulting ictal and inter‐ictal images at the 4th iteration were coregistered using the Statistical Parametric Mapping (SPM) software18 to obtain the registration transformation matrix. Third, the ictal image was normalized to the inter‐ictal image so that the total counts in both studies were matched. Finally, the registration transformation was applied to the reconstructed inter‐ictal image volume for each iteration. A differential image was then obtained by subtracting the resulting inter‐ictal image from the ictal image.
The point spread functions (PSF) were simulated using a point 99mTc source in air for 32 distances from the detector (32 bins from 0.2 to 48.2 cm). The PSF simulation was performed for a 0.95‐cm NaI(Tl) crystal and two types of Siemens collimators (Siemens Medical Solutions, Malvern, PA, USA), low‐energy high‐resolution (LEHR), and low‐energy ultra‐high‐resolution (LEUHR) parallel‐hole collimators. The reconstruction parameters were 8 subsets and 10 iterations (24 subsets and 5 iterations) for the phantom (patient) studies.
2.B. Proposed method: joint ictal/inter‐ictal reconstruction
The proposed joint reconstruction approach incorporates Poisson noise modeling as well as interscan misregistration compensation into the reconstruction system matrix. The purpose of the joint reconstruction method is to obtain seizure‐only (i.e., differential) image volume directly from ictal and inter‐ictal projections in a single reconstruction framework. The key is to preserve Poisson noise on both ictal and inter‐ictal projections during the reconstruction so that noise level in the differential image can be reduced. Moreover, misregistration compensation is included in the reconstruction framework because the head positions during the ictal and inter‐ictal scans are likely to be different for a given subject in practice.
The forward model used in the joint method is given by:
| (1) |
where
| (2) |
X S (N × 1 matrix) and X B (N × 1 matrix) are the differential and background (inter‐ictal) images, respectively, (M × 1 matrix) and (M × 1 matrix) are the estimated ictal and inter‐ictal projections, respectively (Y T and Y B represent the acquired projection data that contain noise), β is a scale factor between the ictal and inter‐ictal scans, R (N × N matrix) is the registration transformation matrix that transforms the head's location in the inter‐ictal scan to that in the ictal scan, H T (M × N matrix) and H B (M × N matrix) are the transition matrices for the ictal and inter‐ictal scans, respectively, and 0 is a matrix with all its elements equal to 0. Each element of the transition matrix (i.e., H T and H B ) represents the probability for a photon emitted from a voxel to be detected in a projection bin without interaction in the imaging object. PSF modeling and attenuation are incorporated into the transition matrices. Scatter correction was not used in this work but could be applied to this method in the future.
This forward model leads to the following standard ML‐EM iterative reconstruction (from iteration n to n + 1) in the matrix‐vector format:
| (3) |
where 1 is a column vector with all its elements equal to 1. In Eq. (3), if two vectors, such as U and V, are of the same size, UV and denote element‐wise multiplication and division, respectively. Consequently, the estimates of X S and X B are given by:
| (4) |
This equation leads to the following two equations, which are used to jointly estimate X S and X B at each iteration.
| (5) |
| (6) |
In this work, we used the OSEM version of Eqs. (5) and (6).
To describe the joint method in a more understandable way, the MLEM reconstruction of image V (2N × 1 matrix) from measurement U (2M × 1 matrix) according to Eq. (1) is given by:
| (7) |
where
| (8) |
| (9) |
x S,i and x B,i‐N are the values of the ith and the (i – n)th voxel of X S and X B , respectively, y T,m and y B,(m‐M) are the values of the mth and the (m – M)th projection bin in Y T and Y B , respectively, and q m←i is the transition matrix element from the ith voxel in V to the mth projection bin in U. Assuming both the ictal and inter‐ictal scans are perfectly registered and performed on the same scanner (i.e., R = I, and H T = H B ), we have
| (10) |
where h k←j = a k←j p k←j (a k←j and p k←j and represent attenuation and PSF modeling, respectively) is the transition matrix element from jth voxel in X to projection bin in Y. Eq. (10), which is based on the assumption of R = I and H T = H B , was given here to help the reader better understand the joint method. Our joint method is based on Eqs. (5) and (6), where such assumption is not made.
The scale factor β and the registration transformation matrix R were obtained in the same way as described above in the conventional subtraction method. For both the conventional and joint methods, the attenuation matrix was computed based on an attenuation map. This was accomplished by thresholding the reconstructed SPECT image without attenuation correction to identify the head volume followed by the assignment of a single linear attenuation coefficient to the entire head volume for both the ictal and inter‐ictal scans. For the joint reconstruction method, the PSFs and reconstruction parameters were made the same as the ones used in the subtraction method.
2.C. Phantom experiment
In the phantom study, two low‐noise 99mTc SPECT projection sets, PRJA and PRJB, were acquired of a 3D Hoffman brain phantom (Data Spectrum Corporation, Durham, NC, USA) at two different positions and orientations using a Siemens Symbia dual‐head SPECT camera (Siemens Medical Solutions, Malvern, PA, USA) with LEHR parallel‐hole collimators. These two projection datasets were treated as if they were low‐noise because they had total counts of 37 million and 25 million, which are more than ten times of the total counts (~2 million) in a typical brain SPECT. One low‐noise projection dataset, PRJSPH, was also acquired of a 99mTc filled 3.3‐cm sphere with a cold attenuation background identical to the Hoffman phantom at one of the two phantom locations. The sphere dataset had a total count of 4.6 million. Due to the relatively small volume of the sphere, PRJSPH was also treated as low‐noise. Datasets, PRJA and PRJSPH, were combined to mimic low‐noise clinical ictal scans with three lesion‐to‐background contrast (LBC) levels: 1.25, 1.55, and 1.70. Dataset PRJB was treated as an inter‐ictal scan. Total counts were scaled to 2 and 4 million to mimic the statistics in typical clinical studies. Twenty‐five noise realizations were generated separately for the ictal and inter‐ictal scans by adding Poisson noise to the projections. The differential images were reconstructed using both the conventional subtraction and the proposed joint ictal/inter‐ictal methods. A total of 300 differential images were created (2 reconstruction methods, 3 LBC levels, 2 total count levels, 25 noise realizations).
For each noise realization i, we computed the lesion contrast in the differential image, C i , using:
| (11) |
where ROIBck,i and ROILes,i were the average counts (counts/voxel) within the background and lesion regions, respectively. The lesion ROI was selected as a 3.3‐cm spherical region centered at the sphere location, while the background ROI was an identical spherical region on the opposite hemisphere of the brain phantom. Figure 2 illustrates the procedures to generate ictal/inter‐ictal phantom data for one of the noise realizations and LBC levels. The mean and standard deviation (σ C ) of lesion contrast were then computed across all the noise realizations using:
| (12) |
where N is the total number of noise realizations.
Figure 2.

Procedures to generate ictal/inter‐ictal phantom data. [Color figure can be viewed at wileyonlinelibrary.com]
2.D. Patient data and human observer study
We selected 35 epileptic patients who previously underwent clinical ictal/inter‐ictal scans at Boston Children's Hospital using a Siemens dual‐head SPECT camera (Siemens Medical Solutions, Malvern, PA, USA) with LEUHR parallel‐hole collimators. These patients also underwent surgery with a positive pathological result indicating a lesion in only one hemisphere of the brain. The patient data collection was approved by Institutional Review Board at Boston Children Hospital. Each subject was scanned using a standard ictal/inter‐ictal SPECT protocol with 99mTc‐HMPAO or 99mTc‐ECD. Each patient dataset included one ictal SPECT, one inter‐ictal SPECT, and one physician's report detailing the epileptic focus location based on the surgical findings, which was considered the gold standard for seizure localization. We applied the conventional subtraction and joint reconstruction methods to each patient dataset to obtain a differential image. A total of 70 differential images were created (two reconstruction methods and 35 patient datasets). The training and testing sets for the human observer study consist of 10 (5 subjects) and 60 (30 subjects) differential images, respectively.
The differential images were presented to two nuclear medicine physicians. Each reader was presented with 10 training images followed by 60 testing images, which were randomized with respect to order. Each image contained exactly one lesion. The readers were able to modify the color scale of the image display as desired. For a given subject, without knowledge about the presence and absence of the lesion, the readers were instructed to examine the image and select the most likely lobe (out of the four lobes: frontal, temporal, parietal, and occipital) where a seizure focus was located. The readers were also asked to examine both the left and right hemispheres separately. Each reader was given a 5‐point scale to rate the confidence level of his or her decision on the lesion location. As a result, there were reading results for both lesion‐absent and lesion‐present data in the human observer study. Each reader's input dataset was analyzed using the LROCFIT program19 to obtain localization receiver operating characteristic (LROC) curves and the area under the curve (AUCLROC) for both the subtraction and joint methods.
3. Results
For the phantom study, Fig. 3 displays the reconstructed differential images versus the iteration number for one of the 25 noise realizations when the LBC was 1.25 and the total number of counts was 2 million. Our joint reconstruction method yielded visually much better lesion localization (pointed by the pink arrows) than the subtraction method.
Figure 3.
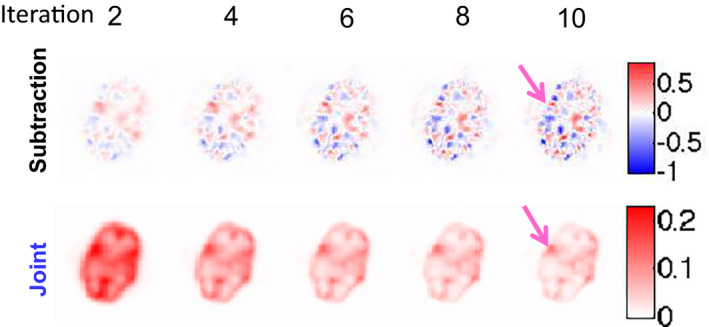
Differential images obtained from both the subtraction and joint methods for the phantom study when LBC is 1.25 and total number of counts is 2 million. The pink arrows point to the lesion.
Figure 4 shows the mean of the lesion contrast in the differential image versus the iteration number at different LBC levels for 2 million total counts. For all the cases, the difference of the mean between the subtraction and joint methods decreased as the iteration number increased. Also, the higher the LBC level, the faster the joint reconstruction converged. Figure 5 shows the SD of the lesion contrast in the differential image versus the iteration number at different LBC levels for 2 and 4 million total counts. Compared with the conventional subtraction approach, our proposed joint method significantly reduced the SD of lesion contrast at 1.25, 1.55, 1.70 LBC levels by 64.9, 61.8, and 68.2% (at 10th iteration with P < 0.0005), respectively, for 2 million total counts, and by 37.0, 33.8, and 38.1% (at 10th iteration with P < 0.05), respectively, for 4 million total counts.
Figure 4.
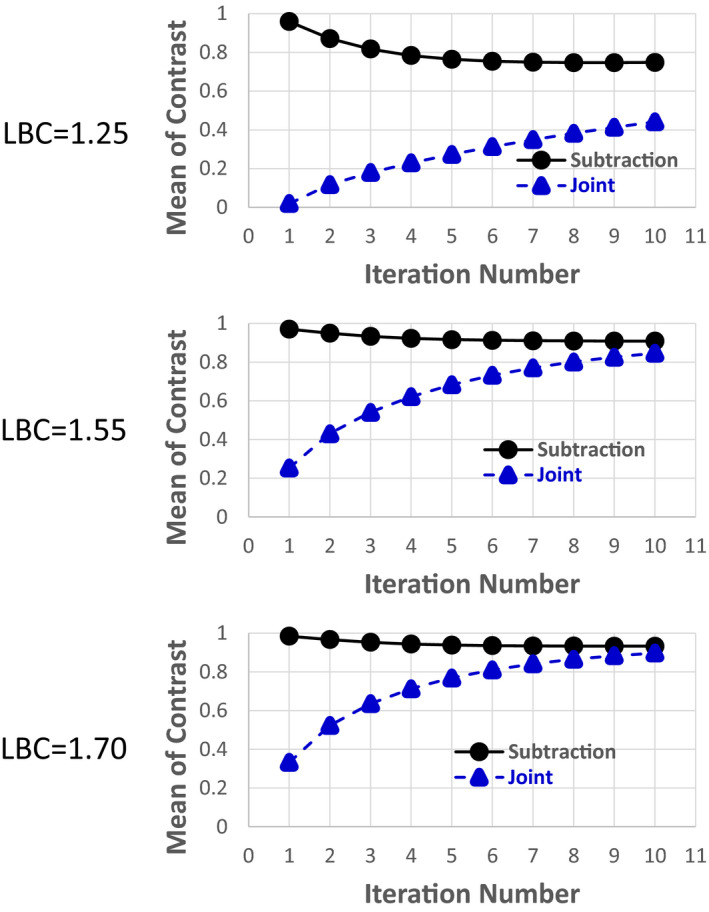
Mean of lesion contrast () in the differential image versus iteration number for both the subtraction and joint methods for the phantom study. Total number of counts is 2 million. [Color figure can be viewed at wileyonlinelibrary.com]
Figure 5.
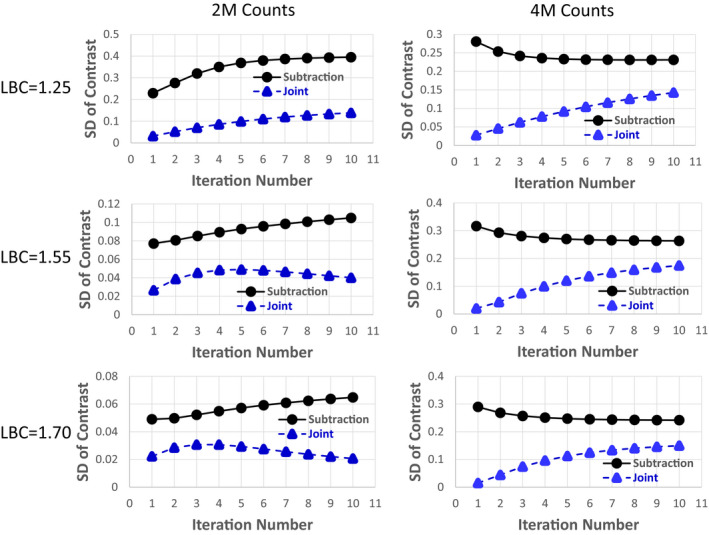
SD of lesion contrast (σC) in the differential image versus the iteration number for both the subtraction and joint methods for the phantom study. [Color figure can be viewed at wileyonlinelibrary.com]
Figure 6 shows the reconstructed differential images from one of the subjects at iteration 5. The proposed joint method yielded less noisy differential images and better epileptic focus localization than the subtraction method. The seizure region could be seen more clearly in the images reconstructed using the joint method (Fig. 6, right) as compared with the subtraction method (Fig. 6, left), and the subtraction method with thresholding to show only a non‐negative display window (Fig. 6, middle). The identified seizure location was concordant with the pathological result, in which the epileptic focus in the right temporal lobe was identified. The voxel‐wise mean‐to‐SD ratio (within the seizure focus region) was 1.80 and 0.58 for the joint reconstruction and the subtraction method, respectively.
Figure 6.
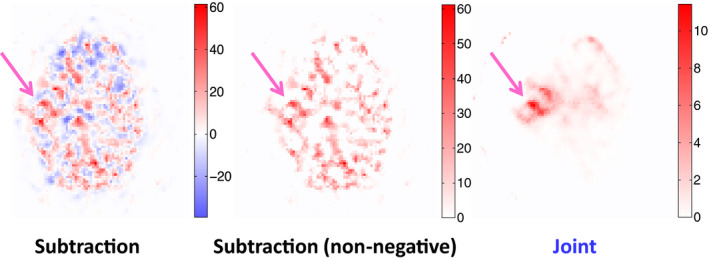
Differential images for one subject obtained from the subtraction method, the subtraction method with non‐negative windowing, and the joint method. The pink arrows point to the epileptic focus.
Figure 7 shows the LROC curves of the subtraction and the joint methods obtained from the two readers. The curve of the joint method lies consistently above that of the subtraction method for both readers. The ALROC values are 0.34 (0.24) and 0.2 (0.15) for the joint and subtraction methods, respectively, for reader 1 (2).
Figure 7.
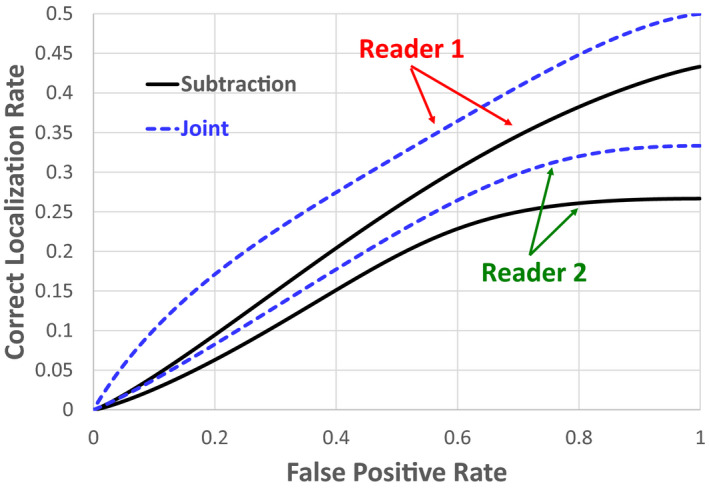
Comparison of LROC curves between the subtraction and joint methods generated by the two readers. [Color figure can be viewed at wileyonlinelibrary.com]
4. Discussion
The key idea of the proposed joint method to obtain differential images for epileptic foci location using SPECT was to avoid image subtraction, which typically results in noisy images and negative voxel values. This translates into better results in mean and SD analysis in the phantom study and better foci localization performance characterized by the LROC curves in the patient study.
The results from the SD analysis in the phantom study support the improvement of the proposed joint method over the subtraction method (Fig. 5). The SD from the proposed joint method was lower than that from the subtraction method in all cases as the joint method preserves Poisson noise on SPECT projections and estimates differential images directly from both ictal and inter‐ictal SPECT data rather than subtracting two independently reconstructed images. The results were also consistent for two different noise levels (total counts of 2 million and 4 million) indicating that radiation dose or imaging time could be reduced if the joint rather than the subtraction method was used in clinical practice. However, as the total number of counts increases, the advantage of using the joint method to reduce the SD as compared to the subtraction method decreased. Based on the phantom study, the amount of SD reduction made by the joint method relative to the subtraction method does not seem to be strongly correlated to the LBC level. We also would like to point out that the disadvantage of using the joint method is that more iterations are needed for the reconstruction to converge, especially when the LBC level is low, as shown in Fig. 4.
The advantages of the proposed joint method over the conventional subtraction method were pronounced in the patient study (Figs. 6 and 7). The negative pixel value issue was encountered in the subtraction method. Thresholding to set all negative values to zero (Fig. 6, middle) did not improve the differential image sufficiently to make it comparable to what could be achieved using our proposed joint method (Fig. 6, right). The differential image from the joint method had less noise compared to that from the subtraction method with and without thresholding. The human observer study for foci localization also showed the gain of using the proposed joint method over the subtraction method.
For both the phantom and patient studies, the proposed joint method yielded less SD of lesion contrast than the conventional subtraction method. Because the SD of lesion contrast is dependent on the number of detected photons, it implies that imaging time or injection dose can be reduced if the proposed joint method is used instead of the conventional method without compromising the sensitivity and specificity of lesion localization.
Both the conventional subtraction and the proposed joint methods require image registration between two separately acquired ictal and inter‐ictal SPECT scans. Due to the poor spatial resolution for SPECT imaging, such registration is not accurate. Moreover, head motion during SPECT scans can blur the reconstructed SPECT images. These two challenging problems can result in significantly reduced sensitivity and specificity of lesion localization. One possible solution is to use a video camera‐based surveillance system to monitor the head motion during SPECT scans and to facilitate image registration. However, the clinical feasibility of such approach needs to be investigated.
Both parallel‐ and fan‐beam collimators are used for ictal/inter‐ictal imaging in clinical practice. In this study, the phantom and patient data were acquired using LEHR and LEUHR parallel‐hole collimators. In the future, we plan to develop a joint method that incorporates PSF modeling for fan‐beam collimators.20
In this study, attenuation correction was based on the assumption that the brain has a constant linear attenuation coefficient throughout. Although accurate attenuation correction can be achieved using SPECT‐CT, SPECT‐CT is rarely used for ictal/inter‐ictal imaging. Based on the fact that each patient typically has an MRI scan, we plan to perform MR‐based SPECT attenuation correction based on the development of MR‐based PET attenuation correction for PET‐MR imaging21, 22 in the future. We anticipate this will reduce artifacts in reconstructed SPECT images, particularly for deep brain regions.
5. Conclusion
We propose a joint ictal/inter‐ictal reconstruction method in which both ictal and inter‐ictal projections are reconstructed jointly in a single reconstruction framework to obtain the differential image. This joint ictal/inter‐ictal reconstruction method achieves better image quality, hence holding promise to provide a better alternative to the current standard subtraction method used for epileptic foci localization in clinical practice.
Conflict of interest
The authors report no conflicts of interest in conducting this research.
Acknowledgments
The authors thank Dr. Yoann Petibon for the discussion on image registration. This work was supported in part by grant R21‐NS090036 from National Institutes of Health.
References
- 1. Begley C, Beghi E, Beran R, et al. ILAE commission on the burden of epilepsy, subcommission on the economic burden of epilepsy: Final report 1998–2001. Epilepsia. 2002;43:668–673. [DOI] [PubMed] [Google Scholar]
- 2. Yoon D, Frick K, Carr D, Austin J. Economic impact of epilepsy in the United States. Epilepsia. 2009;50:2186–2191. [DOI] [PubMed] [Google Scholar]
- 3. Cascino G. Surgical treatment for epilepsy. Epilepsy Res. 2004;60:179–186. [DOI] [PubMed] [Google Scholar]
- 4. Uber‐Zak L, Blum D. Epilepsy surgery: Chance for a cure. Curr Neurol Neurosci Rep. 2001;1:376–380. [DOI] [PubMed] [Google Scholar]
- 5. Luders H, Comair Y. Epilepsy Surgery. Philadelphia: Lippincott Williams and Wikins; 2001. [Google Scholar]
- 6. Anderson A. 99mTc‐D, L‐hexamethylene‐propyleneamine oxime (99mTc‐HMPAO): Basic kinetic studies of a tracer of cerebral blood flow. Cerebrovasc Brain Metab Rev. 1989;1:288–318. [PubMed] [Google Scholar]
- 7. Devous MS, Leroy R, Homan R. Single photon emission computed tomography in epilespy. Semin Nucl Med. 1990;20:325–341. [DOI] [PubMed] [Google Scholar]
- 8. Walovitch R, Franceschi M, Picard M, et al. Metabolism of 99mTc‐l, l‐ethyl cysteinate dimer in healthy volunteers. Neuropharmacology. 1991;30:283–292. [DOI] [PubMed] [Google Scholar]
- 9. Walovitch RC, Cheesman EH, Maheu LJ, Hall KM. Studies of the retention mechanism of the brain perfusion imaging agent 99mTc‐bicisate (99mTc‐ECD). J Cereb Blood Flow Metan. 1994;(suppl. 1): S4–11. [PubMed] [Google Scholar]
- 10. Spanaki M, Spencer S, Corsi M, MacMullan J, Seibyl J, Zubal I. Sensitivity and specificity of quantitative difference SPECT analysis in seizure localization. J Nucl Med. 1999;40:730–736. [PubMed] [Google Scholar]
- 11. Duncan J. Imaging in the surgical treatment of epilepsy. Nat Rev Neurol. 2010;6:537–550. [DOI] [PubMed] [Google Scholar]
- 12. Duncan J, Winston G, Koepp M, Ourselin S. Brain imaging in the assessment for epilepsy surgery. Labcet Neurol. 2016;15:420–433. [DOI] [PMC free article] [PubMed] [Google Scholar]
- 13. Zubal I, Spencer S, Imam K, et al. Difference images calculated from ictal and interictal technetium‐99m‐HMPAO in temporal lobe epilepsy. J Nucl Med. 1995;32:1688–1694. [PubMed] [Google Scholar]
- 14. O'Brien TJ, So EL, Mullan BP, et al. Subtraction ictal SPECT co‐registered to MRI improves clinical usefulness of SPECT in localizing the surgical seizure focus. Neurology. 1998;50:445–454. [DOI] [PubMed] [Google Scholar]
- 15. Ouyang J, El Fakhri G, Moore SC. Fast Monte Carlo based joint iterative reconstruction for simultaneous 99mTc/123I SPECT imaging. Med Phys. 2007;34:3263–3272. [DOI] [PubMed] [Google Scholar]
- 16. Ouyang J, Zhu X, Trott CM, El Fakhri G. Quantitative simultaneous Tc‐99m/I‐123 cardiac SPECT using MC‐JOSEM quantitative simultaneous Tc‐99m/I‐123 cardiac SPECT using MC‐JOSEM. Med Phys. 2009;36:602–611. [DOI] [PMC free article] [PubMed] [Google Scholar]
- 17. Rakvongthai Y, El Fakhir G, Lim R, Bonab A, Ouyang J. Simultaneous 99mTc‐MDP/123I‐MIBG tumor imaging using SPECT‐CT: Phantom and constructed patient studies. Med Phys. 2013;40:102506. [DOI] [PMC free article] [PubMed] [Google Scholar]
- 18. Penny W, Friston K, Ashburner J, Kiebel S, Nichols T. Statistical Parametric Mapping: The Analysis of Functional Brain Images. London: Elsevier; 2006. [Google Scholar]
- 19. Swensson R. Unified measurement of observer performance in detecting and localizing target objects on images. Med Phys. 1996;23:1709–1725. [DOI] [PubMed] [Google Scholar]
- 20. Pareto D, Pavia J, Falcon C, Juvells I, Cot A, Ros D. Characterisation of fan‐beam collimators. Euro J Nucl Med. 2001;28:144–149. [DOI] [PubMed] [Google Scholar]
- 21. Malone I, Ansorge R, Williams G, Nestor P, Carpenter T, Fryer T. Attenuation correction methods suitable for brain imaging with a PET/MRI scanner: A comparison of tissue atlas and template attenuation map approaches. J Nucl Med. 2011;52:1142–1149. [DOI] [PubMed] [Google Scholar]
- 22. Kops ER, Herzog, H. Template‐based attenuation correction of PET in hybrid MR‐PET. J Nucl Med. 2008;49(suppl. 1):162P. [Google Scholar]


