Abstract
Purpose
Digital forward and back projectors play a significant role in iterative image reconstruction. The accuracy of the projector affects the quality of the reconstructed images. Digital breast tomosynthesis (DBT) often uses the ray‐tracing (RT) projector that ignores finite detector element size. This paper proposes a modified version of the separable footprint (SF) projector, called the segmented separable footprint (SG) projector, that calculates efficiently the Radon transform mean value over each detector element. The SG projector is specifically designed for DBT reconstruction because of the large height‐to‐width ratio of the voxels generally used in DBT. This study evaluates the effectiveness of the SG projector in reducing projection error and improving DBT reconstruction quality.
Methods
We quantitatively compared the projection error of the RT and the SG projector at different locations and their performance in regular and subpixel DBT reconstruction. Subpixel reconstructions used finer voxels in the imaged volume than the detector pixel size. Subpixel reconstruction with RT projector uses interpolated projection views as input to provide adequate coverage of the finer voxel grid with the traced rays. Subpixel reconstruction with the SG projector, however, uses the measured projection views without interpolation. We simulated DBT projections of a test phantom using CatSim (GE Global Research, Niskayuna, NY) under idealized imaging conditions without noise and blur, to analyze the effects of the projectors and subpixel reconstruction without other image degrading factors. The phantom contained an array of horizontal and vertical line pair patterns (1 to 9.5 line pairs/mm) and pairs of closely spaced spheres (diameters 0.053 to 0.5 mm) embedded at the mid‐plane of a 5‐cm‐thick breast tissue‐equivalent uniform volume. The images were reconstructed with regular simultaneous algebraic reconstruction technique (SART) and subpixel SART using different projectors. The resolution and contrast of the test objects in the reconstructed images and the computation times were compared under different reconstruction conditions.
Results
The SG projector reduced the projector error by 1 to 2 orders of magnitude at most locations. In the worst case, the SG projector still reduced the projection error by about 50%. In the DBT reconstructed slices parallel to the detector plane, the SG projector not only increased the contrast of the line pairs and spheres but also produced more smooth and continuous reconstructed images, whereas the discrete and sparse nature of the RT projector caused artifacts appearing as patterned noise. For subpixel reconstruction, the SG projector significantly increased object contrast and computation speed, especially for high subpixel ratios, compared with the RT projector implemented with accelerated Siddon's algorithm. The difference in the depth resolution among the projectors is negligible under the conditions studied. Our results also demonstrated that subpixel reconstruction can improve the spatial resolution of the reconstructed images, and can exceed the Nyquist limit of the detector under some conditions.
Conclusions
The SG projector was more accurate and faster than the RT projector. The SG projector also substantially reduced computation time and improved the image quality for the tomosynthesized images with and without subpixel reconstruction.
Keywords: digital breast tomosynthesis, digital projector, image quality, iterative image reconstruction, subpixel image reconstruction, super‐resolution
1. Introduction
Digital breast tomosynthesis (DBT) has been developed to reduce the overlapping tissue in mammography. In DBT, a sequence of x‐ray projections of a compressed breast is taken within a small angular range (11° − 60°). Tomosynthesized slices of the breast are generated by applying image reconstruction techniques to the projections, enabling radiologists to screen the breast slice by slice. Studies have shown that DBT can reduce both false‐negative diagnoses of breast cancer and false‐positive recalls compared to mammography alone.1, 2, 3, 4, 5, 6, 7, 8, 9
Forward and backward projections are required by iterative DBT reconstruction methods, such as the algebraic reconstruction technique (ART),10 the simultaneous algebraic reconstruction technique (SART),11 and the maximum likelihood expectation–maximization (MLEM) reconstruction technique.12 A better match between the digital implementation and the actual system physics can potentially improve the quality of reconstructed images in iterative reconstruction methods, as has been found in other 3D modalities.13, 14, 15, 16, 17, 18, 19, 20, 21
The function that generates the digital projection from a voxelized image is called a projector. For DBT reconstruction, the ray‐tracing (RT) projector is commonly used. This projector calculates the line integral along the ray from the source to the center of each detector element, ignoring the detector element size. With a discrete image volume, the integral becomes a summation that one can calculate efficiently with Siddon's method or its accelerated implementations.22, 23, 24
Considering the finite size of the detector element, a more accurate projection model is the average of x‐ray paths over the entire detector element.25 In cone‐beam CT, the separable footprint projector (SF projector) provides an efficient approximate implementation of this projection model.15 However, the separable approximation in the SF projector is inaccurate for the DBT geometry. Because of the small scan angle, DBT has limited depth resolution. The voxel dimension along the depth direction is usually set to be much longer than those parallel to the detector plane in DBT reconstruction. The approximation used in the SF projector is inadequate for DBT, especially at large projection angles. This paper presents a segmented separable footprint projector (SG projector), which is a modified version of the SF projector specially designed for the DBT geometry. To evaluate the performance of the SG projector, we compared the projection errors of the SG projector and the other projectors. In addition, we digitally simulated DBT projections of a phantom embedded with test objects without noise and blur, and compared the resolution and contrast in the images reconstructed with the different projectors. The projectors were also applied to subpixel reconstruction, in which the DBT volume is reconstructed with voxel sizes smaller than the detector element size. The quality of the test objects in the reconstructed DBT and the computational efficiency of the projectors were evaluated and compared at different subpixel ratios.
2. Methods
2.A. Derivation of the SF projector
To explain the key approximations in the SG projector, we first review the SF projector. This derivation is similar to that described by Long et al.15 except that the notations are changed to match the coordinates defined for a DBT system (Fig. 1). Let denote the 3D image to be reconstructed, i.e., a discrete array of x‐ray attenuation coefficient values, where corresponds to one voxel of the imaged volume. Let y i be the projection at the ith angle after logarithmic transformation of the measured photon intensity distribution at the detector. We use A i to denote the projector, e.g., , where denotes the index of the array of detector elements. Letting denote the grid spacing of the imaged volume, the continuous object corresponding to the discrete image array is
| (1) |
| (2) |
where is the basis function of a cuboid voxel and is the center of the nth voxel, and 1 denotes the indicator function.
Figure 1.
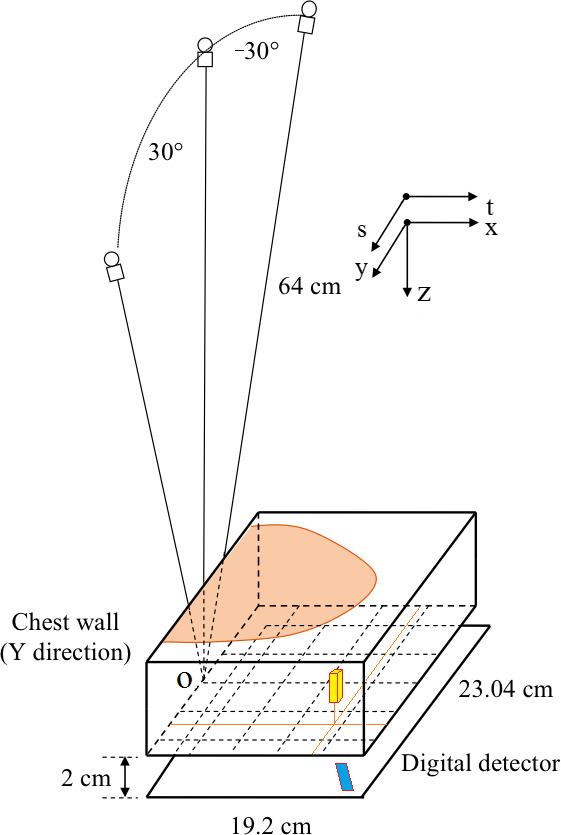
Geometry of the DBT system simulated in this study and the coordinate system. The origin of the coordinate system is located at the rotation center of the x‐ray tube and is indicated by “o”. The small vertical box in the imaged volume and the parallelogram on the detector plane illustrate the location of the voxel and its footprint, respectively, in the example shown in Fig. 2. [Colour figure can be viewed at wileyonlinelibrary.com]
Let denote the center of the th detector element. The ideal projection model assumes the projection value at a detector element to be the average of ray‐tracing result throughout the detector element:
| (3) |
where h(t,s) is the sensitivity response of the detector. The RT projector treats h(t,s) as a Dirac impulse () such that only one ray per detector element is traced with the Siddon algorithm or its accelerated versions. The sparse sampling of the rays through the imaged volume causes numerical errors and artifacts in the reconstructed images. The SF projector reduces the sampling errors by approximating the average of the ray paths over each voxel. p(t,s;i) is the continuous projection of at the ith angle:
| (4) |
where is the line from the source to the coordinate of the detector.
By combining these equations, we obtain the expression of an element of the system matrix:
| (5) |
where is a continuous function from a 2‐D convolution:
| (6) |
| (7) |
is the continuous projection function of the th voxel. We call this the ‘footprint’ of the th voxel. is the ‘blurred footprint’, blurred by the sensitivity response of the detector element. In summary, the value of is equal to the blurred footprint of the th voxel evaluated at the center of the th detector element.
As a 2‐D convolution, would be expensive to compute exactly. For typical cone‐beam CT geometries, the footprint function is approximately separable:15
| (8) |
where is a rect function and is a trapezoid function, both with unit amplitude. The amplitude function equals the maximum value of .
Assuming the detector pixel sensitivity response is uniform over each detector element, then we have:
| (9) |
and becomes the product of two 1‐D convolutions:
| (10) |
Where
| (11) |
| (12) |
To compute the 1‐D convolutions for and is much faster than a 2‐D convolution and can be used repeatedly in the implementation of the SF projector.
2.B. The SG approximation and the SG projector
Figure 1 describes the coordinate system of our DBT system. The origin of the coordinate system is at the rotation center of the x‐ray tube. In DBT, because of the small tomographic angle (11–60 degrees), the depth resolution along the z‐direction perpendicular to the detector plane is much lower than those on the detector (x‐y) plane.26 For example, a DBT system generally uses a digital mammography detector that has pixel pitch ranging from 0.07 × 0.07 mm2 to 0.1 × 0.1 mm2 for the commercial systems. The slice spacing (z‐dimension of a voxel) in the reconstructed imaged volume may be set to be 0.5 mm to 1 mm, while the x‐ and y‐dimensions of the voxel are set to be the same as the detector pixel pitch. The ratio of the z‐dimension and the x‐ and y‐dimension, i.e., the height‐to‐width ratio, of a voxel can be as large as 10:1. We use one voxel as an example to demonstrate why the SF approximation is inaccurate for a typical DBT geometry. This voxel is located at (x, y, z) = (160.05, 70.05, −10.5) mm, drawn approximately in Fig. 1. The distance from the center of this voxel to the bottom of the imaged volume is 10.5 mm. The analytical projection (footprint) of the voxel at the projection angle θ = − 30° is shown in Fig. 2(a). The long parallelogram‐shape footprint is apparently nonseparable. Fig. 2(e) shows the blurred separable footprint that obviously poorly approximates as shown in Fig. 2(d). Thus, the original SF projector does not help improve the accuracy of the projector in DBT application.
Figure 2.
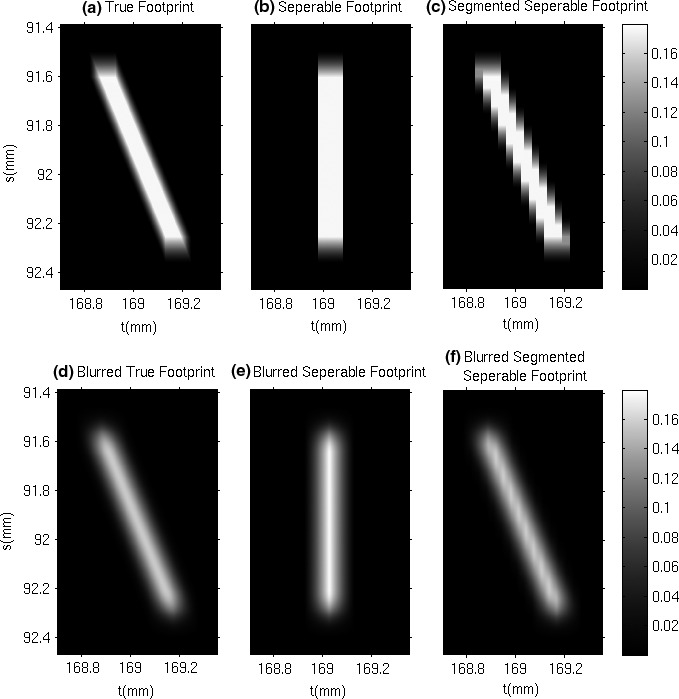
Separable footprint (SF) and segmented separable footprint (SG) approximation applied to a DBT image voxel located at (x, y, z) = (160.05, 70.05, −10.5) mm at projection angle θ = − 30°. All images share the same color bar, t‐ and s‐coordinate.
The parallelogram‐shape of the footprint results from the shape of the voxel in DBT system. This problem increases with increasing projection angles. To deal with the shape of voxels in DBT, we propose a ‘segmented separable footprint’ (SG) approximation: we equally divide each voxel along the z‐direction into several segments, apply SF approximation to each segment, and sum the footprints of each segment. Figure 2(c) shows the summed footprint with 10 segments. Although Fig. 2(c) still differs from Fig. 2(a), the difference becomes much less noticeable after blurring [(Figs. 2(d) and 2(f)]). As the value of depends only on the blurred footprint , the error in the nonblurred footprint only slightly affects the accuracy of the projector. The proposed projector based on the SG approximation is referred to as the SG projector in the following.
The accuracy of the SG method depends on the number of segments used. More segments will improve projection accuracy at the expense of longer computation time. The memory cost of the SG projector does not depend on the number of segments and is negligible compared to the memory that is needed for the reconstructed volume. The proper number of segments depends on the height‐to‐width ratio of the voxels used in the reconstruction, and on the tomographic scan angle of the DBT system.
The accuracy of the projector also depends on the choice of the form of . We used a rect function as in our implementation. Using a trapezoid function would further improve the similarity between Figs. 2(d) and 2(f) and reduce the projection error. This approach is called the trapezoid‐trapezoid (TT) method.15 However, the decrease in the projection error is very small and the trapezoid increases the computation time by a factor of about 2.6 times. We consider this extra computation time not worth the slight improvement in projection accuracy and use the rect function for the SG projector in the current study.
2.C. Subpixel DBT reconstruction
The SG projector not only provides a more accurate projection result than RT but also makes subpixel DBT reconstruction more efficient. The in‐plane voxel dimensions of the imaged volume in DBT reconstruction are commonly set to be the same as the detector pixel dimensions along the t‐ and s‐direction. Studies have shown that, by interpolating the projection views and using a finer voxel grid, one can reconstruct higher resolution images with better image quality.27, 28 That approach is called subpixel reconstruction or super‐resolution reconstruction. For example, assuming the original detector pixel size to be 0.1 × 0.1 mm2, we can interpolate each pixel into four 0.05 × 0.05 mm2 subpixels. Using a 1‐mm slice interval, the interpolated projections can be used to reconstruct an imaged volume with a 0.05 × 0.05 × 1 mm3 voxel size. With subpixel reconstruction, super‐resolution can be observed in the reconstructed image slices with frequency exceeding the Nyquist limit of the detector pixels.
In the method described above, interpolation of the projections is inevitable when one uses the RT projector. The RT back projector contributes only to voxels that intersect the line from the source to the center of each detector pixel. If one attempted subpixel reconstruction with noninterpolated projections, many voxels would not obtain any back‐projected value due to the small voxel size compared with the pixels of the detector along the in‐plane direction. This would create a lot of gap artifacts on the reconstructed slices.
The SG projector overcomes this problem in subpixel DBT reconstruction. We need not interpolate the projections as back projection of each detector pixel will affect all voxels that intersect with the cone subtended at the source by the detector pixel. Thus, the SG projector effectively covers all voxels in the imaged volume, improves the estimate of the x‐ray paths through the voxels while saves computation time by avoiding interpolation and working with only the original detector pixel values in the projections. In this study, we applied both the RT and the SG projector to subpixel DBT reconstruction and compared the results qualitatively and quantitatively.
3. Materials
3.A. Geometry of the DBT system
We use a second‐generation prototype digital tomosynthesis system (GE Global Research, Niskayuna, NY, USA) as an example in this study. The imaging geometry of the DBT system is shown in Fig. 1. The origin (x, y, z) = (0, 0, 0) is the rotation center of the x‐ray tube and (t, s) = (0, 0) is the perpendicular projection of the origin on the detector. The x‐ray source rotates in 3° increments to acquire 21 projection images within ± 30°. The digital detector is stationary during the acquisition. The matrix size of the detector is 1920 × 2304, and the pixel pitch is 0.1 × 0.1 mm2. The distance from the source to the rotation center is 64 cm. There is a 2 cm gap between the imaged volume and the digital detector. Different DBT systems may have different geometry (e.g., scan angle, angular increments) but the projector developed in this work is applicable to other geometries.
3.B. Simulation of the projections for the digital phantom
We generated a digital phantom using the CatSim simulation program29, 30 to study different projectors and subpixel image reconstruction. We configured the x‐ray system in the CatSim simulation to match the geometry of the experimental system shown in Fig. 1. The x‐ray source was an Rh target/Rh filter x‐ray tube and the peak voltage was set to 29 kV. The oversampling rate of the detector along t‐ and s‐directions was 20 to simulate the projection of an analog object being imaged. A complete set of simulated projections contains 21 projections every 3° from −30° to +30°, with a detector pixel pitch of 0.1 × 0.1 mm2 and an image size of 1920 × 2304 pixels, corresponding to the experimental DBT system. CatSim was designed for CT simulation, where the detector rotates with the source. As our DBT system has a stationary detector, we did not use the rotation option in CatSim and only simulated one projection with one configuration file at a time. The x‐ray focal spot was assumed to be a point source; we also turned off the quantum noise, detector noise, and scattered radiation in the simulation so that we can focus on the investigation of the effects of the projector on the spatial resolution of DBT reconstruction.
The geometric features of the digital phantom are analytically specified in a configuration file using the FORBILD syntax.30 The background material is set to 5‐cm‐thick breast tissue, based on data from ICRU report 46.31 The phantom contains 15 sets of objects. The distance from each object to the bottom of the imaged volume is the same, which is 25.6 mm. As a result, all objects are located on the same slice, as shown in Fig. 3. Each set contains two small lead spheres (BBs) and two sets of line pairs along x‐ and y‐direction with the same spatial frequency. Each group of line pairs is composed of five lead bars and four spacings, i.e., 4.5 line pairs, with the width of the lead bar same as the width of the spacing. The group of horizontal line pairs and the group of vertical lines are offset in the x‐direction so that the in‐plane reconstruction artifacts from one group will not affect the other group. The diameter of the BBs is the same as the width of one bar in the line pairs and the center‐to‐center spacing of the two spheres is equal to one line pair. The two spheres are arranged along a 45° line relative to the pixel grid. The pairs of BBs are included to demonstrate the spatial resolution for small objects under various reconstruction conditions, at a representative angle (e.g., diagonal) to the voxel grid, which combines the effect of the spatial resolutions in the x‐ and y‐directions. Table 1 shows the line pair frequency and the sizes of the individual bars and spheres. The y‐direction distance between the centers of two sets of line pairs or BBs is 32 mm, which is chosen to minimize the y‐direction in‐plane reconstruction artifacts from two sets of line pairs or BBs to affect each other while keeping the entire phantom area to be small enough to be covered by the reconstruction matrix at high resolution (see below). The material of all line pairs and BBs is pure lead (Pb). The thickness of all line pairs is set to be 0.03 mm, similar to the thickness of commercial lead line pair phantoms for testing spatial resolution of mammography systems (e.g., Fluke Medical). The z‐direction location of all objects is 0.6 mm from the lower boundary of the slice if the reconstruction uses a 1‐mm slice interval. We chose this instead of 0.5 mm because we used half of the original slice interval in one set of the subpixel reconstruction; objects located right at the center of the original slice will be split into two slices, which would be difficult to analyze.
Figure 3.
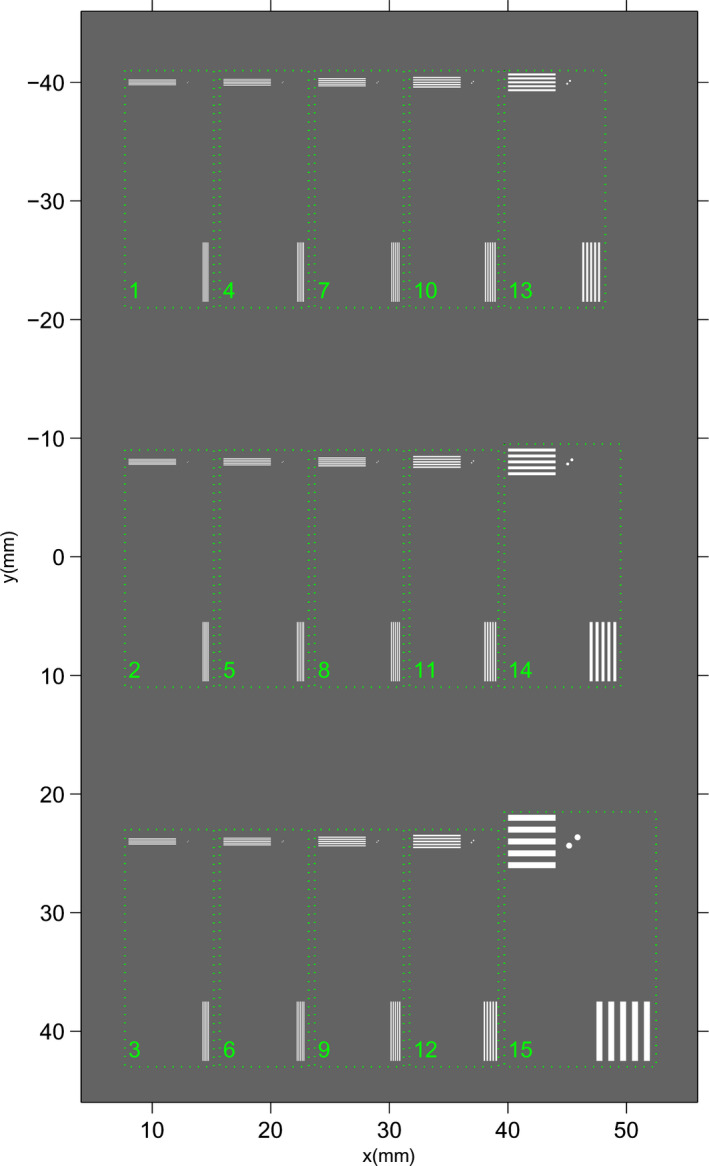
Setup of a digitally generated resolution phantom. Each set (marked by box) contains three types of objects: horizontal line pairs, vertical line pairs, and two lead spheres (BBs). The sizes of all objects are shown in Table 1. [Colour figure can be viewed at wileyonlinelibrary.com]
Table 1.
Object sizes (mm) in the digital phantom. The object set number corresponds to the number next to each box in Fig. 3. The center‐to‐center distance between the two BBs in a pair is equal to the BB diameter
| Object set number | 1 | 4 | 7 | 10 | 13 |
|---|---|---|---|---|---|
| Line pairs/mm | 9.5 | 8.0 | 6.5 | 5.0 | 3.0 |
| Line or space width | 0.053 | 0.063 | 0.077 | 0.100 | 0.167 |
| BB diameter | 0.053 | 0.063 | 0.077 | 0.100 | 0.167 |
| Object set number | 2 | 5 | 8 | 11 | 14 |
|---|---|---|---|---|---|
| Line pairs/mm | 9.0 | 7.5 | 6.0 | 4.5 | 2.0 |
| Line or space width | 0.056 | 0.067 | 0.083 | 0.111 | 0.250 |
| BB diameter | 0.056 | 0.067 | 0.083 | 0.111 | 0.250 |
| Object set number | 3 | 6 | 9 | 12 | 15 |
|---|---|---|---|---|---|
| Line pairs/mm | 8.5 | 7.0 | 5.5 | 4.0 | 1.0 |
| Line or space width | 0.059 | 0.071 | 0.091 | 0.125 | 0.500 |
| BB diameter | 0.059 | 0.071 | 0.091 | 0.125 | 0.500 |
The alignment of the objects to the pixel grid will affect the resolution and contrast of the reconstructed objects, especially for objects of sizes close to the pixel size. The alignment affects the different objects in the phantom to different degrees because of their different locations relative to the pixel grid. To compare different reconstruction methods, it is more useful to study the “average” effect when objects are imaged by a DBT system without knowledge of their alignment to the pixel grid, as in actual situation. We simulated this average effect by generating projections with the test patterns placed at 25 locations with respect to the pixel grid and the results were averaged over the different alignments as described in Section Conclusions.C.1. We shifted the locations of the entire array of phantom objects by 1/5 pixel (0.02 mm), 2/5 pixel (0.04 mm), 3/5 pixel (0.06 mm), and 4/5 pixel (0.08 mm) along both x‐ and y‐direction. At each phantom location, a set of DBT projections (21 projections in 3° increments, 60° total scan angle) was simulated so that a total of 25 sets of projections were generated for reconstruction. We denote the 25 alignment locations by a ‘shift tag’ Ld x d y , where d x and d y are both integers. For example, the shift tag ‘L23’ (d x = 2, d y = 3) means the shift along x‐direction was 2/5 pixel and the shift along y‐direction was 3/5 pixel. The shift tag ‘L00’ represents the nonshifted projections. The simulation of all projections angles for all 25 shifted locations took about 1 week to complete.
3.C. Reconstruction method and the subpixel tag
We used the simultaneous algebraic reconstruction technique (SART)11 for both the original and subpixel reconstructions in this study. SART converges to a geometrically weighted least squares solution32 and is a reliable technique for DBT reconstruction.33 Artifact reduction algorithms previously developed in our laboratory were also used.34, 35 The simulated DBT used 21 projections so that each SART iteration consisted of 21 updates. The SART reconstruction was initialized with a uniform imaged volume with zero values.
We used the subpixel tag ‘xyαzβ’ to denote the subpixel ratio of a reconstruction, with α being the subpixel ratio along the x‐ and y‐directions and β being the subpixel ratio along the z‐direction. For a reconstruction at the subpixel ratio xyαzβ, each 0.1 × 0.1 × 1.0 mm3 voxel was divided into α 2 β of voxels. The matrix size of the voxel grid of the reconstructed imaged volume increases by a factor of α 2 β for subpixel reconstruction.
We used the following six subpixel ratios: xy1z1, xy2z1, xy3z1, xy1z2, xy2z2, and xy3z2 in this study. xy1z1 denotes the regular reconstruction. When reconstructing with an xy‐ratio larger than one with the RT projector, the input projections were interpolated to the same xy‐ratio using 2‐D bilinear interpolation. For the SG projector, the noninterpolated projections were used as input. To demonstrate the effect of the new SG projector, we also reconstructed all subpixel ratios with the original SF projector. In summary, with 25 shift locations of the phantom, 6 subpixel ratios, and 3 different projectors, there were a total of 450 image reconstructions.
For the SG projector, the proper number of segments depends on the shapes of the voxel and its projection to the detector plane. For narrower voxels, more segments are necessary to make a good approximation of the blurred footprint of each voxel. According to our initial experimentation with different number of segments, for our DBT system where the detector pixel pitch is 0.1 × 0.1 mm2 and the maximum projection angle is ± 30°, at a reconstructed slice interval of 1 mm, we found that five or six segments, i.e., a voxel height‐to‐width ratio of about 2:1 to 1.7:1, are sufficient. We chose to use six segments for two reasons: (a) an even number of segments for the xy1z1 case yields an integer value in the number of segments for cases with z2, and (b) to maintain the same height‐to‐width ratio of the segments and therefore similar accuracy of the SG projector for all subpixel ratios studied. For example, three segments were used for xy1z2 and six segments for xy1z1. For the subpixel ratio of xy2z1, 12 segments were used because each voxel is half the size of that of xy1z1 in the x‐ and y‐dimension. Figure 4 shows the relative sizes of one voxel for xy1z1, xy2z1, and xy1z2.
Figure 4.
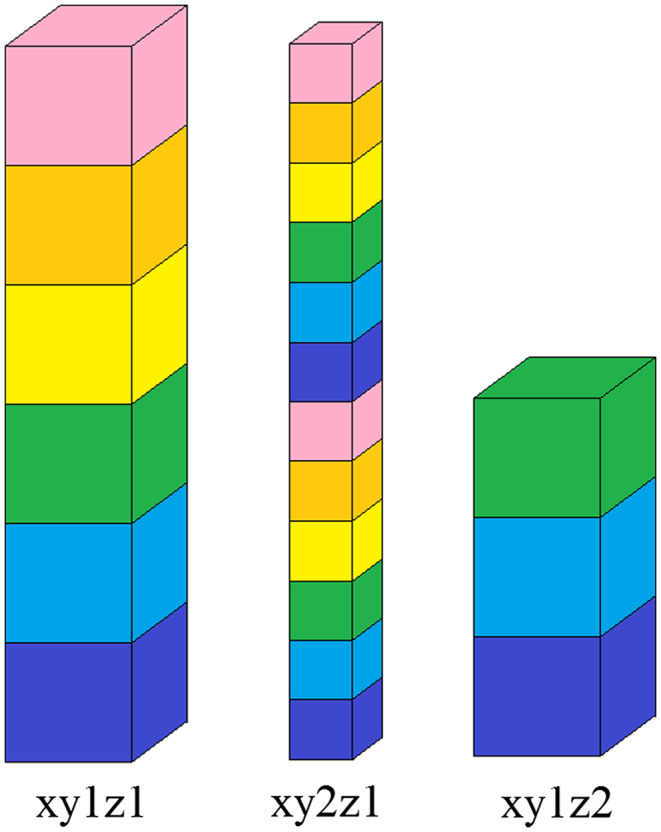
Relative voxel sizes and segments for xy1z1, xy2z1, and xy1z2 subpixel ratios. Each voxel was cut into 6, 12, and 3 segments to maintain the same height‐to‐width ratio. [Colour figure can be viewed at wileyonlinelibrary.com]
4. Results and discussions
4.A. Accuracy of projection
4.A.1. Comparison of projections of single voxels
To illustrate the difference in the projectors, we compared the projection generated by the three different projectors (RT, SF, and SG) when there was only one non‐zero voxel in the imaged volume. We set the non‐zero voxel value to 1. This was equivalent to comparing one column of the system matrix A i . The projections generated by the digital projectors were compared with the ideal projection. To simulate the ideal projection, we divided each detector element into a 20 × 20 mini‐pixels in a Cartesian grid, calculated the projection value at the center of each mini‐pixel, and then calculated the average of the 400 mini‐pixels as an approximation of the surface integral over the detector element. The projected location of a given voxel was calculated analytically and the ideal projection was only calculated within a small region. The calculation of the ideal projection for a full‐sized detector would take more than 1 hour, which is too slow to be used in iterative image reconstruction in practice.
Figures 5 and 6 show the projections of the single voxel in the imaged volume with the ideal projector, RT, SF, and SG at projection angle θ = −30°. The root‐mean‐square errors (RMSE) of RT, SF, and SG relative to the ideal projection were given at the top of the figures. Visually, the pattern generated by the SG projector is much more similar to the ideal projection compared with the RT projector. Compared with the ideal projection, the RT projection is narrower and values at several pixels are missing because the analytical footprint does not cover the centers of those detector elements, i.e., the ray path between the focal spot and the center of each of these detector elements does not intersect the voxel. When reconstructing small objects such as subtle microcalcifications, the narrower projections by the RT projector might cause the reconstructed objects to be more blurred. Quantitatively, the SG projector reduces the RMSE by 96.4% and 62.6% at the two locations, respectively, compared with the RT projector. The projections generated by the original SF projector are also shown in Figs. 5 and 6. These projections appear symmetric in the s‐direction due to the SF approximation, which is inaccurate in DBT as seen from the ideal projection.
Figure 5.
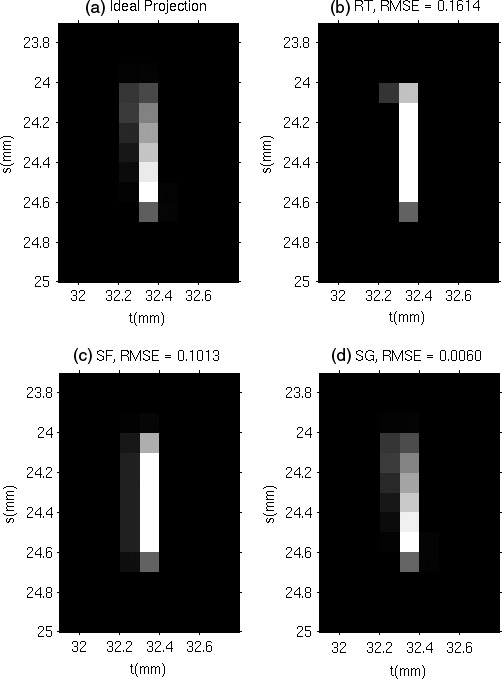
Projection of a single voxel located at (30.05, 0.05, −19.5) mm at projection angle θ = −30°.
Figure 6.
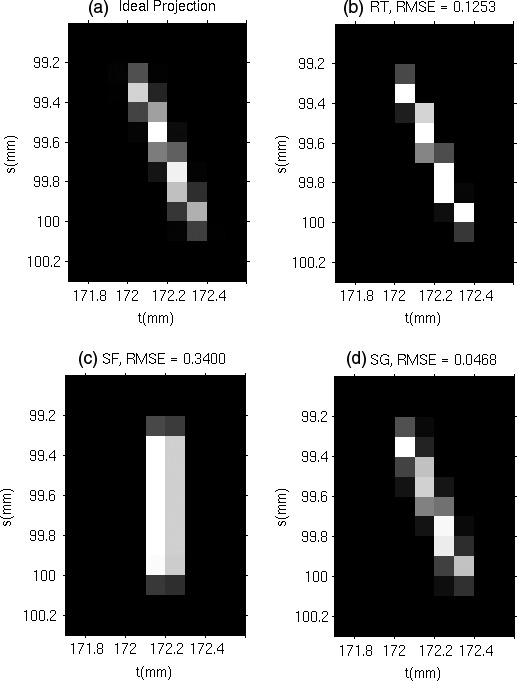
Projection of a single voxel located at (160.05, 70.05, −19.5) mm. at projection angle θ = −30°.
The difference between the projectors depends strongly on the voxel location in the imaged volume and the source angle. Generally, the difference is greater when the angle between the z‐direction and the ray from the source to the center of the voxel is larger. In the two examples in Figs. 5 and 6, the source angle of the projection was −30°. Figure 6 shows a voxel located near the edge of the field of view of the detector so that it represents an extreme case where the voxel is projected at almost the largest angle in the entire imaged volume. Figure 5 shows a voxel essentially at the central ray of the projection.
4.A.2. Error map for voxels at different locations
In addition to the single voxel examples shown in the previous section, we investigated the distribution of the RMSE for voxels over one slice of the imaged volume at different projection angles to further evaluate the accuracy of the SG projector. We chose the slice at z = −29.5 mm as an example. The distributions of RMSE, relative to the ideal projector, over the 1920 × 2304 voxels on this slice at projection angles θ = 0° and θ = −30° are shown in Fig. 7. The projection error of a given voxel depends strongly on the alignment of the projection with the detector pixels, which leads to periodic patterns in the error maps. Figure 7 has been filtered with a 7 × 7 sliding maximum window to reduce the periodic pattern, representing the maximum error within a 0.7 × 0.7 mm2 patch centered at each pixel.
Figure 7.
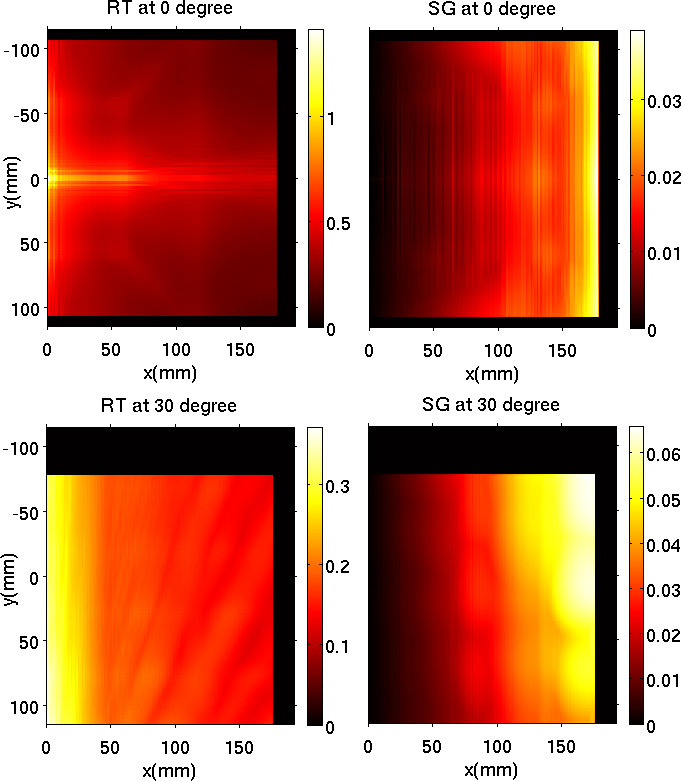
RMSE map of the RT (left column) and the SG (right column) projectors, relative to the ideal projection, of voxels on a slice of the imaged volume at z = −29.5 mm. The upper row shows the maps at projection angle θ = 0°, and the lower row shows the maps at θ = −30°. Note the difference in the scale of the heat maps. [Colour figure can be viewed at wileyonlinelibrary.com]
The error map is black near the top, bottom, and right boundaries, representing an RMSE of 0. Due to the diverging x‐ray beam, the projection of voxels in this region was already outside the field of view of the detector; the projected voxels were ignored so that both the ideal projection and the projection by SG or RT were set to zero. For the area where the RMSE is non‐zero, the SG projector reduces the projection error by 1 to 2 orders of magnitude at most locations, especially for the projection angle θ = 0°. Generally, the error of the RT projector is larger when the area of the analytical projection of a voxel is smaller, making it more likely to miss larger fraction of pixel values. For θ = 0° (upper row of Fig. 7), the minimum non‐zero value of the RT RMSE map (the upper right corner) is 0.1543, and the maximum value of the SG RMSE map (middle point of the right edge) is 0.0386. For θ = −30° (lower row of Fig. 7), the minimum non‐zero value of RT (the upper right corner) is 0.1254, and the maximum value of the SG error map (the upper right corner) is 0.0643. Therefore, even in the worst case, the SG projector still provides a much more accurate projection.
As shown in the DBT imaging geometry (Fig. 1), the center of the cone beam is centered at the chest wall of the compressed breast, which corresponds to the left boundary of the error maps shown in Fig. 7. The right side of the DBT slice (anterior of breast) where the x‐ray incident angle is large is usually outside the breast volume unless the compressed breast is very large. The relatively large RMSE of the SG projector near the right boundary is therefore less problematic. On the contrary, the error maps of the RT projector show larger RMSE on the left side (chest wall) where the main breast volume is located, introducing errors into the reconstructed DBT for all breast sizes.
4.B. Comparison of reconstructed images
To study the effects of the projectors on the DBT image quality, we first made a qualitative comparison of the reconstructed images using different projectors at several subpixel ratios. As an example, the images reconstructed from the projections with the phantom location at L00 are shown. Figure 8 shows the in‐focus slice (centered at z = −25.5 mm) reconstructed with the SG projector at the original voxel size. Detailed analysis is discussed below.
Figure 8.

The in‐focus slice (centered at z = −25.5 mm) of the line pair phantom (L00, xy1z1, 5 SART iterations with the SG projector). In‐plane artifacts are seen as shadows above and below the objects.
An example to illustrate the difference in the image quality for different projectors is shown in the zoomed image patches in Fig. 9. From left to right, we replaced the RT projector with the SG projector and replaced the regular reconstruction with the subpixel reconstruction. The spatial resolution dramatically improves after each replacement. The test pattern shown has 6 line pairs/mm, which is higher than the Nyquist limit of the detector (5 cycles/mm). In the xy1z1 reconstructions, aliasing can be seen clearly; although the line pairs appear resolved in the image, it contains only 3 and a half line pairs, while the object actually contains 4 and a half line pairs (five bright lines and four dark lines). The xy3z2 reconstructions clearly resolve all the line pairs. The difference between the SG and RT projectors are also well demonstrated; the SG projector provides higher contrast line pair images in both directions compared to the RT projector. In addition, although the simulated projections are noiseless, the RT images appear ‘noisy’, especially for the horizontal line pairs. The ‘noise’ shows regular periodic pattern, indicating it is actually periodic numerical error rather than random noise. One possible reason may be that the discrete and sparse rays being traced through the voxel grid in the RT projector causes periodic sampling errors in the projected values. The images of the BBs further demonstrate the increased resolution of the subpixel reconstruction. The BBs are well resolved in the xy3z2 reconstruction but they become neighboring voxels in the xy1z1 reconstruction. The BBs are also more blurred by the RT projector than the SG projector. This observation is similar to that of a previous study by our laboratory.27 Generally, the subpixel reconstruction provides better image quality among the conditions studied. However, the improved resolution is gained at the expense of longer computation time and more memory as well as storage space. The SG projector is more efficient than the RT projector so that the increase in the computation time is less dramatic.
Figure 9.
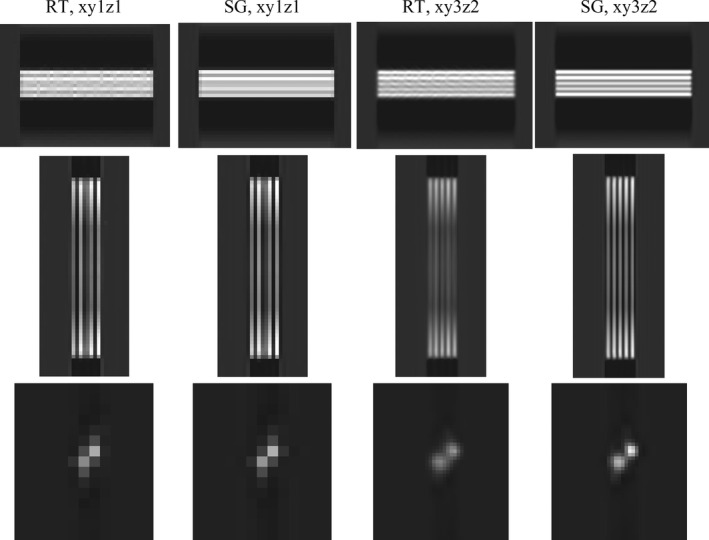
Object set #8 (see Figs. 3, 8, Table 1) reconstructed with RT or SG projector with subpixel ratios of ‘xy1z1’ and ‘xy3z2’. All line pair images are shown with the same window setting. All BB images also share the same window setting (different from that of the line pairs). Line pair frequency = 6 line pairs/mm. BB diameter = 0.083 mm. detector pixel pitch = 0.1 mm and Nyquist frequency = 5 cycles/mm, SART iterations = 5. Note that the line pairs are not correctly resolved in the xy1z1 reconstructions while both the line pairs and the BBs are well resolved in the xy3z2 reconstructions.
4.C. Quantitative analysis of subpixel image reconstruction
4.C.1. Figures of merit
To evaluate quantitatively the performance of the SG projector and the subpixel reconstruction, we defined figures of merit based on the reconstructed line pairs and BBs. We first obtained the profiles of different objects. For each set of line pairs, we extracted nine profiles at the central part of the line pairs and took the average. For BB, we only extracted one profile through the line that passed through the centers of the two spheres. The profiles were calculated from the analytical locations of the objects as defined in the configuration of the phantom. These “true” locations do not change when we perform subpixel reconstructions. A profile was obtained by bilinear interpolation from the reconstructed values at the voxel grid points on the in‐focus slice. For each set of line pairs, one profile contained 81 sampling points, while for each BB, one profile contained 51 sampling points. The sampling distance was reduced as the line pair frequency increased to allow for adequate sampling of the peaks and valleys of the profiles. The actual length of the profiles was therefore inversely proportional to the spatial frequency but always covered the entire set of line pairs or the two BBs.
After extracting the profile, we used automatic peak detection to identify peaks and valleys of the profile as shown in Fig. 10. For each set of line pairs, the numbers of detected peaks and valleys were counted. If five peaks and four valleys were detected, the contrast was calculated as the difference between the mean peak value and the mean valley value, normalized to the contrast value of the line pairs in the voxelized image of the analytical phantom, which had the same constant value for all line pair frequencies. If less than five peaks were detected, the line pairs was considered to be nonresolvable and the contrast of the line pairs was assigned 0. The two plots in the first row of Fig. 10 show examples of these two situations.
Figure 10.
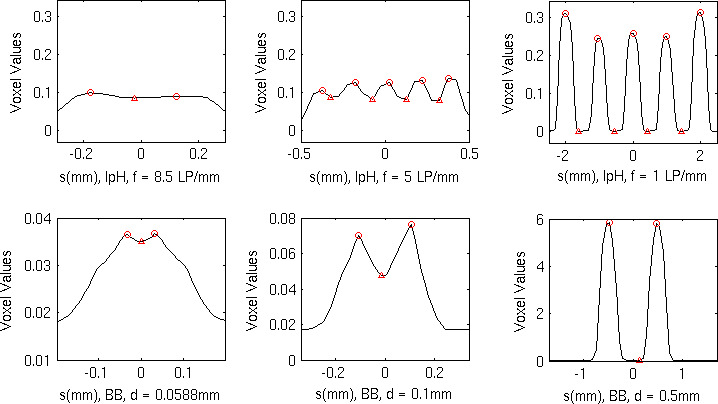
Examples of peak detections (L00, RT projector, subpixel ratio xy2z2). The circles mark the detected peaks and the triangles mark the detected valleys. Fewer than five peaks are detected at the frequency f = 8.5 line pairs/mm, indicating that the line pairs are nonresolvable. lpH = horizontal line pairs, f = frequency, LP = line pairs, d = diameter. The profiles of the vertical line pairs are analyzed similarly but not shown. [Colour figure can be viewed at wileyonlinelibrary.com]
For the BB profiles, similarly, if less than two peaks were detected the contrast was considered to be 0. If two peaks and one valley were detected, we used the following equation to define the relative contrast of the BB:
| (13) |
where p 1 and p 2 are the values at two peaks, v is the value at the valley and b is the background voxel value. The relative contrast instead of the absolute contrast is used because BBs with different diameters have different thicknesses along the z‐direction. For BBs located entirely within a single reconstructed slice (diameter < slice interval), the highest voxel values of the BBs are approximately proportional to their diameters. Even if the reconstruction is ideal (exactly matches the voxelized ground truth), there are large differences between the absolute contrasts of BBs of different diameters, making the contrast‐versus‐diameter curve less meaningful. On the contrary, the relative contrast of ideally reconstructed BBs will always be 1, so it better describes whether the two BBs can be resolved. When the two peaks are not equal, we use the larger one of the two peaks in the denominator to be conservative in estimating the relative contrast. For simplicity, the relative contrast is simply referred to as “contrast” in the following discussion.
The contrasts of line pairs and BBs were computed for all 25 shifted locations of the imaged objects. When the object was shifted, we shifted the starting point and ending point of profiles by the same value to make sure that all profiles represented features of the objects at the same location. Figure 11 shows an example comparing the SG and RT projectors when the subpixel ratio was fixed at xy3z2. The variation of the contrasts of the line pairs and BBs is very large at the different alignment of the spheres with the voxel grid, especially for the mid‐frequency line pairs and small spheres. However, for a given shift location, the SG projector always gives better contrast than the RT projector. As a result, the mean contrast over all shifted locations can be used to represent the trend when the objects are imaged at random locations by the DBT system.
Figure 11.

The dependence of the contrast on the frequency of line pairs and the diameter of BBs for three shifted locations. The RT projector is compared with the SG projector at a given subpixel ratio (xy3z2). [Colour figure can be viewed at wileyonlinelibrary.com]
For the horizontal (or vertical) line pair objects, only 5 of the 25 shifted locations produces different measurements of contrast values because the objects are parallel to the vertical (or horizontal) direction. The mean contrasts were obtained by averaging the five values from the shifted locations perpendicular to the line pairs. For the BBs, the contrasts at all 25 shifted locations were used for the estimate of the mean. The mean contrast will be used in the following discussions unless it is specified otherwise.
4.C.2. Dependence on the number of iterations
We first analyzed the dependence of the mean contrast on the number of iterations. Figure 12 shows the contrast‐versus‐line pair frequency curves of xy1z1 reconstructed with the SG projector. The trends shown in Fig. 12 are similar for reconstruction with other projectors. The contrasts of the objects generally increase with increasing number of iterations. The only exception is the vertical line pairs, where the contrast after one iteration is higher than that after two iterations for the lowest two frequencies. It can be seen that the increase in contrasts leveled off when we performed more iterations, representing convergence of the SART reconstruction.32
Figure 12.

Dependence of mean contrast on number of iterations. All reconstructions used SART with the SG projector and xy1z1. Left: horizontal line pairs. Middle: vertical line pairs. Right: BBs. [Colour figure can be viewed at wileyonlinelibrary.com]
In the reconstruction of clinical DBT images, the number of iterations needed may depend on the reconstruction method and the imaging techniques used, as well as the acquisition geometry (total scan angle, number of projections, and angular increments) of the DBT system. In this study, we chose to use five iterations for SART in the following discussions. We expect that the relative trends observed would not change after the reconstruction reaches relatively stable levels.
4.C.3. Dependence on the subpixel ratio
Figure 13 shows the mean contrasts of the line pairs and spherical objects at different subpixel ratios for the projector (SG). The contrasts of the line pairs were averaged over five shifted locations of the phantom, while the contrasts of the BBs were average over 25 shifted locations of the phantom, as explained above. Similar trends can be observed with the RT projector. When the z‐ratio is fixed and a higher xy‐ratio is used (first row of Fig. 13), a higher contrast is achieved for the three types of objects. The Nyquist frequency of the detector is 5 line pairs/mm. Without the subpixel reconstruction, it is difficult to differentiate line pairs with higher frequencies due to aliasing. After increasing the xy‐ratio from 1 to 2, the contrasts increase dramatically for the vertical line pairs, especially for frequencies higher than 5 line pairs/mm. The vertical line pairs with a frequency higher than or equal to 6 line pairs/mm become resolvable with the subpixel reconstruction. For the horizontal line pairs, however, they are still nondifferentiable at frequencies higher than or equal to 6 line pairs/mm even with a higher xy‐ratio. This is because that the DBT reconstruction artifacts spread along the vertical direction (y‐direction) and subpixel reconstruction cannot alleviate this problem. The two BBs can be resolved down to the smallest diameter and spacing (0.053 mm) included in this study, which is smaller than the pixel size of the detector and Nyquist limit. When the xy‐ratio is increased from 2 to 3, the improvement in the contrasts of the objects is relatively small.
Figure 13.
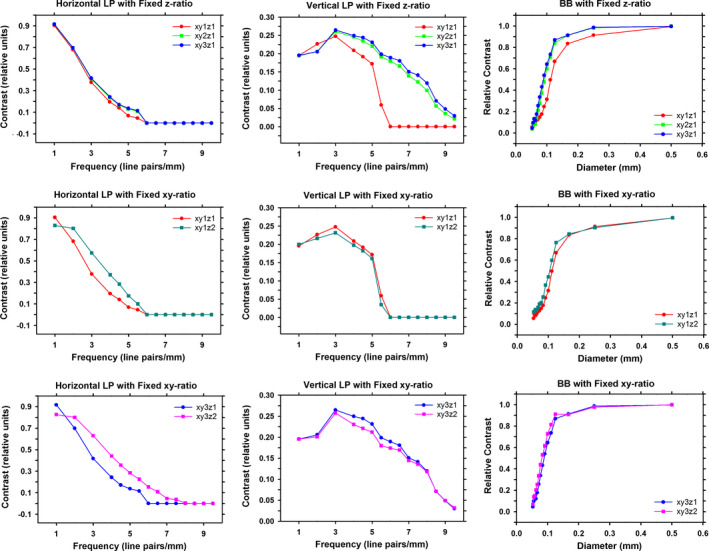
Dependence of mean contrast on subpixel ratios. All reconstructions used SART with the SG projector and five iterations. Left column: horizontal line pairs. Middle column: vertical line pairs. Right column: BBs. Upper row: subpixel ratios of xy1z1, xy2z1, xy3z1. Middle row: subpixel ratios of xy1z1, xy1z2. Lower row: subpixel ratios of xy3z1, xy3z2. [Colour figure can be viewed at wileyonlinelibrary.com]
The different observations for the horizontal and vertical line pairs indicate that the DBT system has different frequency response along the x and y‐direction. However, the difference should be less in DBT of human breasts because the in‐plane reconstruction artifacts for lower contrast tissues will not be as strong as that of the lead line pair patterns, and the artifacts due to dense calcifications or metal biopsy clips can be corrected to reduce their influence on the visibility of other features in the image.36, 37
When the xy‐ratio is fixed at 1 and the z‐ratio is increased from 1 to 2 (second row of Fig. 13), the contrasts of horizontal line pairs and BBs increase. The increase in the contrasts of BBs is similar to what we observed in our previous study.27 The exception is the vertical line pairs, where a z‐ratio of 2 appears to reduce the contrasts. The reason is the different locations of the line pairs relative to the voxel along the z‐direction. As mentioned in the Section Results, we placed the line pair objects at a depth of 25.6 mm from the bottom of the imaged volume. At the reconstruction with a z‐ratio of 1 (i.e., slice interval of 1 mm), the line pair objects were contained well within the slice between 25.0 and 26.0 mm. When the z‐ratio was set to be 2, the slice interval was reduced to 0.5 mm, the location of the line pairs was only 0.1 mm from the boundary of the subvoxels along the z‐direction, which was 20% of the slice interval. Part of the contrast of the line pairs leaked into the neighboring slices. It is impossible to set up a phantom where the objects are located at the center of a voxel along the z‐direction for all z‐ratios studied. If we set up two phantoms where the objects are located at the center of the focal slice (along the z‐direction) for both z‐ratios of 1 and 2, the difference in the contrasts for the z‐ratio = 1 and z‐ratio = 2 conditions would likely be smaller and not reversed. However, such an approach would change the premise of the study that the available DBT projections are the same and only the projectors and subpixel ratios are changed. The third row of Fig. 13 shows the change in contrasts when the xy‐ratio is fixed at 3 and the z‐ratio increases from 1 to 2. For the horizontal line pairs, several of the line pairs with spatial frequency higher than 5 line pairs/mm become differentiable when a larger z‐ratio is used, as observed in Fig. 9.
4.C.4. Dependence on the projector type
Figure 14 shows the dependence of the contrasts of line pairs and BBs on the projector. The SG projector outperforms the RT and the SF projector under most conditions. However, the advantage of using the SG projector also depends on the type of the objects, the subpixel ratio and the number of iterations. With the subpixel ratio of xy1z1 (first column of Fig. 14), the increase in contrast for the SG projector is not obvious, except for the vertical line pairs. A possible reason is that the in‐plane “shadow” artifact of DBT due to the limited scan angle is a dominant factor on the contrast of the horizontal line pairs, which masks the differences of the projectors. For the vertical line pairs, the SG projector shows the advantage of a more accurate system model using the SG projector.
Figure 14.
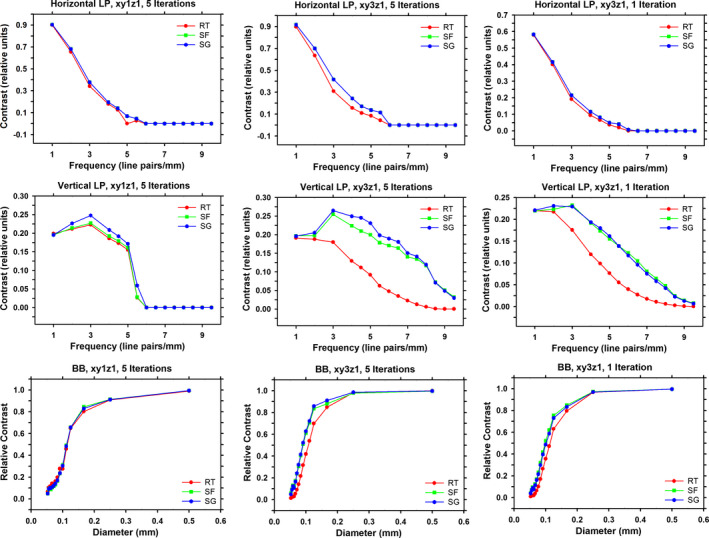
Dependence of mean contrast on the RT, SF, and SG projectors. Upper row: horizontal line pairs. Middle row: vertical line pairs. Lower row: BBs. Left column: xy1z1, five iterations. Middle column: xy3z1, five iterations. Right column: xy3z1, one iteration. [Colour figure can be viewed at wileyonlinelibrary.com]
For the subpixel reconstruction, the SG projector substantially improves the contrasts of the objects as shown in the second column of Fig. 14. When using the RT projector for subpixel reconstruction, the input projections have to be interpolated to reduce the sparsity of the rays and missing elements in the system matrix, which would lead to empty voxels in the reconstructed volume. The interpolation increases the number of rays to trace and may cause additional blur across sharp edges on the projections. With the SG projector, the original projections are used as input and no interpolation is needed. Therefore, there will be no blurring due to interpolation and the reconstructed line pairs may be sharper with higher contrasts.
For xy1z1 reconstruction or the horizontal line pairs, the improvement in resolution by the SG projector is not obvious compared to the RT projector. The main advantage of the SG projector is reducing noisy artifacts (see example in Fig. 9) due to numerical imprecision. The contrast of a specific set of line pairs is calculated from the average profile from nine individual profiles for a reconstructed in‐focus slice, which has a denoising effect, masking partly the problem with the RT projector in terms of contrast.
Another interesting observation is that the SF and SG projectors perform very similarly for the horizontal line pairs. This may be intuitively explained. If we have several consecutive voxels with the value of 1, the summed projection of all of them will be the sum of their footprints. As shown in Fig. 5, the SF and the SG footprints are very different when projected to the t‐axis (parallel to x) and very similar when projected to the s‐axis (parallel to y). As a result, the sum of several consecutive SF and SG footprints will be similar for consecutive voxels along the x‐direction and will be different for the voxels along the y‐direction. So it is reasonable that the horizontal line pairs (along the x‐direction) have similar reconstruction results with the SF or the SG projector.
The advantage of the SG projector also depends on the number of iterations, as seen by comparing the second and the third column of Fig. 14. With only one iteration, the SF projector actually produces slightly higher contrasts than the SG projector. As the number of iterations increases, the contrasts of objects increase faster with the SG projector, making it the best performing projector at five iterations. In fact, although a more accurate projector should improve the finally converged reconstructed image, there is no guarantee that it will also improve the intermediate reconstruction results. A sufficient number of iterations might be necessary to gain advantage from using the SG projector. It is difficult to estimate this number analytically. Experiments with different projectors might be necessary for a specific DBT system. This also indicates the importance of regularization in DBT image reconstruction,34, 38 which allows us to do more iterations without amplifying the noise at the same time.
4.C.5. Image blur in the depth direction
We evaluated the effect of the projectors on image blur in the z‐direction. The image blur is quantified by the artifact spread function (ASF) of the BBs, which is defined as the ratio between the contrast at each depth and the contrast at the focal plane39 of the object:
| (14) |
where z0 is the depth of the focal plane. The contrast of a BB at a given depth is defined as the value at the pixel nearest to the analytical location of the center of the BB above the background value, which is a constant for the phantom images. The ASF is calculated for a single BB rather than a pair of BBs. For a given BB diameter, with a pair of BBs at each of the 25 shifted locations, we calculated the average of the ASFs over the 50 BB locations to reduce the dependence of the alignment of the BB with the pixel grid. The average ASFs were compared for the three projectors under different reconstruction conditions.
Figure 15 shows the ASFs of different projectors for the BBs with a diameter of 0.25 mm. For the xy1z1 subpixel ratio, the three different projectors give very similar results. For the xy2z2 subpixel ratio, the SG and SF projectors show slightly narrower ASFs than that of the RT projector in the midrange but all ASFs decrease to near background value at about the same depth. The ASFs for the subpixel ratios xy2z1 and xy3z1 (not shown) are similar to the ASF of xy1z1, and the ASF of xy3z2 (not shown) is similar to that of xy2z2. Similar trends were also observed for the 0.5‐mm‐diameter BBs. The difference in the depth resolution among the projectors therefore is negligible for the objects studied.
Figure 15.

Comparison of ASF along the depth direction (z) from the RT, SF, and SG projectors for the 0.25‐mm‐diameter BBs. The images reconstructed with subpixel ratios xy1z1, xy2z1, xy2z2, and five iterations were analyzed. The depth z0 of the focal plane of the BB is plotted at 0 in the graphs. [Colour figure can be viewed at wileyonlinelibrary.com]
4.C.6. Computation speed
To save computation time and the space to store the reconstructed images, we reconstructed a volume of interest (VOI) of size 5 × 10 × 5 cm3 instead of the full volume (19.2 × 23.04 × 5.0 cm3, as shown in Fig. 1) using the full‐size projections as input. We positioned this VOI such that it contained all line pairs and spheres in the phantom and was beyond the extent of the truncated projection artifacts.34, 40 For different subpixel ratios, the reconstructed VOI had the same physical size, resulting in more voxels for higher subpixel ratios. The computation times of one iteration for reconstructing the same VOI using the different projectors and subpixel ratios are compared in Table 2. The computation times shown here include the time for outputting the reconstructed volume. The RT projector was implemented with the accelerated version of Siddon's algorithm,23 which was about 3 times faster than the original algorithm according to our tests. All reconstructions were performed with the same Linux workstation (Intel Xeon(R) CPU E5‐2690, 8 cores, 2.9 GHz, 32 RAM). We used 16 threads for all reconstructions with each projector.
Table 2.
Computation time (in seconds) of one iteration. The value in the parenthesis is the ratio of computation time relative to that using the RT projection at xy1z1
| Projector | xy1z1 | xy2z1 | xy3z1 | xy1z2 | xy2z2 | xy3z2 |
|---|---|---|---|---|---|---|
| RT | 16.3 (1.0) | 76.1 (4.7) | 263.9 (16.2) | 20.0 (1.2) | 91.7 (5.6) | 278.7 (17.1) |
| SF | 7.2 (0.4) | 17.6 (1.1) | 34.3 (2.1) | 10.6 (0.7) | 30.7 (1.9) | 62.0 (3.8) |
| SG | 14.1 (0.9) | 55.6 (3.4) | 143.4 (8.8) | 15.9 (1.0) | 63.3 (3.9) | 161.4 (9.9) |
Obviously, a higher subpixel ratio will take more computation time. The xy‐ratio affects the computation time more than the z‐ratio due to the fact that it is squared for the total number of voxels in the volume. Despite more computation, both the SF and SG projectors are more efficient than the RT projector because they access the memory array of the imaged volume sequentially. The SF projector is faster than the SG projector, as it is basically the SG projector with only one segment. For the xy3z1, the SG projector uses 18 segments to maintain the same height‐to‐width ratio as that used for the other subpixel ratios, which cost a substantial amount of extra computation time compared with the SF projector. The time saving by the SG projector compared with the RT projector increases with increasing xy‐ratio, because the SG projector does not use interpolated projections, which becomes a more serious problem at high xy‐ratios.
5. Limitations
5.A. Absence of noise and other factors
In this study, many factors in the imaging system, such as detector blur, correlated noise, focal spot blur, and other effects were ignored in generating the simulated DBT projections. This allows us to focus on the analysis of the role of the projector in the resolution of the reconstructed images. We observed improved resolution under this idealized situation, reinforcing the idea that a more accurate system model has the potential to improve DBT reconstruction. The overall effects of the projectors in the presence of these factors will warrant further studies. We are currently working on taking into account the detector blur and the correlated noise,41 as a further step toward a model‐based DBT reconstruction framework.
5.B. Comparison with the distance‐driven projector
As mentioned in Section Methods.B, we used a rect function, , and a trapezoid function, in our implementation of the SG projector [Eq. (8)]. This implementation is called the TR method.15 In principle, the distance‐driven projector25 is equivalent to using rect functions in both t‐ and s‐directions (the RR method). Compared with the TR method, we expect the RR method to reduce the computation time while reducing the projector accuracy. We plan to investigate whether the distance‐driven approximation (or the RR method) to each segment is adequate for the DBT geometry.
5.C. Efficient usage of the subpixel reconstruction
Although the subpixel reconstruction provides better quality images, it costs dramatically longer computation time as shown in Table 2. It also costs much more memory, as we need to store the reconstructed volume at a finer voxel grid. Considering the trade‐off between the improvement in contrasts and the computation time and storage space, the small gain from xy2 to xy3 (Fig. 13) may not be cost‐effective. The projectors we developed, either the RT or the SG projector, only cost a small amount of memory compared to that used for the voxel grid. For the phantom DBT in this study, if we use a voxel size of 0.1 × 0.1 × 1.0mm3 for reconstruction, the number of voxels in the imaged volume is 1920 × 2304 × 50, which will cost 0.82 GB of memory with single precision in floating point format. For the xy3z2 subpixel ratio, the memory cost is 14.8 GB. This size is only about that of an average breast and the DBT of many breasts can be much larger. As a result, it will be difficult to apply the subpixel method to the full imaged volume in clinical practice. An efficient way of using the subpixel reconstruction is to perform subpixel reconstruction only within selected VOIs. In fact, all the reconstructions in our study were performed based on the VOI‐specific reconstruction, as described in Section Conclusions.C.5. We have confirmed that if the VOI is properly selected and far from the regions affected by the truncated projection artifacts,34, 40 the reconstructed image slices should be identical to the same region from the full volume image reconstruction.
5.D. Shift variance of spatial resolution in DBT
DBT essentially uses a limited‐angle cone‐beam CT geometry, the spatial resolution of which is known to be shift‐variant. In this study, we only used one phantom embedded with a set of line pairs and spherical objects at fixed locations arranged centrally and near the chest wall in the DBT field of view. Because we used the same phantom projections for the reconstruction under all conditions, the relative performance should be a reasonable representation of the ranking of the conditions studied. As demonstrated in Figs. 5, 6, 7, the RMSE values of both the SF and SG projectors increase but that of the RT projector decreases as the x‐ray incident angle increases. The RMSE value of the SG projector remains much lower than those of the other two projectors. For objects located at large x‐ray incident angles and away from the chest wall, it is likely that the quality of the reconstructed images by the SG projector would still be superior to those by the other two projectors although the relative ranking of the RT and SF projectors is uncertain. In addition, the simulated array of line pairs was placed parallel to the detector plane and the reconstructed slices. The effects of different projectors on the spatial resolution of line pairs or objects that are rotated out of plane relative to the detector and/or the reconstructed slices are still unknown. The degree of shift variance of resolution in DBT and the spatial and angular dependences of the relative ranking of the different projectors for DBT reconstruction will be a topic of research interest in future studies.
6. Conclusions
This paper proposed an improved digital projector, the SG projector, for DBT reconstruction. Theoretically and experimentally, we demonstrated that the SG projector is able to generate very good approximations of the ideal projector. The SG projector outperforms the RT projector in terms of reconstruction quality without increasing the computation time. We applied the new projector to regular and the subpixel DBT reconstructions and illustrated its effectiveness. We compared the subpixel DBT reconstruction with the traditional RT projector and the SG projector. Results showed that the subpixel reconstruction can significantly improve image resolution, especially when it is used with the SG projector. The trade‐off of using the subpixel reconstruction is the extra computation time and memory, which may be reduced by performing subpixel reconstruction only within selected VOIs.
Conflicts of interest
The authors have no relevant conflicts of interest to disclose.
Acknowledgments
This work was supported by National Institutes of Health award number R01 CA151443. The authors thank GE Global Research for use of their CatSim simulation programs.
References
- 1. Helvie MA, Roubidoux MA, Hadjiiski LM, Zhang Y, Carson PL, Chan H‐P. Research digital tomosynthesis mammography: detection of T1 invasive breast carcinomas not diagnosed by conventional breast imaging or physical exam. RSNA Program Book. 2008;2008:468. [Google Scholar]
- 2. Poplack SP, Tosteson TD, Kogel CA, Nagy HM. Digital breast tomosynthesis: initial experience in 98 women with abnormal digital screening mammography. Am J Roentgenol. 2007;189:616–623. [DOI] [PubMed] [Google Scholar]
- 3. Smith AP, Rafferty EA, Niklason L. Clinical performance of breast tomosynthesis as a function of radiologist experience level, IWDM 2008 ‐. Lect Notes Comput Sci. 2008;5116:61–66. [Google Scholar]
- 4. Gennaro G, Baldan E, Bezzon E, La Grassa M, Pescarini L, di Maggio C. Clinical performance of digital breast tomosynthesis versus full‐field digital mammography: preliminary results, IWDM 2008 ‐. Lect Notes Comput Sci. 2008;5116:477–482. [Google Scholar]
- 5. Helvie MA, Chan H‐P, Hadjiiski LM, Sahiner B, Carson PL, Schmitz A. Digital breast tomosynthesis mammography: successsful assessment of benign and malignant microcalcifications. RSNA Program Book. 2009;2009:389. [Google Scholar]
- 6. Gur D, Abrams GS, Chough DM, et al. Digital breast tomosynthesis: observer performance study. Am J Roentgenol. 2009;193:586–591. [DOI] [PubMed] [Google Scholar]
- 7. Rafferty EA, Park JM, Philpotts LE, et al. Assessing radiologist performance using combined digital mammography and breast tomosynthesis compared with digital mammography alone: results of a multicenter, multireader trial. Radiol. 2013;266:104–113. [DOI] [PMC free article] [PubMed] [Google Scholar]
- 8. Skaane P, Bandos AI, Gullien R, et al. Comparison of digital mammography alone and digital mammography plus tomosynthesis in a population‐based screening program. Radiol. 2013;267:47–56. [DOI] [PubMed] [Google Scholar]
- 9. Rose SL, Tidwell AL, Bujnoch LJ, Kushwaha AC, Nordmann AS, Sexton R. Implementation of breast tomosynthesis in a routine screening practice: an observational study. Am J Roentgenol. 2013;200:1401–1408. [DOI] [PubMed] [Google Scholar]
- 10. Gordon R, Bender R, Herman GT. Algebraic reconstruction techniques (ART) for three dimensional electron microscopy and X‐ray photography. J Theor Biol. 1970;29:471–481. [DOI] [PubMed] [Google Scholar]
- 11. Andersen AH, Kak AC. Simultaneous algebraic reconstruction technique (SART): a new implementation of the ART algorithm. Ultrason Imaging. 1984;6:81–94. [DOI] [PubMed] [Google Scholar]
- 12. Wu T, Stewart A, Stanton M, et al. Tomographic mammography using a limited number of low‐dose cone‐beam projection images. Med Phys. 2003;30:365–380. [DOI] [PubMed] [Google Scholar]
- 13. Aguiar P, Rafecas M, Ortuno JE, et al. Geometrical and Monte Carlo projectors in 3D PET reconstruction. Med Phys. 2010;37:5691–5702. [DOI] [PubMed] [Google Scholar]
- 14. Beekman FJ, de Jong HW, van Geloven S. Efficient fully 3‐D iterative SPECT reconstruction with Monte Carlo‐based scatter compensation. IEEE Trans Med Imaging. 2002;21:867–877. [DOI] [PubMed] [Google Scholar]
- 15. Long Y, Fessler JA, Balter JM. 3D forward and back‐projection for X‐Ray CT using separable footprints. IEEE Trans Med Imaging. 2010;29:1839–1850. [DOI] [PMC free article] [PubMed] [Google Scholar]
- 16. Michielsen K, Van Slambrouck K, Jerebko A, Nuyts J. Patchwork reconstruction with resolution modeling for digital breast tomosynthesis. Med Phys. 2013;40:031105. [DOI] [PubMed] [Google Scholar]
- 17. Kim K, Lee T, Seong Y, et al. Fully iterative scatter corrected digital breast tomosynthesis using GPU‐based fast Monte Carlo simulation and composition ratio update. Med Phys. 2015;42:5342–5355. [DOI] [PubMed] [Google Scholar]
- 18. Xu S, Lu J, Zhou O, Chen Y. Statistical iterative reconstruction to improve image quality for digital breast tomosynthesis. Med Phys. 2015;42:5377–5390. [DOI] [PMC free article] [PubMed] [Google Scholar]
- 19. Michielsen K, Nuyts J. Multigrid reconstruction with block‐iterative updates for breast tomosynthesis. Med Phys. 2015;42:6537–6548. [DOI] [PubMed] [Google Scholar]
- 20. Sechopoulos I. A review of breast tomosynthesis. Part I. The image acquisition process. Med Phys. 2013;40:014301. [DOI] [PMC free article] [PubMed] [Google Scholar]
- 21. Sechopoulos I. A review of breast tomosynthesis. Part II. Image reconstruction, processing and analysis, and advanced applications. Med Phys. 2013;40:014302. [DOI] [PMC free article] [PubMed] [Google Scholar]
- 22. Siddon RL. Fast calculation of the exact radiological path for a three‐dimensional CT array. Med Phys. 1985;12:252–255. [DOI] [PubMed] [Google Scholar]
- 23. Jacobs F, Sundermann E, Sutter BD, Christiaens M, Lemahieu I. A fast algorithm to calculate the exact radiological path through a pixel or voxel space. J Comput Information Technol. 1998;6:89–94. [Google Scholar]
- 24. Zhao HX, Reader AJ. Fast ray‐tracing technique to calculate line integral paths in voxel arrays. In: 2003 IEEE Nuclear Science Symp. Conf. Record, Vol. 4. 2004; 2808–2812. [Google Scholar]
- 25. De Man B, Basu S. Distance‐driven projection and backprojection in three dimensions. Phys Med Biol. 2004;49:2463–2475. [DOI] [PubMed] [Google Scholar]
- 26. Li B, Avinash GB, Uppaluri R, Eberhard JW, Claus BEH. The impact of acquisition angular range on the z‐resolution of radiographic tomosynthesis. Int Congr Series. 2004;1268:13–18. [Google Scholar]
- 27. Lu Y, Chan H‐P, Wei J, Hadjiiski L, Samala R. Study of image quality in digital breast tomosynthesis by Subpixel reconstruction. Proc SPIE. 2013;8668:86680I. [Google Scholar]
- 28. Acciavatti RJ, Maidment ADA. Observation of super‐resolution in digital breast tomosynthesis. Med Phys. 2012;39:7518–7539. [DOI] [PMC free article] [PubMed] [Google Scholar]
- 29. De Man B, Basu S, Chandra N, et al. CATSIM: a new computer assisted tomography simulation environment. Proc SPIE. 2007;6510:65102G. [Google Scholar]
- 30. De Man B, Pack J, FitzGerald P, Wu M. CatSim Manual Version 6.0. GE Global Research; 2015.
- 31. ICRU . Photon, electron, proton and neutron interaction data for body tissues. ICRU Report 46; 1992.
- 32. Jiang M, Wang G. Convergence of the simultaneous algebraic reconstruction technique (SART). IEEE Trans Image Process. 2003;12:957–961. [DOI] [PubMed] [Google Scholar]
- 33. Zhang Y, Chan H‐P, Sahiner B, et al. A comparative study of limited‐angle cone‐beam reconstruction methods for breast tomosynthesis. Med Phys. 2006;33:3781–3795. [DOI] [PMC free article] [PubMed] [Google Scholar]
- 34. Lu Y, Chan H‐P, Wei J, Hadjiiski LM. A diffusion‐based truncated projection artifact reduction method for iterative digital breast tomosynthesis reconstruction. Phys Med Biol. 2013;58:569–587. [DOI] [PMC free article] [PubMed] [Google Scholar]
- 35. Lu Y, Chan H‐P, Wei J, Hadjiiski LM. Improving image quality of digital breast tomosynthesis by artifact reduction. Lect Notes Comput Sci. 2012;7361:745–752. [Google Scholar]
- 36. Ge J, Chan H‐P, Sahiner B, et al. Digital tomosynthesis mammography: intra‐ and interplane artifact reduction for high‐contrast objects on reconstructed slices using a priori 3D geometrical information. Proc SPIE. 2007;6512:65124Q. [Google Scholar]
- 37. Lu Y, Chan H‐P, Wei J, Hadjiiski LM, Samala RK. Improving Image Quality for Digital Breast Tomosynthesis: Automatic Detection and Inpainting Method for Metal Artifact Reduction. RSNA Program. 2013;2013:SSM21‐06. [Google Scholar]
- 38. Sidky EY, Reiser I, Nishikawa RM, et al. Practical iterative image reconstruction in digital breast tomosynthesis by non‐convex TpV optimization. Proc SPIE. 2008;6913:691328. [Google Scholar]
- 39. Wu T, Moore RH, Rafferty EA, Kopans DB. A comparison of reconstruction algorithms for breast tomosynthesis. Med Phys. 2004;31:2636–2647. [DOI] [PubMed] [Google Scholar]
- 40. Zhang Y, Chan H‐P, Sahiner B, Wei J, Zhou C, Hadjiiski LM. Artifact reduction methods for truncated projections in iterative breast tomosynthesis reconstruction. J Comput Assist Tomogr. 2009;33:426–435. [DOI] [PMC free article] [PubMed] [Google Scholar]
- 41. Zheng J, Fessler JA, Chan H‐P. Digital breast tomosynthesis reconstruction with detector blur and correlated noise. In: Proc. 4th International Conference on Image Formation in X‐Ray Computed Tomography, CT‐Meeting 2016. 2016: 21–24. [Google Scholar]


