

Field data show insensitivity of particle trajectories to wind speed and support linear scaling of sand flux with wind stress.
Keywords: aeolian processes, saltation, wind erosion, multiphase flows, planetary geomorphology, dust aerosols
Abstract
Wind-driven sand transport generates atmospheric dust, forms dunes, and sculpts landscapes. However, it remains unclear how the flux of particles in aeolian saltation—the wind-driven transport of sand in hopping trajectories—scales with wind speed, largely because models do not agree on how particle speeds and trajectories change with wind shear velocity. We present comprehensive measurements, from three new field sites and three published studies, showing that characteristic saltation layer heights remain approximately constant with shear velocity, in agreement with recent wind tunnel studies. These results support the assumption of constant particle speeds in recent models predicting linear scaling of saltation flux with shear stress. In contrast, our results refute widely used older models that assume that particle speed increases with shear velocity, thereby predicting nonlinear 3/2 stress-flux scaling. This conclusion is further supported by direct field measurements of saltation flux versus shear stress. Our results thus argue for adoption of linear saltation flux laws and constant saltation trajectories for modeling saltation-driven aeolian processes on Earth, Mars, and other planetary surfaces.
INTRODUCTION
Understanding wind-driven (“aeolian”) sediment transport is critical for modeling a wide range of geophysical processes. The saltation, the wind-driven liftoff, hopping, and splash of sand-sized particles, is central to all aeolian transport processes. In models of coastal evolution and the effects of sea-level rise, aeolian saltation contributes to the formation of protective foredunes (1). In desert and semiarid environments, aeolian saltation drives evolution of complex dune fields (2, 3), abrasion of bedrock (4), and erosion of soil (5). In arctic and alpine environments, aeolian snow saltation (6) modulates snow depth and melting processes (7). Entrainment of mineral dust into the atmosphere requires the impacts of saltating particles to break cohesive bonds among soil particles (8, 9). These dust aerosols have numerous important effects on the Earth system, including nutrient fertilization for land and ocean biota (10), modification of the hydrological cycle (11), alteration of the Earth’s climate by scattering and absorbing radiation and seeding clouds (12), and spreading of airborne pathogens (13). Furthermore, aeolian transport models, used in conjunction with observations of ripple and dune migration, are now allowing the inference of atmospheric conditions on Mars and other planetary bodies (14–16).
Despite the importance of aeolian saltation to this wide range of geophysical processes, existing aeolian transport models produce inconsistent predictions of saltation mass flux and particle trajectory characteristics (17). Although models agree that both wind drag on airborne particles and the ejection (“splashing”) of soil particles by impacting saltators together drive saltation, they disagree specifically on how the wind modulates particle trajectories. Beginning from the classic work of Bagnold (18), many saltation models presume that both splash and fluid lifting contribute to the initial liftoff speeds of saltator trajectories and therefore that saltation hop heights and mean particle speeds grow with increasing wind stress (19–21). In contrast, many more recent models argue that, during steady-state saltation, particle entrainment is predominantly driven by splash, because near-surface wind speeds are so much reduced by the presence of airborne particles that fluid lifting no longer contributes significantly to particle entrainment (22, 23). To maintain steady state, these splash-dominated saltation models require that mean saltator liftoff and impact speeds do not change with wind shear stress (24, 25), and many further assume constant mean vertically integrated particle speeds (22, 23, 26, 27).
Different treatments of particle trajectories lead to distinctive model predictions for how the saltation flux Q (g m−1 s−1) scales with the wind shear stress τ (Pa). The classic models, in which fluid lifting contributes to particle entrainment, produce nonlinear 3/2 stress-flux scaling (that is, Q ~ τ3/2) (18–21), whereas the more recent models with splash-dominated entrainment generally produce linear (22, 23, 27) or nearly linear (28, 29) stress-flux scaling (that is, Q ~ τ). The differences in linear versus 3/2 scaling models originate from differences in mean horizontal particle speed V (m s−1), which is related to Q and the vertically integrated saltation layer mass concentration Φ (g m−2) as
| (1) |
Models and observations agree that mass concentration scales linearly with shear stress in excess of a minimum threshold (28, 30, 31). Typically, this minimum value is the “impact threshold” stress τit required to sustain saltation (20, 26, 32, 33); thus, Φ ~ τex, where
| (2) |
is the “excess” stress. This is because, with increasing τex, the wind can support a greater concentration of saltators to balance the growing momentum dissipation from saltator splash with the bed (20, 33). Saltation model disagreement instead arises over particle speed scaling with shear velocity u*, where
| (3) |
and ρf is the air density. In particular, the 3/2 stress-flux scaling models assume that V increases linearly with shear velocity u* (that is, V ~ u* or V ~ τ1/2) because of the contribution of fluid lifting to particle entrainment (18–20); thus, by Eq. 1, Q ~ τ3/2 (alternatively, Q ~ ) in these models. In contrast, linear stress-flux scaling models assume that, because particle entrainment is dominated by splash, V remains roughly constant with u* and τ; thus, Q ~ τ (alternatively, Q ~ u*2) in these models (22, 23, 27, 34). Some additional models assume splash-dominated particle entrainment and constant saltator liftoff speeds but allow for weak increases in mean particle speed with shear velocity (28, 29); these models thus produce weakly nonlinear saltation flux scaling, that is, Q ~ τn, 1 < n < 3/2. Recent review papers provide more detailed descriptions of these competing aeolian saltation models (26, 35).
Recent studies provide several pieces of evidence in favor of splash-dominated particle entrainment and consequent linear stress-flux scaling. First, wind tunnel experiments (30, 36–39) show that near-surface particle liftoff and impact speeds do not change with u*, which implies splash-dominated entrainment (26). Second, wind tunnel experiments (30, 37, 39, 40) and some numerical simulations (31) show a negligible change in saltation layer height zq with u*. On the basis of the ballistic nature of saltator trajectories, zq should scale roughly with the vertical particle speed and hence with V2 (20); thus, by Eq. 1, u*-invariant zq implies u*-invariant V and linear stress-flux scaling (34). Third, wind tunnel measurements directly support linear scaling between shear stress τ and saltation flux Q (30, 40). Note that past wind tunnel studies deviating substantially from constant particle speeds (41) and constant saltation heights (42, 43) can likely be explained by an inadequate length of erodible sand bed in the wind tunnel to reach steady-state saltation conditions (44, 45).
Although wind tunnel studies provide empirical support for saltation models incorporating splash-dominated particle entrainment and linear stress-flux scaling, field-based evidence for these models is lacking. Field studies are complicated by the need to obtain sufficient data to overcome the systematic variability arising from wind turbulence (46) and soil properties (47). Wind turbulence structures in natural settings span a much broader range of spatial and temporal scales than in wind tunnels (35) so that longer sampling windows are required in field studies to overcome nonstationarity effects (48, 49). One previous study (46) supported linear stress-flux scaling but showed strong time-scale dependence in the specific parameterization of the stress-flux relationship for periods of up to 17 min. A set of previous field studies (50, 51) applied moderately long observational intervals (17 min) for individual stress and flux measurements but sampled a relatively small number of these intervals. Because of this limited field evidence, older models that include fluid lifting contributions to entrainment and 3/2 stress-flux scaling remain prevalent for saltation model applications, including prediction of atmospheric dust emission (52, 53), dune migration (54, 55), and planetary surface evolution (14).
Here, we present a comprehensive set of field-based measurements of saltation at multiple sites to evaluate the competing aeolian saltation models with 3/2 and linear stress-flux scaling. On the basis of our observations of saltation flux profiles, we show definitively that saltation layer height does not change with increasing wind shear velocity. We show how these constant saltation layer height measurements, along with direct observations of the stress-flux relationship, support the more recent saltation models governed by splash-dominated particle entrainment and linear stress-flux scaling. Finally, we discuss the implications of these results for representing aeolian processes on Earth, Mars, and other planetary bodies.
RESULTS
Saltation layer heights
We measured time series of wind velocity and vertical profiles of streamwise saltation flux at three coastal sand dune locations with varying site conditions: Jericoacoara (Brazil), Rancho Guadalupe (California), and Oceano (California). Wind and sand transport variables were computed over 30-min time intervals, sufficiently long to capture the full range of driving turbulent fluctuations (56). Then, 30-min values were clustered into bins by shear stress to evaluate systematic uncertainty. We also analyzed field saltation profile measurements obtained by Greeley et al. (57), Namikas (58), and Farrell et al. (59). Together, our new field data and the literature data represent a wide range of surface sand sizes (Table 1). Data collection and processing methods are described further in Materials and Methods and in the Supplementary Materials.
Table 1. Grain size, saltation profile, and flux law fit values.
d50 is the median grain diameter for surface samples. Full grain-size distributions for field sites can be found in the study of Martin et al. (83). Farrell et al. (59) did not report a surface grain size, and Greeley et al. (57) and Namikas (58) did not report associated uncertainties. 〈zq〉 is mean saltation layer height. 〈zq〉/d50 is the ratio of saltation height to grain size. τit and u*,it are best-fit saltation impact threshold shear stress and shear velocity, respectively, for the linear flux law. CQ is the best-fit scaling parameter for Eq. 10 for each site. Included uncertainties here and elsewhere represent 1 SD.
| Location/study | d50 (mm) | 〈zq〉 (m) | 〈zq〉/d50 | τit (Pa) | u*,it (m s−1) | CQ |
| Jericoacoara | 0.53 ± 0.04 | 0.097 ± 0.005 | 184 ± 10 | 0.135 ± 0.015 | 0.341 ± 0.019 | 7.3 ± 0.9 |
| Rancho Guadalupe | 0.53 ± 0.03 | 0.107 ± 0.005 | 202 ± 10 | 0.110 ± 0.021 | 0.300 ± 0.028 | 5.8 ± 0.5 |
| Oceano | 0.40 ± 0.07 | 0.055 ± 0.004 | 138 ± 9 | 0.094 ± 0.006 | 0.277 ± 0.009 | 5.9 ± 1.0 |
| Greeley et al. (57) | 0.23 | 0.050 ± 0.006 | 218 ± 26 | |||
| Namikas (58) | 0.25 | 0.049 ± 0.003 | 197 ± 11 | |||
| Farrell et al. (59) | 0.081 ± 0.008 |
On the basis of these field data, we first examined the relationship between the characteristic saltation layer height zq and the wind shear velocity u*. To determine zq, we fit an exponential function to vertical profiles of horizontal saltation flux, q(z) (g m−2 s−1)
| (4) |
where q0 (g m−2 s−1) is the scaling parameter for the profile. Our choice to fit an exponential to the flux profile was justified by previous field studies (57, 58) and by its close adherence to measured flux profiles (see fig. S3). We calculated u* by the Reynolds stress method. The calculations are described in detail in Materials and Methods and in the Supplementary Materials.
We find that zq remains roughly constant with u* at each field site (Fig. 1A). The same is true for calculations of saltation layer height obtained by fitting Eq. 4 to the field measurements of Greeley et al. (57), Namikas (58), and Farrell et al. (59). Although substantial differences in saltation layer height exist from site to site, the slopes of the linear fits to zq versus u* (Fig. 1B) indicate that changes in saltation layer height with shear velocity are statistically insignificant or negligible. When zq is normalized by median grain diameter d50, variability among sites is reduced substantially, with mean dimensionless saltation layer heights, 〈zq〉/d50, all falling within the range of 138 to 218 (Fig. 1C and Table 1). Our measurements therefore show that zq ∝ d50, regardless of u*. Such scaling of saltation layer height with particle diameter occurs because (i) the motion of larger particles is damped less by vertical air drag (60), and (ii) larger particles require greater impact energies, and therefore saltation hop heights, to sustain saltation (26). In summary, our data indicate that changes in saltation layer height with shear velocity are negligible; other site conditions, primarily d50, instead exert the dominant control on particle trajectories.
Fig. 1. Measurements of saltation layer heights.
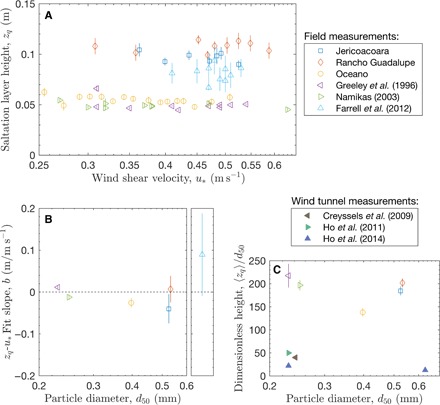
(A) Characteristic saltation layer heights zq versus shear velocities u*, acquired over 30-min intervals, grouped into u* bins. Bars represent uncertainties in zq for each bin. Methods for computing zq from field data of Greeley et al. (57), Namikas (58), and Farrell et al. (59) are described in the Supplementary Materials. (B) Slope parameter b for linear fit to zq = a + bu* versus d50. Data are plotted separately for Farrell et al. (59), who did not report d50. Bars represent uncertainties in b for each site. (C) Mean dimensionless saltation layer height 〈zq〉/d50 versus particle diameter d50. Bars represent uncertainties in 〈zq〉/d50 for each site. Dimensionless saltation layer heights from wind tunnel experiments (30, 39, 40) are shown for comparison.
Consequences of constant saltation layer heights for the saltation flux law
We now consider how the u* invariance of saltation layer heights zq affects the expected scaling of saltation flux Q with shear stress τ. Because direct field-based measurements of Ф and V in Eq. 1 remain difficult to obtain under natural field conditions (57), we instead rely on known relationships among zq, d50, and other physical parameters. This derivation is similar to the derivations described by Kok et al. (26) and Durán et al. (35).
The saltation flux is driven by that portion of the wind stress that is not dissipated through friction at the sand surface. Measurements and theory indicate that the rate of frictional dissipation during steady-state saltation approximately equals the impact threshold τit (20, 26, 32, 33), and the remaining excess stress τex (Eq. 2) actually does work to move sediment. In equilibrium, the momentum contribution to particles from τex is balanced by particle momentum dissipation due to inelastic saltator collisions with the soil bed τp, that is
| (5) |
where M (g m−2 s−1) is the mass collision rate per unit bed area and e is the (dimensionless) bulk restitution coefficient of saltator impacts. M is related to particle concentration Φ by
| (6) |
where thop is the mean saltator hop time. To first order, we assume particle trajectories to be ballistic (35, 61), for which thop is related to the mean hop height zhop as
| (7) |
where g is the gravitational acceleration. Assuming that the saltation layer e-folding height zq depends on the mean particle trajectory height (18, 20, 22), we have
| (8) |
where Cz is a (dimensionless) constant of order 1. On the basis of our finding that zq remains constant with wind strength, Eqs. 7 and 8 imply constant thop; thus, M depends only on Φ in Eq. 6. Because Φ ~ τex, the saltator mass collision rate also increases linearly with the excess shear stress, that is, M ~ τex.
Combining Eqs. 5 to 8 with Eq. 1 yields an expression for the saltation mass flux
| (9) |
where Ct is an empirical scaling parameter. Because our field measurements show that zq ~ d50 and wind tunnel measurements further show that the impact threshold shear velocity u*,it is also related to particle diameter d50 (that is, ) (18), Eq. 9 can be simplified to
| (10) |
where CQ is an empirically derived (dimensionless) scaling parameter. Equation 9 more explicitly includes the physical parameters (zq, e, and τit) that determine the saltation flux law, whereas Eq. 10 is a simpler expression facilitating comparisons among studies. The linear scaling of both M and Q with τex in this derivation indicates that, for linear saltation flux laws (that is, Eqs. 9 and 10), changes in saltation flux are entirely accommodated by changes in particle concentration, whereas mean characteristics of saltator trajectories (for example, launch and impact speed and hop height) are insensitive to wind strength.
Direct evaluation of saltation flux scaling with shear stress
To evaluate the linear stress-flux scaling of Eq. 10, we compared direct measurements of Q and τ (see Materials and Methods). We computed the total saltation flux by calculating the vertical integral over exponential saltation flux profile fits (Eq. 4)
| (11) |
These measurements, shown in Fig. 2, appear to slightly favor linear stress-flux scaling over 3/2 scaling. To further test the preferability of this linear scaling, we compared fits of the form
| (12) |
and
| (13) |
where C and τit are the fitting parameters for these respective linear and 3/2 fits. We characterized the relative quality of the fits by calculating , the normalized mean-squared difference between best fit and observed values (see Table 2 and eq. S15). At Jericoacoara and Oceano, is substantially smaller for the linear fit than for the 3/2 fit. At Rancho Guadalupe, the values are comparable. Although this comparison of values supports linear scaling over 3/2 scaling, measurements of saltation flux at higher shear stresses, unavailable in our existing field data set (Fig. 2), would more definitively resolve the preferability of linear versus 3/2 saltation flux models.
Fig. 2. Saltation mass flux Q versus wind shear stress τ at the three field sites.
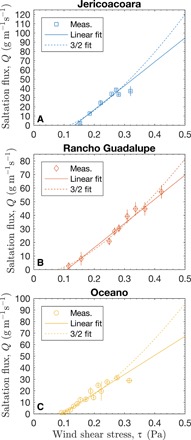
The plotted data correspond to values computed over 30-min intervals and combined into τ bins, with error bars denoting uncertainties in the binned values. Solid lines show linear fits to Eq. 12, whereas dashed lines show nonlinear 3/2 fits to Eq. 13. Fit lines have been extended to demonstrate differences between linear and 3/2 flux law predictions for large τ. The specific parameter values for these fits are listed in Table 2.
Table 2. Comparison of linear and nonlinear 3/2 flux law fit values for the three field sites.
Uncertainties for fit values—scaling parameter C and impact threshold shear stress τit—are expressed as ±1 SD. d50 is the median grain diameter for surface samples, and is the normalized mean-squared difference between best-fit and observed values of saltation flux Q.
| Site |
d50 (mm) |
Linear: Q = C(τ − τit) | Nonlinear 3/2: Q = Cu*(τ − τit) | ||||
|
C (s × 103) |
τit (Pa) |
C (m−1s2 × 103) |
τit (Pa) |
||||
| Jericoacoara | 0.53 ± 0.04 | 259 ± 16 | 0.135 ± 0.015 | 2.59 | 480 ± 43 | 0.119 ± 0.011 | 3.56 |
| Rancho Guadalupe | 0.53 ± 0.03 | 178 ± 14 | 0.110 ± 0.021 | 0.51 | 303 ± 35 | 0.080 ± 0.025 | 0.44 |
| Oceano | 0.40 ± 0.07 | 165 ± 6 | 0.094 ± 0.006 | 2.04 | 359 ± 19 | 0.084 ± 0.005 | 2.62 |
Parameterization of saltation flux law
To facilitate the application of our results to modeling aeolian processes, we now obtain a specific parameterization of the flux law in Eq. 10. To do so, we rearrange the components of Eq. 10 to obtain a normalized saltation flux
| (14) |
We obtain the impact threshold shear velocities u*,it in Eq. 14 from the linear fits of saltation flux to shear stress (Eq. 12 and Table 2). In support of this choice, we note that the impact threshold values estimated from the linear fit are consistent with a separate determination of the impact threshold stresses at our field sites (62).
In Fig. 3, we compare to τex. By Eq. 10, we expect these comparisons to follow a common relationship of the form
| (15) |
Fig. 3. Normalized saltation mass flux versus excess shear stress τex.
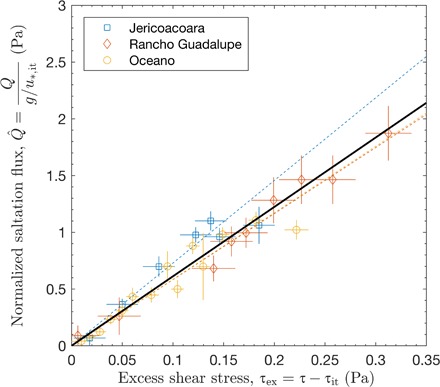
Normalized saltation mass flux is computed using Eq. 14, and excess shear stress τex is calculated by Eq. 2. Data are grouped into τex bins, with bars denoting uncertainties for each bin. Dashed lines indicate expected for best-fit values of CQ for each site (Oceano and Rancho Guadalupe values are almost identical), and the solid black line denotes the expected for the uncertainty-weighted mean of CQ across all sites. The values of CQ for each site are also listed in Table 1.
Best-fit values of CQ for each site, obtained by calculating the mean of the ratio , fall in a similar range of 5.8 to 7.3 (Table 1), which we combine to estimate an average of CQ = 6.1 ± 0.4 for all sites (see eqs. S23 and S24). An alternative expression of this relationship in terms of the conventionally used shear velocity is
| (16) |
Notably, our empirically obtained flux scaling parameter is consistent with CQ = 5 predicted by Kok et al. (26) in their derivation similar to ours for Eq. 10, which was based on typical observed saltator hop lengths, particle speeds, and impact threshold shear velocities for fine sand. This agreement lends support to the physical assumptions underlying our derivation of the linear saltation flux law.
DISCUSSION
Our field measurements at three different sites and measurements from three literature studies show that saltation layer heights remain constant with wind shear velocity (Fig. 1). This constancy of the saltation layer height implies that mean particle speeds also remain approximately constant. Constant particle speeds, in turn, imply a linear scaling of saltation flux with wind shear stress, which is supported by direct sand flux measurements at our three sites (Fig. 2). We further analyzed our measurements to obtain a simple parameterization for the flux relationship (Fig. 3 and Eq. 16).
These results provide strong field-based evidence for aeolian saltation models in which particle entrainment is dominantly driven by splash, mean saltation heights and particle speeds remain constant with shear velocity (governed instead by sand grain size and fluid parameters), and saltation flux therefore scales linearly with excess shear stress (22, 23). In addition to supporting linear stress-flux scaling and splash-dominated saltation dynamics, our observations cast doubt on widely used saltation models that presume a significant contribution of fluid lifting to particle entrainment, particle trajectories expanding with shear velocity, and nonlinear 3/2 scaling of saltation flux with wind shear stress.
Although previous studies have argued for splash-dominated particle entrainment and linear stress-flux scaling, field-based studies to confirm these saltation dynamics have been lacking until now. By calculating saltation values for a greater number of time intervals (154 here versus 51 previously) of longer duration (30 min here versus 17 min previously) than the most extensive set of past studies (50, 51), and by grouping data into bins corresponding to specific ranges of shear stress (see Materials and Methods and the Supplementary Materials), we sought here to overcome the limited scope of previous field measurements. Nonetheless, our measured saltation fluxes Q typically vary by ≈ 50 % within each τ bin, and these variations are even larger near the threshold τit (see fig. S5). This variability, which is also revealed in the range of values for and CQ (Fig. 3 and Table 1), suggests the presence of additional unexplained factors governing saltation flux. Changes in soil moisture (63) and grain-size distributions (60) could cause the restitution coefficient e or the impact threshold τit to vary, rather than to remain constant, as we assumed when deriving Eq. 10. In addition, measured shear stresses may not account for low-frequency turbulence structures (64), which could further modulate the saltation flux. More work is needed to understand the role of these factors in driving saltation flux variability.
Despite the difficulties of collecting and analyzing field measurements, field campaigns are necessary to validate the idealized treatments of aeolian saltation in wind tunnel and numerical studies. Surprisingly, Fig. 1C shows that the normalized saltation heights we measured in the field (zq/d50 ≈ 150 to 200) are several times larger than values both measured in equilibrated wind tunnels (zq/d50 ≈ 10 to 50) (30, 39, 40) and predicted in some numerical studies (31). This puzzling discrepancy suggests that wind tunnel experiments and numerical models neglect or misrepresent one or more processes that enhance particle trajectories and/or suppress the growth of zq with u* (65). One candidate process is electrification, which could provide a downward force that increases with u* (66). This could explain the constancy of zq with u* but not the underestimation of zq/d50. A second candidate process is mid-air interparticle collisions, but these have a dispersive effect expected to cause an enhancement of both zq and Q that increases with u* (67, 68), which contrasts with our observations. A third candidate process is modification of saltation transport mechanics by atmospheric turbulence (49, 69), although it is not yet clear how large-scale turbulence structures affect saltation (17). Fourth, it is also possible that the small boundary layer depth comparable to saltation height in wind tunnels (32) affects the trajectories of energetic particles amidst turbulent winds. Given our poor understanding of how these candidate processes affect saltation trajectories, they require further exploration.
Although field measurements disagree with wind tunnel and numerical studies on the magnitude of saltation heights, they agree that these heights remain roughly constant with shear velocity (30, 39, 40), supporting the interpretation that saltator entrainment is dominated by splash (22, 27, 35, 40, 61) and therefore that mean particle speed V does not change significantly with wind strength. Wind tunnel experiments (30, 36–39) and numerical simulations (31, 58) support the u* invariance of mean particle speeds near the surface, although recent simulations (35, 70) and wind tunnel experiments (30, 37, 40) puzzlingly find that particle speeds far above the sand bed do increase with u* [see Fig. 14 in the review of Kok et al. (26)], thus causing a weak increase in V with u*. One possible explanation is that the saltation flux profile q(z) could maintain both u*-invariant zq and u*-dependent V through changes in the vertical distribution of particle concentration Φ. Another possibility is that changes in particle speeds near the tops of saltation trajectories are insignificant in determining zq, which is dominantly governed by particle concentrations and speeds lower in the q(z) profile. Either way, any dependence of V on u*, if it exists, is small and therefore consistent with linear (or almost linear) scaling of aeolian saltation flux with shear stress. Further field measurements to determine the mean, distribution, and height dependence of particle speeds with u* (57) are needed to clarify how these different aspects of particle trajectories combine to determine the saltation layer height.
In contrast to aeolian saltation, there is a strong linear dependence of V on u* in fluvial (water-driven) saltation (71, 72). In fluvial settings, zq is also observed to increase significantly with u* (73) for transport over an erodible bed. This strong u* dependence of V and zq in fluvial saltation occurs because direct fluid lifting dominates particle entrainment and therefore particle liftoff speeds in fluvial transport (74), although splash may still contribute to particle mobilization from gravel beds (73, 75). Because V increases linearly with u*, fluvial bed load models predict 3/2 scaling of sediment flux with shear stress (72), as (mistakenly) predicted by classic aeolian saltation models (18–21).
Fluvial bedload and aeolian saltation are distinguished by a large difference in particle-fluid density ratio, s = ρp/ρf, which appears to control the relative importance of splash versus fluid entrainment of particles (76, 77). We therefore generally expect s to also determine the occurrence of linear versus nonlinear 3/2 stress-flux scaling under transport-limited conditions on planetary surfaces (31, 78). When s is between the Earth aeolian (s ≈ 2000) and fluvial cases (s ≈ 2.65), as in aeolian transport on Venus (s ≈ 40) and Titan (s ≈ 190) (77), we expect a scaling of the flux with stress that is intermediate between the linear (aeolian) and nonlinear (fluvial) cases. In contrast, on planetary surfaces where s ≥ 2000, such as Mars (s ≈ 2.5 × 10⁵), Neptune’s moon Triton (s ≈ 107), Jupiter’s moon Io (s ≈ 1012), comets (for example, s ≈ 1012), and possibly even Pluto (s ≈ 107) (77, 79), a linear saltation flux law and constant particle speeds and saltation heights should predominate. This contrasts with the prevalence of 3/2 saltation flux laws used in studies of aeolian processes on Mars (14, 21, 80). Furthermore, the dominance of splash entrainment on surfaces with large s suggests a clear separation between the “fluid threshold” stress for initiating saltation and a lower impact threshold for sustaining it (61, 81, 82), the difference growing larger as s increases (77).
Here, we have used extensive field observations to show that the aeolian saltation layer height is insensitive to wind speed. Saltation height is determined instead by median sand bed particle diameter, although saltation heights normalized by grain size appear to be much larger in the field than in wind tunnel studies. A constant saltation height implies a linear scaling of saltation flux with wind stress, strongly supporting recent splash-dominated models of aeolian saltation over older models that predict 3/2 stress-flux scaling and include direct fluid lifting of particles from the sand bed. Studies of aeolian processes driven by saltation have long been dominated by the use of these nonlinear saltation flux laws (14, 52–55). In contrast, our field measurements suggest that saltation flux scales linearly with wind stress. This finding has the potential to inform a wide range of future studies of aeolian processes on Earth, Mars, and other planetary bodies.
MATERIALS AND METHODS
Field sites
We obtained coupled field measurements of wind velocity and saltation flux at three sites (Jericoacoara, Ceará, Brazil; Rancho Guadalupe, California, United States; and Oceano, California, United States), providing 3, 2, and 12 measurement days, respectively, of active saltation. All measurement sites were relatively flat with ≈100 to 300 m of open sand upwind and ≈0.6 to 1.0 km of upwind fetch to the shoreline. We chose sites that represent a range of soil conditions and size distributions. Surface sediment samples were collected daily, and the grain-size distributions for these samples were determined using a Retsch Camsizer particle size analyzer. We calculated median surface particle diameters d50 (Table 1) from the average of all sample distributions at each site. More detailed description of field sites is provided by Martin et al. (83).
Wind calculations
We determined wind shear stresses from sonic anemometer observations (25 Hz at Jericoacoara and Rancho Guadalupe and 50 Hz at Oceano) at about half a meter above the sand surface. As in the study of Kok et al. (84), we subdivided wind time series into 30-min intervals: long enough to capture the largest turbulence structures but short enough to resolve meteorological variability (56). In all analyzed 30-min intervals with saltation, winds were aligned within 20° of the prevailing wind direction (see fig. S1) and conditions were roughly neutrally stable, as indicated by absolute values of the stability parameter less than 0.15 (eq. S4 and fig. S2).
We applied the Reynolds stress method to calculate shear stress τ for each 30-min analysis interval. Before computing stress, we first rotated the coordinate system according to the procedure of van Boxel et al. (56) so that interval mean streamwise (u) and vertical (w) winds were 0. Over each of these time intervals, we computed the 30-min Reynolds stress as
| (17) |
where u′ and w′ (ū and ) are the fluctuating (mean) components of the rotated streamwise and vertical wind, respectively, and the overbar refers to the ensemble average over the entire 30-min interval. On the basis of sea-level air pressure and typical temperatures of 30°C at Jericoacoara and 15°C at Rancho Guadalupe and Oceano measured during the deployments, we used air density values of ρf = 1.16 and 1.22 kg/m3 in all calculations. We then computed shear velocities u* from shear stresses τ using Eq. 3. Further description of shear stress and shear velocity calculations is provided in the Supplementary Materials.
Saltation flux calculations
At each site, vertical profiles of horizontal saltation flux q(z) were determined from Wenglor laser particle counter measurements (25 Hz) at multiple (3 to 9) heights (z = 0.02 to 0.47 m) (85). We calibrated Wenglor counts to 1-hour absolute mass fluxes from Big Spring Number Eight (BSNE) saltation trap (86) measurements at multiple (4 to 8) heights (z = 0.05 to 0.70 m) fitted to the exponential profile in Eq. 4. We chose this method because the Wenglors provided much higher temporal resolution, but counting sensitivities among Wenglors varied substantially in space and time due to scratching and dust buildup on lenses and other unexplained factors. From the calibrated Wenglor fluxes, we subsampled 30-min average q(z) profiles. On the basis of these profiles (for example, fig. S3), we again applied the exponential fit to calculate saltation layer height zq (Eq. 4) and total saltation flux Q (Eq. 11). Methods for obtaining calibrated saltation flux profiles q(z) along with saltation heights zq and fluxes Q were described in much greater detail by Martin et al. (83).
We note here two possible limitations of our measurements for saltation height zq and saltation flux Q. First, we could only measure q(z) for heights z > 2 cm. Namikas (58) and Bauer and Davidson-Arnott (69) observed saltation fluxes very close to the surface (z < 2 cm) that exceed the expectation of an exponential profile (Eq. 4). The fact that we did not measure this lower range likely resulted in an overestimation of zq and an underestimation of Q. However, exponential profile fits to the data of Namikas (58), which extend to below z = 2 cm, show no significant change in zq with u*, suggesting that this lower region contributes a constant fraction of the total flux and thus does not bias observed scaling relationships in zq versus u* or Q versus τ. Second, our measurements of saltation flux may contain flux-dependent biases resulting from variations in saltation trap efficiency (86). These biases could produce height-dependent relative errors in the profile for q(z) and thus systematic errors in zq and Q. However, different types of traps (with different expected biases) were used in the literature field studies (57–59), yet they produced the same u*-invariant zq as in our field measurements. It is thus unlikely that trap bias affected our analysis of zq versus u*.
Data binning
Plots of saltation layer height zq versus shear velocity u* (fig. S4) and total saltation flux Q versus shear stress τ (fig. S5) indicate unexplained systematic uncertainties in saltation-wind relationships, possibly arising from large-scale turbulence structures (46) or soil characteristics (47) not considered in our analyses. To quantify these systematic uncertainties in measured fluxes and saltation layer heights, we combined individual 30-min values for u*, τ, zq, and Q, into bins defined by ranges of τ. We then computed means and uncertainties for each of these binned values, and we propagated these uncertainties into estimates of excess stress τex, normalized flux , and other derived quantities. When generating binned values for zq, we included only 30-min values with detected transport because zq is undefined when transport is not occurring. These binning procedures are described in greater detail in the Supplementary Materials.
Statistical analysis
We compared linear and nonlinear 3/2 flux laws by performing fits to these two scaling relationships against binned values for shear stress τ and total saltation flux Q. When performing fits, we included only τ bins for which transport was detected at least 10% of the time, because the flux law applies only during transport. We performed the fit to the linear flux law (Eq. 12) through linear regression, and we performed the fit to the nonlinear 3/2 flux law (Eq. 13) by finding the values of the parameters (C and τit) that minimized the value of , the normalized mean-squared difference between observations and predictions (Table 2). Fitting procedures are further described in the Supplementary Materials.
Supplementary Material
Acknowledgments
We thank K. Whipple, D. Jerolmack, and two anonymous reviewers for thorough and insightful comments that helped us to improve the quality and clarity of our manuscript. Oceano Dunes State Vehicular Recreation Area, Rancho Guadalupe Dunes Preserve, and Jericoacoara National Park provided essential site access and support. We thank M. Chamecki for advice on treatment of wind data; C. Hugenholtz and T. Barchyn for equipment help; D. Jerolmack for laboratory access for grain-size analysis; K. Ledger for writing guidance; and J. Ellis, P. Sousa, P. Li, F. Turney, A. Samaddar, and L. Freire for field assistance. Jericoacoara fieldwork is registered with the Brazilian Ministry of the Environment (#46254-1 to J. Ellis). Funding: U.S. NSF Postdoctoral Fellowship EAR-1249918 to R.L.M. and NSF grant AGS-1358621 to J.F.K. supported this research. Research was also sponsored by the Army Research Laboratory and was accomplished under grant number W911NF-15-1-0417. The views and conclusions contained in this document are those of the authors and should not be interpreted as representing the official policies, either expressed or implied, of the Army Research Laboratory or the U.S. Government. The U.S. Government is authorized to reproduce and distribute reprints for Government purposes notwithstanding any copyright notation herein. Author contributions: R.L.M. led and J.F.K. closely advised all field data collection, data analysis, and writing. Competing interests: The authors declare that they have no competing interests. Data and materials availability: All data needed to evaluate the conclusions in the paper are present in the paper and/or the Supplementary Materials. Additional data related to this paper may be requested from the authors. Unbinned and binned analysis values are included in data files S1 and S2, respectively. These data may also be accessed through the Zenodo data repository at http://doi.org/10.5281/zenodo.291798 and http://doi.org/10.5281/zenodo.291799, respectively.
SUPPLEMENTARY MATERIALS
Supplementary material for this article is available at http://advances.sciencemag.org/cgi/content/full/3/6/e1602569/DC1
Supplementary Text
fig. S1. Wind angle θ versus shear stress τ over individual 30-min intervals at the three field sites.
fig. S2. Stability parameter versus shear stress τ over individual 30-min intervals at the three field sites.
fig. S3. Typical 30-min vertical profile of saltation flux.
fig. S4. Thirty-minute values of saltation layer height zq versus shear velocity u* at the three field sites.
fig. S5. Thirty-minute values of saltation mass flux Q versus wind shear stress τ at the three field sites.
fig. S6. SD of saltation flux values within individual stress bins i, SDQi, versus bin-averaged saltation fluxes, Qi.
data file S1. Excel spreadsheet (.xlsx) containing unbinned 30-min values for shear velocity u*, shear stress τ, wind direction θ, stability parameter z/L, saltation layer height zq, total saltation flux Q, saltation detection frequency fQ, and associated uncertainties for all of these values (except θ, z/L, and fQ) for each field site.
data file S2. Excel spreadsheet (.xlsx) containing binned 30-min values for shear velocity u*, shear stress τ, excess shear stress τex, saltation layer height zq, total saltation flux Q, normalized saltation flux , saltation detection frequency fQ, and associated uncertainties for all of these values.
REFERENCES AND NOTES
- 1.Durán O., Moore L. J., Vegetation controls on the maximum size of coastal dunes. Proc. Natl. Acad. Sci. U.S.A. 110, 17217–17222 (2013). [DOI] [PMC free article] [PubMed] [Google Scholar]
- 2.S. G. Fryberger, G. Dean, E. D. McKee, Dune forms and wind regime, in A Study of Global Sand Seas, U.S. Geological Survey Professional Paper 1052, E. D. McKee, Ed. (Elsevier, 1979), pp. 137–170. [Google Scholar]
- 3.Lancaster N., Controls of eolian dune size and spacing. Geology 16, 972–975 (1988). [Google Scholar]
- 4.Perkins J. P., Finnegan N. J., de Silva S. L., Amplification of bedrock canyon incision by wind. Nat. Geosci. 8, 305–310 (2015). [Google Scholar]
- 5.Chepil W. S., Dynamics of wind erosion: I. Nature of movement of soil by wind. Soil Sci. 60, 305–320 (1945). [Google Scholar]
- 6.Pomeroy J. W., Gray D. M., Saltation of snow. Water Resour. Res. 26, 1583–1594 (1990). [Google Scholar]
- 7.Liston G. E., Sturm M., A snow-transport model for complex terrain. J. Glaciol. 44, 498–516 (1998). [Google Scholar]
- 8.Gillette D. A., Passi R., Modeling dust emission caused by wind erosion. J. Geophys. Res. Atmos. 93, 14233–14242 (1988). [Google Scholar]
- 9.Prospero J. M., Ginoux P., Torres O., Nicholson S. E., Gill T. E., Environmental characterization of global sources of atmospheric soil dust identified with the NIMBUS 7 Total Ozone Mapping Spectrometer (TOMS) absorbing aerosol product. Rev. Geophys. 40, 2-1–2-31 (2002). [Google Scholar]
- 10.Ravi S., D’Odorico P., Breshears D. D., Field J. P., Goudie A. S., Huxman T. E., Li J., Okin G. S., Swap R. J., Thomas A. D., Van Pelt S., Whicker J. J., Zobeck T. M., Aeolian processes and the biosphere. Rev. Geophys. 49, RG3001 (2011). [Google Scholar]
- 11.Creamean J. M., Suski K. J., Rosenfeld D., Cazorla A., DeMott P. J., Sullivan R. C., White A. B., Ralph F. M., Minnis P., Comstock J. M., Tomlinson J. M., Prather K. A., Dust and biological aerosols from the Sahara and Asia influence precipitation in the Western U.S. Science 339, 1572–1578 (2013). [DOI] [PubMed] [Google Scholar]
- 12.Mahowald N. M., Kloster S., Engelstaedter S., Moore J. K., Mukhopadhyay S., McConnell J. R., Albani S., Doney S. C., Bhattacharya A., Curran M. A. J., Flanner M. G., Hoffman F. M., Lawrence D. M., Lindsay K., Mayewski P. A., Neff J., Rothenberg D., Thomas E., Thornton P. E., Zender C. S., Observed 20th century desert dust variability: Impact on climate and biogeochemistry. Atmos. Chem. Phys. 10, 10875–10893 (2010). [Google Scholar]
- 13.Prospero J. M., Blades E., Mathison G., Naidu R., Interhemispheric transport of viable fungi and bacteria from Africa to the Caribbean with soil dust. Aerobiologia 21, 1–19 (2005). [Google Scholar]
- 14.Jerolmack D. J., Mohrig D., Grotzinger J. P., Fike D. A., Watters W. A., Spatial grain size sorting in eolian ripples and estimation of wind conditions on planetary surfaces: Application to Meridiani Planum, Mars. J. Geophys. Res. Planets 111, E12S02 (2006). [Google Scholar]
- 15.Bridges N. T., Ayoub F., Avouac J.-P., Leprince S., Lucas A., Mattson S., Earth-like sand fluxes on Mars. Nature 485, 339–342 (2012). [DOI] [PubMed] [Google Scholar]
- 16.Jackson D. W. T., Bourke M. C., Smyth T. A. G., The dune effect on sand-transporting winds on Mars. Nat. Commun. 6, 8796 (2015). [DOI] [PMC free article] [PubMed] [Google Scholar]
- 17.Barchyn T. E., Martin R. L., Kok J. F., Hugenholtz C. H., Fundamental mismatches between measurements and models in aeolian sediment transport prediction: The role of small-scale variability. Aeolian Res. 15, 245–251 (2014). [Google Scholar]
- 18.R. A. Bagnold, The Physics of Blown Sand and Desert Dunes (Dover, 1941). [Google Scholar]
- 19.Kawamura R., Study of sand movement by wind. Rep. Inst. Sci. Technol. 5, 95–112 (1951). [Google Scholar]
- 20.Owen P. R., Saltation of uniform grains in air. J. Fluid Mech. 20, 225–242 (1964). [Google Scholar]
- 21.White B. R., Soil transport by winds on Mars. J. Geophys. Res. 84, 4643–4651 (1979). [Google Scholar]
- 22.Ungar J. E., Haff P. K., Steady state saltation in air. Sedimentology 34, 289–299 (1987). [Google Scholar]
- 23.Andreotti B., A two-species model of aeolian sand transport. J. Fluid Mech. 510, 47–70 (2004). [Google Scholar]
- 24.Anderson R. S., Haff P. K., Simulation of eolian saltation. Science 241, 820–823 (1988). [DOI] [PubMed] [Google Scholar]
- 25.Werner B. T., A steady-state model of wind-blown sand transport. J. Geol. 98, 1–17 (1990). [Google Scholar]
- 26.Kok J. F., Parteli E. J. R., Michaels T. I., Karam D. B., The physics of wind-blown sand and dust. Rep. Prog. Phys. 75, 106901 (2012). [DOI] [PubMed] [Google Scholar]
- 27.Valance A., Rasmussen K. R., El Moctar A. O., Dupont P., The physics of Aeolian sand transport. C. R. Phys. 16, 105–117 (2015). [Google Scholar]
- 28.Sauermann G., Kroy K., Herrmann H. J., Continuum saltation model for sand dunes. Phys. Rev. E 64, 031305 (2001). [DOI] [PubMed] [Google Scholar]
- 29.Durán O., Herrmann H., Modelling of saturated sand flux. J. Stat. Mech. Theory Exp. 2006, P07011 (2006). [Google Scholar]
- 30.Ho T. D., Valance A., Dupont P., El Moctar A. O., Scaling laws in aeolian sand transport. Phys. Rev. Lett. 106, 094501 (2011). [DOI] [PubMed] [Google Scholar]
- 31.Durán O., Andreotti B., Claudin P., Numerical simulation of turbulent sediment transport, from bed load to saltation. Phys. Fluids 24, 103306 (2012). [Google Scholar]
- 32.Li B., Neuman C. M., Boundary-layer turbulence characteristics during aeolian saltation. Geophys. Res. Lett. 39, L11402 (2012). [Google Scholar]
- 33.Walter B., Horender S., Voegeli C., Lehning M., Experimental assessment of Owen’s second hypothesis on surface shear stress induced by a fluid during sediment saltation. Geophys. Res. Lett. 41, 6298–6305 (2014). [Google Scholar]
- 34.Jenkins J. T., Valance A., Periodic trajectories in aeolian sand transport. Phys. Fluids 26, 073301 (2014). [Google Scholar]
- 35.Durán O., Claudin P., Andreotti B., On aeolian transport: Grain-scale interactions, dynamical mechanisms and scaling laws. Aeolian Res. 3, 243–270 (2011). [Google Scholar]
- 36.Nalpanis P., Hunt J. C. R., Barrett C. F., Saltating particles over flat beds. J. Fluid Mech. 251, 661–685 (1993). [Google Scholar]
- 37.Rasmussen K. R., Sørensen M., Vertical variation of particle speed and flux density in aeolian saltation: Measurement and modeling. J. Geophys. Res. Earth Surf. 113, F02S12 (2008). [Google Scholar]
- 38.Ho T. D., Dupont P., El Moctar A. O., Valance A., Particle velocity distribution in saltation transport. Phys. Rev. E 85, 052301 (2012). [DOI] [PubMed] [Google Scholar]
- 39.Ho T. D., Valance A., Dupont P., El Moctar A. O., Aeolian sand transport: Length and height distributions of saltation trajectories. Aeolian Res. 12, 65–74 (2014). [Google Scholar]
- 40.Creyssels M., Dupont P., El Moctar A. O., Valance A., Cantat I., Jenkins J. T., Pasini J. M., Rasmussen K. R., Saltating particles in a turbulent boundary layer: Experiment and theory. J. Fluid Mech. 625, 47–74 (2009). [Google Scholar]
- 41.Dong Z., Liu X., Wang X., Li F., Zhao A., Experimental investigation of the velocity of a sand cloud blowing over a sandy surface. Earth Surf. Process. Landf. 29, 343–358 (2004). [Google Scholar]
- 42.Liu X., Dong Z., Experimental investigation of the concentration profile of a blowing sand cloud. Geomorphology 60, 371–381 (2004). [Google Scholar]
- 43.Dong Z., Qian G., Luo W., Wang H., Analysis of the mass flux profiles of an aeolian saltating cloud. J. Geophys. Res. Atmos. 111, D16111 (2006). [Google Scholar]
- 44.Shao Y., Raupach M. R., The overshoot and equilibration of saltation. J. Geophys. Res. 97, 20559–20564 (1992). [Google Scholar]
- 45.Rasmussen K. R., Valance A., Merrison J., Laboratory studies of aeolian sediment transport processes on planetary surfaces. Geomorphology 244, 74–94 (2015). [Google Scholar]
- 46.Martin R. L., Barchyn T. E., Hugenholtz C. H., Jerolmack D. J., Timescale dependence of aeolian sand flux observations under atmospheric turbulence. J. Geophys. Res. Atmos. 118, 9078–9092 (2013). [Google Scholar]
- 47.Webb N. P., Galloza M. S., Zobeck T. M., Herrick J. E., Threshold wind velocity dynamics as a driver of aeolian sediment mass flux. Aeolian Res. 20, 45–58 (2016). [Google Scholar]
- 48.Sterk G., Jacobs A. F. G., Van Boxel J. H., The effect of turbulent flow structures on saltation sand transport in the atmospheric boundary layer. Earth Surf. Process. Landf. 23, 877–887 (1998). [Google Scholar]
- 49.Baas A. C. W., Wavelet power spectra of aeolian sand transport by boundary layer turbulence. Geophys. Res. Lett. 33, L05403 (2006). [Google Scholar]
- 50.Sherman D. J., Jackson D. W. T., Namikas S. L., Wang J., Wind-blown sand on beaches: An evaluation of models. Geomorphology 22, 113–133 (1998). [Google Scholar]
- 51.Sherman D. J., Li B., Predicting aeolian sand transport rates: A reevaluation of models. Aeolian Res. 3, 371–378 (2012). [Google Scholar]
- 52.Y. Shao, Physics and Modelling of Wind Erosion (Springer, 2008). [Google Scholar]
- 53.B. Marticorena, Dust production mechanisms, in Mineral Dust: A Key Player in the Earth System, P. Knippertz, J.-B.W. Stuut, Eds. (Springer, 2014), pp. 93–120. [Google Scholar]
- 54.N. Lancaster, Geomorphology of Desert Dunes (Routledge, 1995). [Google Scholar]
- 55.K. Pye, H. Tsoar, Aeolian Sand and Sand Dunes (Springer, 2009). [Google Scholar]
- 56.van Boxel J. H., Sterk G., Arens S. M., Sonic anemometers in aeolian sediment transport research. Geomorphology 59, 131–147 (2004). [Google Scholar]
- 57.Greeley R., Blumberg D. G., Williams S. H., Field measurements of the flux and speed of wind-blown sand. Sedimentology 43, 41–52 (1996). [Google Scholar]
- 58.Namikas S. L., Field measurement and numerical modelling of aeolian mass flux distributions on a sandy beach. Sedimentology 50, 303–326 (2003). [Google Scholar]
- 59.Farrell E. J., Sherman D. J., Ellis J. T., Li B., Vertical distribution of grain size for wind blown sand. Aeolian Res. 7, 51–61 (2012). [Google Scholar]
- 60.Namikas S. L., A conceptual model of energy partitioning in the collision of saltating grains with an unconsolidated sediment bed. J. Coast. Res. 225, 1250–1259 (2006). [Google Scholar]
- 61.Kok J. F., An improved parameterization of wind-blown sand flux on Mars that includes the effect of hysteresis. Geophys. Res. Lett. 37, L12202 (2010). [Google Scholar]
- 62.Martin R. L., Kok J. F., Field measurements demonstrate distinct initiation and cessation thresholds governing aeolian sediment transport flux. arXiv:1610.10059v3 (2017). [Google Scholar]
- 63.Neuman C. M., Scott M. M., A wind tunnel study of the influence of pore water on aeolian sediment transport. J. Arid Environ. 39, 403–419 (1998). [Google Scholar]
- 64.Marusic I., Mathis R., Hutchins N., Predictive model for wall-bounded turbulent flow. Science 329, 193–196 (2010). [DOI] [PubMed] [Google Scholar]
- 65.Farrell E. J., Sherman D. J., Process-scaling issues for aeolian transport modelling in field and wind tunnel experiments: Roughness length and mass flux distributions. J. Coast. Res. 1, 384–389 (2006). [Google Scholar]
- 66.Kok J. F., Renno N. O., Electrostatics in wind-blown sand. Phys. Rev. Lett. 100, 014501 (2008). [DOI] [PubMed] [Google Scholar]
- 67.Sørensen M., McEwan I., On the effect of mid-air collisions on aeolian saltation. Sedimentology 43, 65–76 (1996). [Google Scholar]
- 68.Carneiro M. V., Araújo N. A. M., Pähtz T., Herrmann H. J., Midair collisions enhance saltation. Phys. Rev. Lett. 111, 058001 (2013). [DOI] [PubMed] [Google Scholar]
- 69.Bauer B. O., Davidson-Arnott R. G. D., Aeolian particle flux profiles and transport unsteadiness. J. Geophys. Res. Earth Surf. 119, 1542–1563 (2014). [Google Scholar]
- 70.Kok J. F., Renno N. O., A comprehensive numerical model of steady state saltation (COMSALT). J. Geophys. Res. Atmos. 114, D17204 (2009). [Google Scholar]
- 71.Fernandez Luque R., Van Beek R., Erosion and transport of bed-load sediment. J. Hydraul. Res. 14, 127–144 (1976). [Google Scholar]
- 72.Lajeunesse E., Malverti L., Charru F., Bed load transport in turbulent flow at the grain scale: Experiments and modeling. J. Geophys. Res. Earth Surf. 115, F04001 (2010). [Google Scholar]
- 73.Niño Y., García M., Ayala L., Gravel saltation: 1. Experiments. Water Resour. Res. 30, 1907–1914 (1994). [Google Scholar]
- 74.Wiberg P. L., Smith J. D., A theoretical model for saltating grains in water. J. Geophys. Res. 90, 7341–7354 (1985). [Google Scholar]
- 75.Drake T. G., Shreve R. L., Dietrich W. E., Whiting P. J., Leopold L. B., Bedload transport of fine gravel observed by motion-picture photography. J. Fluid Mech. 192, 193–217 (1988). [Google Scholar]
- 76.Pähtz T., Durán O., Fluid forces or impacts, what governs the entrainment of soil particles in sediment transport mediated by a Newtonian fluid? arXiv:1605.07306v5 (2017). [Google Scholar]
- 77.Pähtz T., Durán O., Unified threshold model suggests sediment transport by wind on Triton, Pluto, and comet 67P. arXiv:1602.07079v6 (2017). [Google Scholar]
- 78.Berzi D., Jenkins J. T., Valance A., Periodic saltation over hydrodynamically rough beds: Aeolian to aquatic. J. Fluid Mech. 786, 190–209 (2016). [Google Scholar]
- 79.R. D. Lorenz, J. R. Zimbelman, Dune Worlds (Springer, 2014). [Google Scholar]
- 80.Mulholland D. P., Spiga A., Listowski C., Read P. L., An assessment of the impact of local processes on dust lifting in martian climate models. Icarus 252, 212–227 (2015). [Google Scholar]
- 81.Kok J. F., Difference in the wind speeds required for initiation versus continuation of sand transport on Mars: Implications for dunes and dust storms. Phys. Rev. Lett. 104, 074502 (2010). [DOI] [PubMed] [Google Scholar]
- 82.Ayoub F., Avouac J.-P., Newman C. E., Richardson M. I., Lucas A., Leprince S., Bridges N. T., Threshold for sand mobility on Mars calibrated from seasonal variations of sand flux. Nat. Commun. 5, 5096 (2014). [DOI] [PubMed] [Google Scholar]
- 83.Martin R. L., Kok J. F., Chamecki M., Comprehensive field campaigns illustrate new methods for characterizing high-frequency variability in aeolian saltation flux. arXiv:1609.08707v2 (2017). [Google Scholar]
- 84.Kok J. F., Mahowald N. M., Fratini G., Gillies J. A., Ishizuka M., Leys J. F., Mikami M., Park M.-S., Park S.-U., Van Pelt R. S., Zobeck T. M., An improved dust emission model—Part 1: Model description and comparison against measurements. Atmos. Chem. Phys. 14, 13023–13041 (2014). [Google Scholar]
- 85.Barchyn T. E., Hugenholtz C. H., Li B., Neuman C. M., Sanderson R. S., From particle counts to flux: Wind tunnel testing and calibration of the ‘Wenglor’ aeolian sediment transport sensor. Aeolian Res. 15, 311–318 (2014). [Google Scholar]
- 86.Goossens D., Offer Z., London G., Wind tunnel and field calibration of five aeolian sand traps. Geomorphology 35, 233–252 (2000). [Google Scholar]
- 87.Salesky S. T., Chamecki M., Dias N. L., Estimating the random error in eddy-covariance based fluxes and other turbulence statistics: The filtering method. Bound.-Layer Meteorol. 144, 113–135 (2012). [Google Scholar]
- 88.Li B., Sherman D. J., Farrell E. J., Ellis J. T., Variability of the apparent von Karman parameter during aeolian saltation. Geophys. Res. Lett. 37, L15404 (2010). [Google Scholar]
- 89.Lee Z. S., Baas A. C. W., Variable and conflicting shear stress estimates inside a boundary layer with sediment transport. Earth Surf. Process. Landf. 41, 435–445 (2016). [Google Scholar]
- 90.P. R. Bevington, D. K. Robinson, Data Reduction and Error Analysis for the Physical Sciences (McGraw-Hill, ed. 3, 2003). [Google Scholar]
- 91.Ellis J. T., Li B., Farrell E. J., Sherman D. J., Protocols for characterizing aeolian mass-flux profiles. Aeolian Res. 1, 19–26 (2009). [Google Scholar]
- 92.Dong Z., Lv P., Zhang Z., Qian G., Luo W., Aeolian transport in the field: A comparison of the effects of different surface treatments. J. Geophys. Res. 117, D09210 (2012). [Google Scholar]
Associated Data
This section collects any data citations, data availability statements, or supplementary materials included in this article.
Supplementary Materials
Supplementary material for this article is available at http://advances.sciencemag.org/cgi/content/full/3/6/e1602569/DC1
Supplementary Text
fig. S1. Wind angle θ versus shear stress τ over individual 30-min intervals at the three field sites.
fig. S2. Stability parameter versus shear stress τ over individual 30-min intervals at the three field sites.
fig. S3. Typical 30-min vertical profile of saltation flux.
fig. S4. Thirty-minute values of saltation layer height zq versus shear velocity u* at the three field sites.
fig. S5. Thirty-minute values of saltation mass flux Q versus wind shear stress τ at the three field sites.
fig. S6. SD of saltation flux values within individual stress bins i, SDQi, versus bin-averaged saltation fluxes, Qi.
data file S1. Excel spreadsheet (.xlsx) containing unbinned 30-min values for shear velocity u*, shear stress τ, wind direction θ, stability parameter z/L, saltation layer height zq, total saltation flux Q, saltation detection frequency fQ, and associated uncertainties for all of these values (except θ, z/L, and fQ) for each field site.
data file S2. Excel spreadsheet (.xlsx) containing binned 30-min values for shear velocity u*, shear stress τ, excess shear stress τex, saltation layer height zq, total saltation flux Q, normalized saltation flux , saltation detection frequency fQ, and associated uncertainties for all of these values.