

Summary
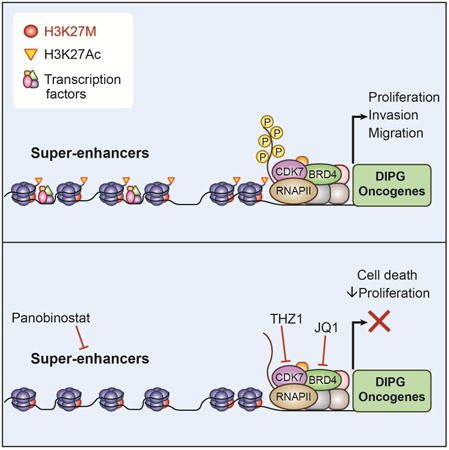
Diffuse intrinsic pontine glioma (DIPG) is a fatal pediatric cancer with limited therapeutic options. The majority of cases of DIPG exhibit a mutation in histone-3 (H3K27M) that results in oncogenic transcriptional aberrancies. We show here that DIPG is vulnerable to transcriptional disruption using bromodomain inhibition or CDK7 blockade. Targeting oncogenic transcription through either of these methods synergizes with HDAC inhibition and DIPG cells resistant to HDAC inhibitor therapy retain sensitivity to CDK7 blockade. Identification of super-enhancers in DIPG provides insights toward the cell of origin, highlighting oligodendroglial lineage genes, and reveals unexpected mechanisms mediating tumor viability and invasion, including potassium channel function and EPH receptor signaling. The findings presented demonstrate transcriptional vulnerabilities and elucidate previously unknown mechanisms of DIPG pathobiology.
Keywords: DIPG, CDK7, BRD4, EPH, super-enhancer, potassium channel, oligodendrocyte precursor cell
Graphical abstract
Introduction
Diffuse intrinsic pontine glioma (DIPG) is a universally fatal central nervous system (CNS) cancer that is the leading cause of brain tumor-related death in children (Ostrom et al. 2015). As complete resection is not possible and conventional chemotherapy is ineffective, the standard of care remains radiation alone. Recent genomic studies have revealed that ∼80% of DIPG tumors exhibit a characteristic mutation of lysine 27 to methionine (K27M) in genes encoding histone H3.3 and H3.1 and subsequent aberrant transcription (Bender et al. 2013; Chan et al. 2013; Khuong-Quang et al. 2012; Lewis et al. 2013; Schwartzentruber et al. 2012; Taylor et al. 2014; Wu et al. 2012). The H3K27M mutation results in perturbation of Polycomb repressive complex 2 (PRC2) function, resulting in global hypomethylation of K27 in all H3 variants (Lewis et al. 2013; Bender et al. 2013; Wu et al. 2012) and broad epigenetic dysregulation believed to be central to DIPG oncogenesis (Bender et al. 2013; Chan et al. 2013; Lewis et al. 2013; Venneti et al. 2013; Funato et al. 2014).
We previously identified panobinostat, a multiple histone deacetylase (HDAC) inhibitor, as an effective agent against DIPG patient-derived cell cultures and xenograft models (Grasso et al. 2015). Panobinostat restored H3K27me3 (Grasso et al. 2015), likely via disruption of aberrant PRC2 inhibition through polyacetylation of nearby residues and subsequent blockade of K27M-PRC2 interactions (Brown et al. 2014). Large transcriptional changes were observed with panobinostat treatment, including rescue of many gene expression aberrations associated with the K27M mutation (Grasso et al. 2015). However, DIPG resistance to HDAC inhibition ultimately develops (Grasso et al. 2015), highlighting the importance of advancing drug combinations or identifying alternative strategies to more potently disrupt oncogenic gene expression.
An effective strategy in many preclinical models of malignancy with transcriptional dysregulation has been to disrupt efficient RNA polymerase II (RNAPII) transcription through inhibition of chromatin readers and writers (Posternak & Cole 2016; Hagenbuchner & Ausserlechner 2016). This has commonly been done through BET (bromodomain and extra-terminal) protein inhibition, targeting family member BRD4 (Lovén et al. 2013; Delmore et al. 2011; Dawson et al. 2011; Filippakopoulos & Knapp 2014; Mertz et al. 2011; Zuber et al. 2011; Coudé et al. 2015; Picaud et al. 2015; D. Sengupta et al. 2015; S. Sengupta et al. 2015; Shahbazi et al. 2016; Zhang et al. 2016; Bid et al. 2016), a key activator of RNAPII transcription at active chromatin marks (Jang et al. 2005; LeRoy et al. 2008; Rahman et al. 2011). An alternative target is CDK7, a member of the cyclin-dependent kinase family involved in regulation of RNAPII phosphorylation, controlling transcriptional initiation, pausing, and elongation (Fisher & Morgan 1994; Glover-Cutter et al. 2009; Larochelle et al. 2007; Larochelle et al. 2012; Rossignol et al. 1997; Serizawa et al. 1995). THZ1 is a highly specific CDK7 inhibitor effective in preclinical models for malignancies with transcription factor dysregulation, such as T-cell acute lymphoblastic leukemia (Kwiatkowski et al. 2014), small cell lung carcinoma (Christensen et al. 2014), neuroblastoma (Chipumuro et al. 2014), and triple-negative breast cancer (Wang et al. 2015). In this study, we investigate the efficacy of single and combinatorial targeting of transcription in DIPG, as well as characterize gene expression and active chromatin elements in an effort to identify core genes regulating DIPG oncogenesis.
Results
Bromodomain inhibition disrupts in vitro DIPG cell viability and in vivo tumor growth
JQ1, a tool compound, is a thoroughly studied inhibitor of bromodomain activity with efficacy in a number of preclinical models (Filippakopoulos & Knapp 2014; Mertz et al. 2011; Zuber et al. 2011; Bid et al. 2016; Coudé et al. 2015; Picaud et al. 2015; D. Sengupta et al. 2015; S. Sengupta et al. 2015; Shahbazi et al. 2016; Zhang et al. 2016). Many of the cancers studied to date that demonstrate sensitivity to transcriptional disruption exhibit MYC or MYCN amplification or overexpression. A subset of DIPGs exhibits MYC/MYCN amplification, with MYCN amplification observed chiefly in tumors that do not exhibit the H3K27M mutation and MYC amplification observed less frequently in H3K27M mutant tumors (Buczkowicz et al. 2014). A larger subset exhibits high levels of MYC/MYCN expression (Grasso et al. 2015 and Figure S1A). However, transcriptional dysregulation in DIPG is chiefly driven by the H3K27M mutation (Bender et al. 2013; Chan et al. 2013; Lewis et al. 2013; Venneti et al. 2013; Funato et al. 2014). Given this well-established aberrancy, we hypothesized that DIPG may be vulnerable to transcriptional disruption. Eight patient-derived DIPG cultures and one pediatric cortical glioblastoma culture (SU-pcGBM2) were used in this study; seven of the eight DIPGs exhibit the H3K27M mutation and one is histone WT. (H3.3K27M: SU-DIPG-VI, SU-DIPG-XIII-P, SU-DIPG-XVII, SU-DIPG-XXV, SF7761 and JHH-DIPG1. H3.1K27M: SU-DIPG-IV. H3WT and MYCN amplified: VUMC-DIPG-10; Table S1, S2). SU-pcGBM2 is histone-3 WT and exhibits a TP53 mutation and EGFR amplification (Table S1; Venkatesh et al. 2015). To confirm and extend the observation that BET inhibition reduces DIPG cell viability (Taylor et al. 2015), we treated these patient-derived cell cultures with a range of concentrations of JQ1 and observed a dose-dependent reduction in DIPG cell viability across all cell cultures, particularly at later time points (72-hour IC50 >1 mM in most cultures, 6-day IC50 median: 0.35 μM, range: 0.076 – 2.06 mM; Figure 1A and S1B). Interestingly, while the H3WT culture VUMC-DIPG-10 responded to JQ1 treatment similarly to other DIPG cultures, the H3WT pediatric glioblastoma cell culture SU-pcGBM2 showed minimal vulnerability to JQ1 treatment (Figure 1A). While few conclusions can be drawn from the limited number of H3WT DIPG cultures available for study, H3WT DIPGs may be vulnerable to transcriptional disruption when carrying a MYC/MYCN amplification whereas H3K27M DIPGs harbor sensitivity due to the H3K27M oncogenic effect on transcription. Time-course tracking of JQ1-treated DIPG cells indicated that the inhibitory effect of JQ1 against DIPG cells is more cytostatic than cytocidal (Figure 1B, Figure S1C). Indeed, FACS analyses showed inhibition of cell proliferation (Figure 1C), and only a moderate increase in apoptosis following JQ1 exposure (Figure 1D).
Figure 1. BRD4 inhibition inhibits DIPG growth in vitro and in vivo.
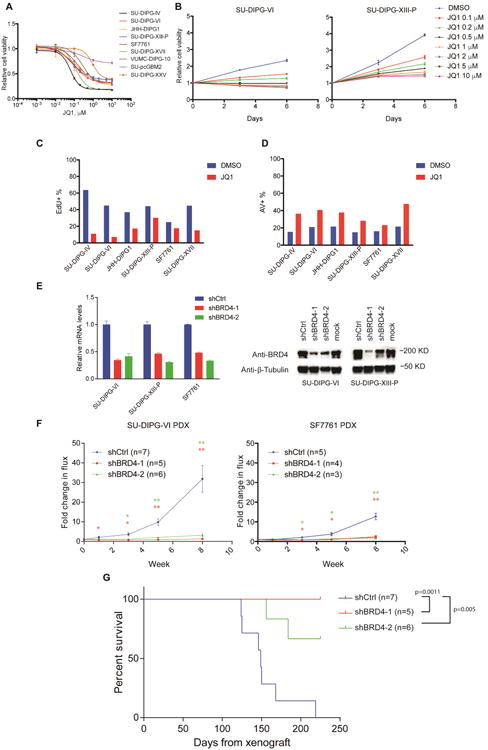
A) Patient-derived DIPG cultures and pediatric GBM culture SU-pcGBM2 treated with JQ1 as indicated for 6 days. Cell viabilities normalized to 0.1% DMSO control values (n=3 wells per data point). B) DIPG cells treated with JQ1 at indicated concentrations or 0.1% DMSO control. Cell viabilities measured at 0, 3 and 6 days of treatment and normalized to day 0 values (n=3 wells per data point). C) EdU incorporation of DIPG cells treated with 0.1% DMSO or 1 μM JQ1 for 48 hours. D) Annexin V (AV)/DAPI staining of DIPG cells treated with 0.1% DMSO or 1 μM JQ1 for 72 hours. E) DIPG cells infected either of two clones of shBRD4 (shBD4-1 or shBRD4-2) or control construct (shCtrl) lentivirus. Knockdown efficiency by RT-qPCR (left, n=2) or Western Blot (right). F) SU-DIPG-VI cells (left) and SF7761 cells (right) infected with lentivirus expressing shBRD4-1, shBRD4-2 or shCtrl were implanted in the brainstem at P2 and allowed to engraft for 4 weeks. Tumor growth of DIPG xenografts were then monitored by IVIS imaging at week 0, 1, 3, 5 and 8. For SU-DIPG-VI: shCtrl n=7 mice, shBRD4-1 n=5 mice, shBRD4-2 n=6 mice. For SF7761: shCtrl n=5 mice, shBRD4-1 n=4 mice, shBRD4-2 n=3 mice. Data shown normalized to week 0 value for each group; error bars, s.e.m. *p < 0. 0.5; **p < 0.01 (Two-tailed Student's t-test). G) Survival curves of xenografted mice implanted with SU-DIPG-VI cells infected with lentivirus expressing shBRD4-1, shBRD4-2 or shCtrl construct. Log-rank analyses were performed to calculate the p value comparing shCtrl and shBRD4 groups (shCtrl n=7 mice. shBRD4-1 n=5 mice, shBRD4-2 n=6 mice). Data are shown as mean ± SD unless otherwise indicated. FACS analyses shown in bar plots (C, D) illustrate one representative experiment. See also Figure S1 and Tables S1-S3.
We next tested the effect of bromodomain inhibitor drugs presently in clinical development, iBET762 (Mirguet et al. 2013) and OTX015 (Coudé et al. 2015). At 72 hours of treatment, DIPG cells largely demonstrated IC50 values greater than 1 μM, suggesting these drugs are not sufficiently potent for clinical translation, but a modest dose-dependent inhibition of cell viability at six days of treatment (Figure S1D-E). Brain penetration studies indicated that OTX015 levels achieved in brain (∼150 nM; Table S3) following standard in vivo dosing are only a fraction of the 72-hour IC50 for DIPG cells. While these relatively high IC50 values and insufficient brain penetration indicate that these specific agents lack the potency necessary for clinical translation in DIPG, the data suggest that DIPG cells may be sensitive to loss of bromodomain activity in principle.
To determine the therapeutic potential of effective bromodomain inhibition, we tested the effects of BRD4 loss in DIPG orthotopic xenograft models. Patient-derived DIPG cell cultures expressing firefly luciferase, SU-DIPG-VI-luc and SF7761-luc (Grasso et al. 2015; Hashizume et al. 2014), were infected with a vector expressing either shRNA targeting BRD4 or a non-targeting control (Figure 1E). BRD4 knockdown resulted in decreased proliferation and slowed DIPG cell growth in vitro, and did not alter luciferase expression or in vivo engraftment (Figure S1F–I). Accordingly, mice xenografted with DIPG cells expressing BRD4 shRNA showed a stark reduction in tumor growth and improved survival relative to mice xenografted with cells expressing the non-targeting control (Figure 1F-G). BRD4 function thus appears to be necessary for DIPG growth in vivo, underscoring the potential that effective bromodomain inhibition holds for DIPG therapy when appropriate pharmacological agents become available.
CDK7 inhibition with THZ1 impairs DIPG growth
We next sought to determine whether alternative methods of disrupting transcription could be effective in DIPG. We found that THZ1 robustly reduced DIPG cell viability in a dose-dependent manner, with a median 72-hour IC50 of 56 nM in eight patient–derived DIPG cell cultures tested (range: 28 to 533 nM) (Figure 2A-B; Figure S2A), consistent with IC50 concentrations reported in other malignant models (Christensen et al. 2014; Jiang et al. 2016). Similar to bromodomain inhibition, the SU-pcGBM2 culture was somewhat less vulnerable to CDK7 inhibition (IC50 640 nM). Patient-derived DIPG cells exhibited robustly decreased proliferation (Figure 2C) and increased apoptosis (Figure 2D) following THZ1 exposure. Consistently, we observed loss of RNAPII CTD phosphorylation 24 hours after THZ1 treatment (Figure 2E), indicating effective CDK7 inhibition. Disruption of RNAPII transcription through CDK7 inhibition thus appears to potently disrupt DIPG cell viability.
Figure 2. CDK7 inhibitor THZ1 disrupts DIPG growth.
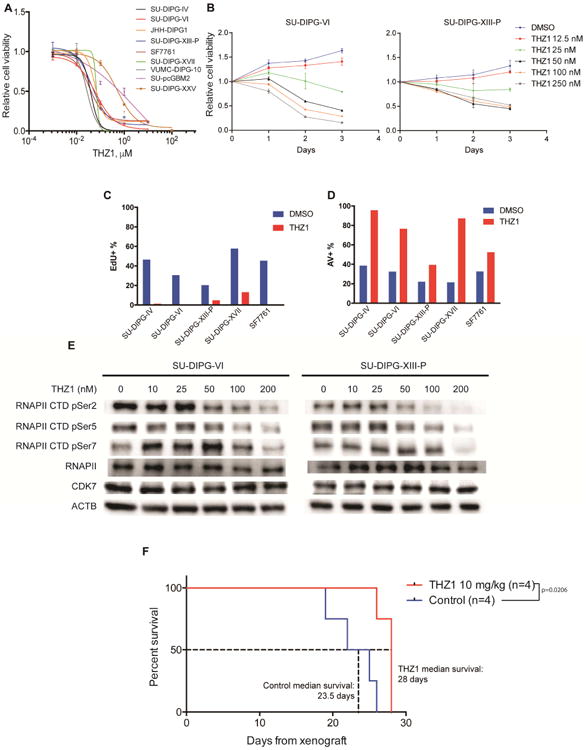
A) Patient-derived DIPG cultures (SU-DIPG-IV, SU-DIPG-VI, JHH-DIPG1, SU-DIPG-XIII-P, SF7761, SU-DIPG-XVII, VUMC-DIPG-10, SU-DIPG-XXV) and SU-pcGBM2 treated with THZ1 as indicated for 72 hours. Cell viabilities normalized to 0.1% DMSO control values (n=3 wells per data point). B) SU-DIPG-VI and SU-DIPG-XIII-P cells treated with THZ1 at indicated concentrations or 0.1% DMSO control. Cell viabilities measured at 0, 1, 2 and 3 days of treatment and normalized to day 0 values (n=3 wells per data point). C) EdU incorporation by DIPG cells treated with 0.1% DMSO or 0.1 μM THZ1 for 20 hours. D) Annexin V (AV)/DAPI staining of DIPG cells treated with 0.1% DMSO or 0.1 μM THZ1 for 48 hours. E) SU-DIPG-VI and SU-DIPG-XIII-P cells treated with THZ1 as indicated for 24 hours. Western blot analyses for phosphorylation levels at Ser2, Ser5 and Ser7 of RNA polymerase II C-terminal domain (RNAPII CTD). Total levels of RNAPII, CDK7 and beta-actin (ACTB) also measured as control. F) SU-DIPG-XIII-P* cells were xenografted to the pons at postnatal day 43 (P43) and allowed to engraft for 10 days prior to treatment. SU-DIPG-XIII-P* represents a particularly aggressive subclone of the SU-DIPG-XIII-P culture. Mice were treated with THZ1 at 10 mg/kg i.p. twice daily. Log-rank analyses were performed to calculate the p value, comparing vehicle treated and THZ1 treated groups (vehicle n=4 mice, THZ1 n=4 mice). Data are shown as mean ± SD unless otherwise indicated. FACS analysis shown in bar plots (C, D) for one representative experiment. See also Figure S2 and Table S3.
To determine if THZ1 could be used for brain tumors, we quantified brain penetration and observed an average THZ1 brain parenchymal concentration of 13.7 ng/g or approximately 24 nM following i.p. dosing, and approximately 600 nM following i.v. dosing (Table S3). Given the relative potency of the agent against DIPG, we tested the efficacy of THZ1 in two patient-derived orthotopic xenograft models, SU-DIPG-VI and SU-DIPG-XIII-FL (derived from the frontal lobe DIPG metastasis in subject SU-DIPG-XIII). Our ability to administer THZ1 i.v. was limited by tail vein sclerosis to only one week, but we observed proof-of-principle reduction in DIPG xenograft growth (Figure S2B). Similar to epigenetic modifying agents studied in previous publications (Tang et al. 2014; Grasso et al. 2015), we observed an increase in relative luciferase activity with in vitro THZ1 treatment (Figure S2C), suggesting that our in vivo observation of reduced luciferase levels was not due to a reduction in transcription of luciferase but rather a decrease in tumor burden.
Next, we turned to i.p. dosing of THZ1 in a particularly aggressive patient-derived DIPG xenograft model (SU-DIPG-XIII-P*). THZ1 administration resulted in a significant but modest (∼20%) increase in median survival when compared to vehicle-treated control mice (Figure 2F). Taken together, this suggests that DIPG is vulnerable to CDK7 inhibition both in vitro and in vivo, with better brain tissue delivery required for optimal clinical translation.
Combinatorial transcriptional therapy in DIPG
Our previous work showed that the FDA-approved drug panobinostat exhibits a degree preclinical benefit against DIPG (Grasso et al. 2015) and is presently in phase I clinical trial for children with DIPG (NCT02717455). A recent study similarly demonstrated a modest benefit of panobinostat in a murine DIPG model evident by reduced tumor cell proliferation (Hennika et al. 2017). We hypothesized that stronger disruption of DIPG cell viability may come from combinatorial treatment with both HDAC inhibition and disruption of RNAPII-dependent transcription. HDAC inhibition together with JQ1 or THZ1 synergistically reduced cell viability across multiple DIPG cell cultures (Figure 3A-B, Figure S3A-B), and proved more effective in inhibiting proliferation and inducing apoptosis Figure S3D-E). Synergistic inhibition of cell viability with JQ1 and THZ1 combinatorial treatment was observed as well (Figure S3C).
Figure 3. JQ1 and THZ1 synergize with HDACi against DIPG.
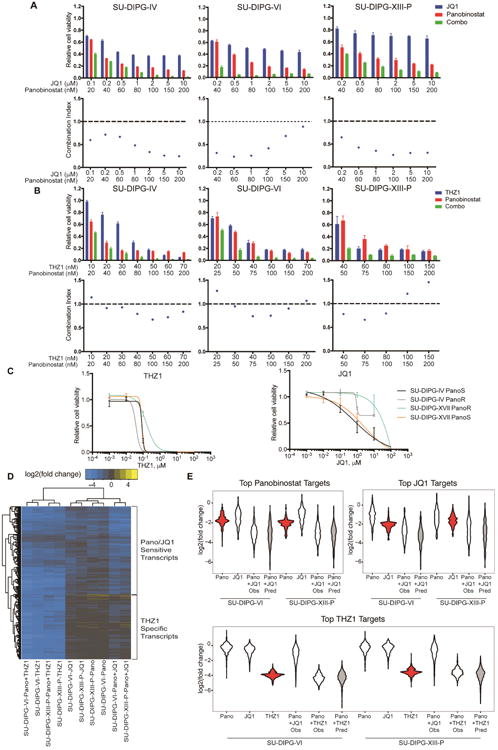
A, B) Viability and synergy in combinatorial drug treatments. DIPG cultures treated with JQ1 (A) or THZ1 (B) and panobinostat individually or in combination at indicated concentrations for 72 hours. (top) Cell viabilities were measured and normalized to 0.1% DMSO control values (n=3 wells per data point). (bottom) Combination index value (CI) of each drug combination condition was calculated by using CalcuSyn software. CI less than 1 indicated synergy between two drugs. C) Panobinostat-resistant cells (PanoR) were generated by chronic treatment at IC50 concentration for 21 days. Cells were treated as indicated for 3 days and normalized to DMSO control (n=3 wells per data point). D) Log2(fold change) over DMSO control of the top 10% of panobinostat and JQ1 downregulated genes and top 5% of THZ1 downregulated genes active in both cultures. Cells were treated with panobinostat (100 nM), JQ1 (1 μM), and THZ1 (100 nM) for 24 hours. E) Violin plots showing log2(fold change) of the top 10% downregulated panobinostat and JQ1 targets and top 5% downregulated THZ1 targets. Gray plots indicate the predicted log2(fold change) assuming an additive interaction of single treatments. Red plots highlight the response of the top target genes of each category in single treatment. Data are shown as mean ± SD unless otherwise indicated. See also Figure S3.
As treatment with panobinostat ultimately results in resistance (Grasso et al. 2015), we hypothesized that transcription in these resistant cells may be disrupted through bromodomain or CDK7 inhibition. We generated panobinostat-resistant (PanoR) cells as previously described (Grasso et al. 2015) and found that panobinostat-resistant cells retained sub-micromolar sensitivity to THZ1 (Figure 3C). In contrast, cells resistant to panobinostat also exhibit resistance to JQ1 (Figure 3C). This shared resistance suggests similar mechanisms of disrupting cellular viability between panobinostat and JQ1.
To better understand the interaction of these therapies, we characterized the genes disrupted by panobinostat, JQ1, and THZ1. We performed RNA-sequencing (RNA-seq) after 24 hours of treatment with panobinostat, THZ1, or JQ1 alone or in combination. As in other malignant models (Chipumuro et al. 2014; Christensen et al. 2014; Kwiatkowski et al. 2014), we observed global downregulation of active transcripts with THZ1 treatment (Figure S3F) and downregulation of specific subsets of genes by JQ1 (Figure S3F; Delmore et al. 2011; Dawson et al. 2011).
We then examined the top target genes of panobinostat, JQ1, and THZ1. Unsupervised hierarchical clustering revealed that panobinostat and JQ1 caused similar transcriptional changes, downregulating many of the same genes and clustering apart from cells treated with THZ1 (Figure 3D-E), thus explaining the shared resistance described above. By contrast, the top targets of THZ1 showed very little disruption with panobinostat or JQ1. Combinatorial treatment of panobinostat with JQ1 or THZ1 resulted in the greatest downregulation of each of these genes, with changes consistent with an additive effect of single agent treatments. Thus, panobinostat and JQ1 may synergistically disrupt cell viability by creating stronger inhibition at a common set of genes than either single treatment. In contrast, panobinostat and THZ1 preferentially disrupt distinct sets of genes and may achieve synergy by disrupting a larger number of genes in combination than in single treatment.
To further understand the mechanisms mediating cell viability disruption, we performed Gene Ontology analysis on the top downregulated target genes of each drug (Figure S3G). THZ1-treated cells showed preferential disruption of genes related to transcription and gene regulation, such as ETS1, ELF4, MGA, SOX10, and HES5. In contrast, both JQ1 and panobinostat disrupted key regulators of nervous system development, including NTRK3, LINGO1, ASCL1, SYT4, SYT17, MYT1, MYRF, SALL3. Additionally, both drugs disrupted genes that enriched for synapse organization and structure, with one panobinostat target being NLGN3, a key mechanism mediating neuronal activity-regulated glioma growth (Venkatesh et al. 2015).
Together, these data show that targeting RNAPII-dependent transcription in conjunction with HDAC inhibition is more effective than either drug alone. Panobinostat-resistant cells retain sensitivity to THZ1, suggesting that CDK7 blockade together with HDAC inhibition may be a promising combination strategy for DIPG.
Identification of super-enhancers in DIPG reveals potential therapeutic targets and cell identity genes
CDK7 and bromodomain inhibition both preferentially disrupt transcription at genes associated with super-enhancers (Lovén et al. 2013; Chipumuro et al. 2014; Christensen et al. 2014; Jiang et al. 2016). Super-enhancers (SEs) are large clusters of enhancer elements displaying unusually high levels of activating marks, such as H3K27 acetylation (H3K27Ac), and transcription complex subunit binding, including RNAPII and BRD4 (Whyte et al. 2013). The genes associated with SEs in cancer are enriched for both drivers of oncogenic state as well as normal regulators of cell identity (Lovén et al. 2013; Hnisz et al. 2013). Given the effectiveness of these therapies in inhibiting DIPG growth, we characterized the SE landscape of DIPG through H3K27Ac chromatin immunoprecipitation followed by high-throughput sequencing (ChIP-seq) in three DIPG H3.3K27M cultures (SU-DIPG-VI, SU-DIPG-XIII-P, SU-DIPG-XVII) and one H3.1K27M mutant (SU-DIPG-IV) culture, and annotated each SE with its nearest transcription start site (TSS) (Figure 4A, B; full list Table S4). A number of the genes associated with SEs were markers of undifferentiated neural cell state, including SOX2 and NES. Many were genes of oligodendroglial lineage identity, including genes classically associated with oligodendrocyte precursor cells such as SOX10, CSPG4 (also known as NG2), NKX2.2, PDGFRA, OLIG2 and LINGO1, as well as genes expressed by oligodendroglial lineage cells during differentiation such as OLIG1, MYRF, MYT1, and MBP. These findings lend support to the notion that DIPG may originate from a precursor cell early in differentiation in the oligodendroglial lineage (Monje et al. 2011; Tate et al. 2015).
Figure 4. Identification of super-enhancers in DIPG.
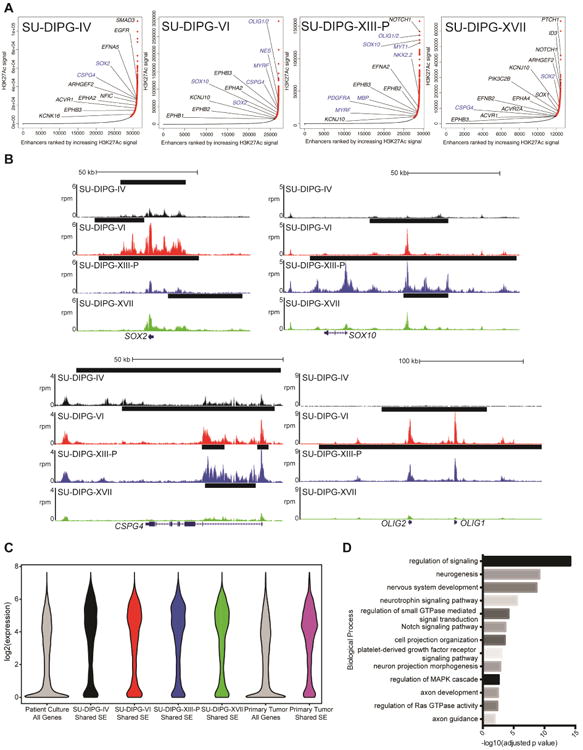
A) Enhancers ranked by H3K27Ac signal over input. SEs are marked in red and regular enhancers are indicated in black. Genes in blue represent genes informative toward cell identity. B) ChIP-seq profiles for SE-associated genes. The x-axis represents genomic position and y-axis represents normalized reads per million (rpm). Black bars represent SE calls. C) Expression of shared SE-associated genes. Log2 transformed expression values for each cell-culture were plotted for all genes or the nearest RefSeq gene to each shared SE. Primary tumor values is analysis of previously published data (Grasso et al. 2015). D) Gene Ontology Biological Processes associated with shared SE-associated genes. Identified by GREAT analysis with binomial FDR adjusted p values reported. See also Table S4.
To identify commonalities in DIPG biology, we considered shared SEs between four cultures, defined as overlapping SEs present in at least three of the cultures studied. When linked to gene expression levels quantified by RNA-seq (Figure 4C), we observed that the genes associated with these shared SEs represent a set of transcripts highly expressed in both culture and in previously published primary tissue, likely identifying a core set of genes controlling both DIPG cell identity and malignant state. We then performed Genomic Regions Enrichment of Annotations Tool (GREAT) analysis (McLean et al. 2010) on all shared SE regions (Figure 4D) and observed enrichment for regulators of CNS differentiation and neurogenesis, as well as genes controlling axon guidance and neuron projection morphogenesis.
Regulators of signal transduction were also heavily enriched. As super-enhancers in malignant cells often mark key pathways maintaining oncogenic state, we examined the pathways associated with these genes using PANTHER analysis (Mi et al. 2016; Figure 5A). This may represent a key list for developing targeted therapy in DIPG. Consistent with this notion, we observed enrichment for a number of pathways previously described as dysregulated and important to DIPG biology, including NOTCH (Taylor et al. 2015), Hedgehog (Monje et al. 2011), and PDGF (Paugh et al. 2013). These signaling pathways enriched for common downstream kinases (MAPK1, MAPK3K1, MAP3K2, MAPK8, MAPK11, MAPAPK2, PRKCA, PRKCD, PRKCE, PRKCZ). As EGF, FGF, Ras, Hedgehog and other of these signaling pathways converge upon MAPK/ERK and mTOR signaling (Cristea & Sage 2016; Switon et al. 2016; Kim et al. 2016; McCubrey et al. 2016), we hypothesized that targeting these downstream pathways may be an effective way to simultaneously disrupt multiple oncogenic pathways. Cell viability was disrupted in two out of four cell-cultures when treated with ERK1/2 inhibitor SCH772984 (Morris et al. 2013) and all four cell-cultures with dual mTORC1/2 inhibitor AZD8055 (Chresta et al. 2010) at sub-micromolar concentrations (AZD8055: median IC50 0.12 mM; Figure 5B).
Figure 5. Super-enhancers reveal families essential to DIPG cell viability.
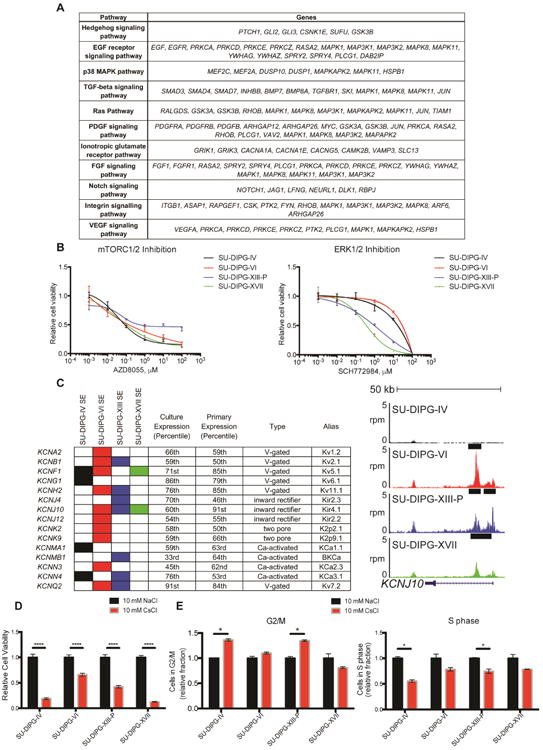
A) Table of select pathways enriched in SE-associated genes. Enriched pathways identified by PANTHER pathway analysis of genes in the “signal transduction” term from Figure 4D. B) Cultures were treated with AZD8055 or SCH772984 as indicated for 72 hours. Cell viabilities were normalized to 1% DMSO control values. Data are shown as mean ± SD (n=3 or 4 wells per data point). C) Filled in rectangles represent association with a SE in the indicated cell culture. Expression percentiles shown for mean expression value either in four cell cultures indicated or SU-DIPG primary tumor samples published in Grasso et al. 2015. For genome tracks shown, the x-axis represents genomic position and y-axis shows normalized reads per million (rpm). Black bars represent SE calls. D) Patient-derived DIPG cultures were treated with 10 mM cesium chloride or sodium chloride for 3 days. Cell viabilities were normalized to NaCl controls, p value < 0.001 for all data shown. E) FACS cell cycle analysis of DIPG cultures treated with 10 mM NaCl or CsCl for 10 hours before addition of EdU for 1 hour. Data is shown as proportion of cells in G2/M normalized to NaCl control. Data are shown in (D, E) as mean ± s.e.m (n=3). Student's t-test was performed with Holm-Sidak correction, * indicates adjusted p value less than 0.05. See also Figure S4.
We found a large number of potassium (K+) channel genes associated with SEs in DIPG (Figure 5C). Preclinical work in lung and breast cancers (Sun et al. 2016), as well as medulloblastoma (Huang et al. 2015), has shown targeting of K+ channels to be therapeutically effective. As we observed a large number K+ channels across a variety of channel families (voltage-gated, inward rectifying, two pore, Ca2+-activated) to be expressed in DIPG, we targeted all K+ channels using 10 mM cesium chloride (CsCl). CsCl specifically blocks the pores of K+ channels and is an agent standardly used in electrophysiology for specific K+ channel blockade without acute toxicity to normal brain tissue (Walz et al. 2002). When compared to equimolar sodium chloride, controlling for changes in chloride content and overall osmolarity, we found that 10 mM CsCl reduced DIPG cell viability in all four DIPG cell cultures tested (Figure 5D, S4A). Interestingly, many K+ channel genes exhibited strong downregulation with all three transcriptional therapies (Figure S4B), potentially accounting for part of the disruption of cell viability that these drugs display. As K+ channels play roles in regulating membrane voltage and cell size changes during cell cycle (Huang & Jan 2014), we hypothesized that their blockade may disrupt the ability of DIPG cells to progress through the cell cycle. After 10 hours of CsCl treatment, we did not observe a difference in the number of dead cells (Figure S4C-E) but rather a significant increase in the fraction of DIPG cells in G2/M with a decrease in the fraction of cells in S phase in two of the cultures tested (Figure 5E). Considering that we observed a decrease in viability in all four cultures tested, we believe disruption of cell cycle progression accounts only for part of the mechanism of K+ channel blockade vulnerability in DIPG. Taken together, these data indicate that targeting K+ channels disrupts DIPG cell growth and underscore K+ channels as a target in DIPG.
EPH receptor signaling plays a role in DIPG cell migration and invasion
GREAT analysis of shared SEs exhibited enrichment for genes controlling neuron projection and axon guidance (Figure 4D). A number of ephrin and EPH receptors were associated with SEs in all four patient-derived cell cultures (Figure 6A). EPH-ephrin signaling classically plays a role in axon pathfinding during normal neurodevelopment (Cramer et al. 2016; Hruska & Dalva 2012; Xu & Henkemeyer 2012) and represents a promising target in a number of central nervous system malignancies including medulloblastoma, ependymoma and adult glioblastoma (Bhatia et al. 2015; Chen et al. 2015; Miao et al. 2015; Nakada et al. 2004; Nakada et al. 2006). To study the role of EPH-ephrin signaling in DIPG, we used LDN-211904 (Qiao et al. 2009), a selective inhibitor of forward EPH receptor signaling. Treatment with LDN-211904 did not substantially inhibit cell viability at concentrations less than 10 μM (Figure S5A), but 5 μM LDN-211904 drastically reduced cell invasion in all four DIPG cell cultures tested (Figure 6B, S5B). Furthermore, EPH blockade resulted in a dramatic, dose-dependent reduction in both SU-DIPG-XVII invasion (Figure 6C) and SU-DIPG-IV migration (Figure 6D) in a 3D matrigel spheroid assay (Vinci et al. 2007; Vinci et al. 2015). Many of the EPH receptors and ephrins expressed by SU-DIPG-VI and SU-DIPG-XIII-P did not show downregulation with panobinostat or JQ1 (Figure S5C). This suggests that additional therapy beyond HDAC or bromodomain inhibition would be needed to clinically target the effect of these signaling molecules on DIPG invasion.
Figure 6. EPH signaling is important to DIPG invasion.
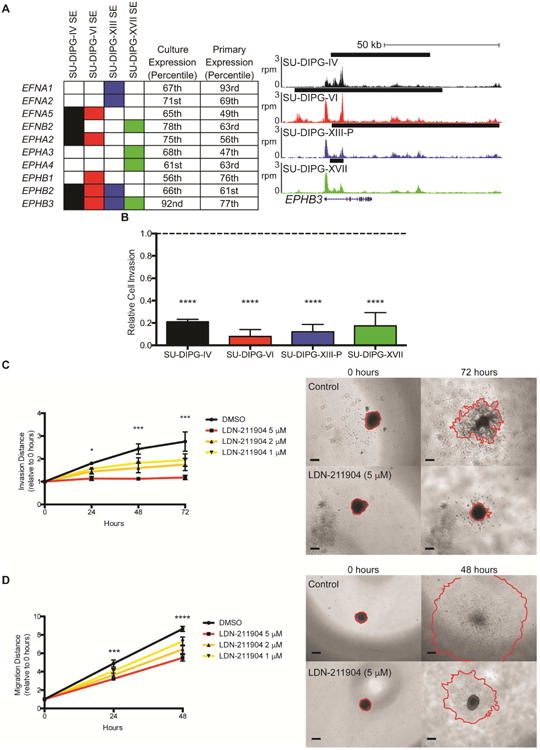
A) EPH receptors and ephrins associated with a SE in DIPG. Filled in rectangles represent association with a SE in the indicated cell culture. Expression percentiles shown for mean expression value either in the four cell cultures indicated or SU-DIPG primary tumor samples published in Grasso et al. 2015. For genome tracks shown, the x-axis represents genomic position and y-axis shows normalized reads per million (rpm). Black bars represent SE calls. B) Transwell matrigel invasion following treatment with LDN-211904 (5 μM). Invading cell quantification was normalized to mean DMSO invasion. p value vs DMSO: SU-DIPG-IV 0.0006, SU-DIPG-VI 0.0003, SU-DIPG-XIII-P 0.0004, SU-DIPG-XVII 0.0004. C) (left) Quantification of invasion distance of SU-DIPG-XVII cells treated with LDN-211904 at the concentrations indicated or DMSO control. Invasion distance normalized to Day 0 distance for each sphere. p values of DMSO vs 5 mM LDN-211904: 24 hours = 0.0311, 48 hours = 0.0005, 72 hours = 0.0001. (right) Representative images of spheroid invasion at 0 and 72 hours, with leading edge outlined in red. Scale bars = 200 μm. D) (left) Quantification of migration distance of SU-DIPG-IV cells treated with LDN-211904 at the concentrations indicated or DMSO control. Migration distance normalized to Day 0 distance for each sphere. Student's two-tailed t-test (FDR = 0.05) between DMSO and 5 μM LDN-211904, * indicates FDR-adjusted p value < 0.05. (right) Representative images of spheroid migration at 0 and 48 hours, with leading edge outlined in red. Scale bars = 200 μm. Data shown as mean ± s.e.m. (n=3); Student's t-test with Holm-Sidak adjustment unless otherwise indicated. See also Figure S5.
Overall, we show here that blockade of EPH receptor signaling significantly reduces DIPG cell migration and invasion in vitro. EPH-ephrin signaling may represent an important pathogenic mechanism facilitating the diffuse and invasive spread of DIPG throughout the brainstem and, in most cases of DIPG, throughout much of the brain (Caretti et al. 2014).
Panobinostat and THZ1 disrupt super-enhancer biology
We found the set of SE-associated genes in SU-DIPG-VI and SU-DIPG-XIII-P to be enriched in the set of downregulated targets of both JQ1 and THZ1 (Figure S6A-B), consistent with previous findings (Christensen et al. 2014; Chipumuro et al. 2014; Lovén et al. 2013), as well as panobinostat. As panobinostat increases H3K27me3 levels (Grasso et al. 2015), we hypothesized that panobinostat may disrupt the H3K27Ac mark at SEs. Consistent with this notion, H3K27Ac ChIP-seq following 24 hours of panobinostat treatment resulted in reduced enrichment of H3K27Ac at SEs (Figure 7A,B). When examining all H3K27Ac peaks, we observed that panobinostat reduced H3K27Ac density selectively at the strongest regions in control cells (Figure 7C), with most peaks showing little change. The genes associated with these regions showed enrichment for the top panobinostat target genes (Figure S6C-D), consistent with the proposed mechanism of panobinostat. When we examined the distance of these panobinostat target genes from the nearest TSS, we saw a large proportion of the sites located distal to any TSS (Figure 7D), suggesting that panobinostat disrupts H3K27Ac at both enhancer and promoter regions.
Figure 7. Disruption of super-enhancers with panobinostat and THZ1.
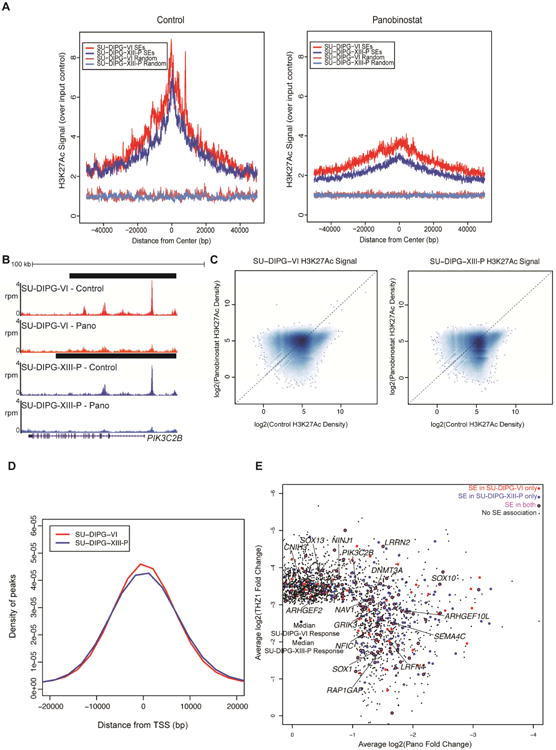
A) SU-DIPG-VI or SU-DIPG-XIII-P cultures treated with panobinostat for 24 hours. H3K27Ac ChIP-seq enrichment over input was plotted for all SEs or an equivalent number of randomly generated regions of median length. B) Representative example of H3K27Ac at an SE before and after panobinostat administration; x-axis represents genomic position and y-axis shows normalized reads per million (rpm). Black bars represent SE calls. C) Log2 transformed H3K27Ac signal density plotted for all peaks identified. Dashed line marks equivalent signal in both DMSO control and panobinostat treated samples. Higher density of points indicated by darker shading. D) Distance was calculated between differential H3K27Ac peaks with the strongest levels of H3K27Ac density in control treated cells and the nearest TSS. The x-axis represents distance from the closest TSS in bp and y-axis represents probability density. E) Top targets in DIPG. Scatter of active transcripts showing greater than two-fold reduction with panobinostat and greater than eight-fold reduction with THZ1 treatment in both cultures. Plotted values are the mean log2(fold change) between SU-DIPG-VI and SU-DIPG-XIII-P. Transcripts shown in magenta are associated with an SE in both cell cultures, shown in red are associated with an SE in SU-DIPG-VI only, and shown in blue are associated with an SE in SU-DIPG-XIII-P only. Black points are transcripts with no SE association. See also Figures S6 and Table S5.
Finally, in order to identify core regulators of DIPG malignant state, we looked for SE-associated genes strongly disrupted in both SU-DIPG-VI and SU-DIPG-XIII-P with panobinostat (at least two-fold) or THZ1 treatment (at least eight-fold; Figure 7E; Figure S6E). Forty-eight shared panobinostat targets were associated with a SE in both SU-DIPG-VI and SU-DIPG-XIII-P and 41 shared THZ1-sensitive genes were linked to SEs in both cell cultures (Table S5). We believe these sets of genes to be fundamental to DIPG biology. Intriguingly, these gene sets also contained a number of genes involved in axonal guidance (NAV1, SEMA4C; Maes et al. 2002; Martínez-López et al. 2005; Maier et al. 2011), neurite outgrowth (NINJ1; Araki et al. 1997; Araki & Milbrandt 1996), synapse formation (LRFN4; Mah et al. 2010), and glutamate receptor function (CNIH3, GRIK3; Herring et al. 2013; Strutz et al. 2001; Figure S6F). These genes classically associated with neuronal communication suggest that DIPG cell interaction with neurons in the tumor microenvironment may be central to DIPG biology and reinforces the notion that disruption of neuron-glioma interactions represents a prime target for therapeutic development (Venkatesh et al., 2015).
Discussion
No progress has been made in extending life for children with DIPG since the introduction of radiotherapy nearly four decades ago. However, a surge in DIPG research in recent years may prove to turn the tide. Comprehensive genomic studies identified the oncohistone H3K27M as the hallmark of pediatric gliomas affecting the midline of the central nervous system (Wu et al. 2012; Schwartzentruber et al. 2012; Khuong-Quang et al. 2012; Gessi et al. 2015; Shankar et al. 2016). Central to DIPG oncogenesis (Funato et al. 2014), the presence of H3K27M mutant histones alters the function of the PRC2 complex responsible for H3K27 trimethylation (Lewis et al. 2013) and results in broad dysregulation of transcription (Chan et al. 2013). The creation of patient-derived DIPG cell culture and orthotopic xenograft models has allowed for preclinical drug testing studies, revealing epigenetic therapies, such as histone demethylase inhibition (Hashizume et al 2014) and HDAC inhibition with panobinostat (Grasso et al. 2015), as promising therapeutic strategies. Panobinostat was subsequently taken to phase I trial for children with DIPG (NCT02717455). While panobinostat may ultimately prove to be of clinical utility, it was clear from the preclinical studies that the best hope for this agent would be a temporary reprieve from tumor growth (Grasso et al. 2015; Hennika et al. 2017), as resistance to mono-agent therapy does develop (Grasso et al. 2015). The present study represents an effort to identify a combination strategy focused on complementary modulation of H3K27M-related transcriptional aberrations that would extend and improve on the efficacy of panobinostat alone.
The data presented here demonstrate that DIPG is vulnerable to disruption of transcription both in vitro and in vivo. As previously shown, transcriptional inhibition mediated by JQ1 bromodomain inhibition impedes DIPG cell viability in vitro (Taylor et al. 2015). We expand upon this finding by examining a range of bromodomain inhibitors and by demonstrating BRD4 as the key target using shRNA-mediated BRD4 knockdown. Our findings are consistent with a predicted role for BRD4 in H3K27M transcriptional pathology based on the observation that Brd1 and Brd4 are associated with H3K27M-containing nucleosomes in a drosophila model of H3K27M expression (Herz et al. 2014). While more potent bromodomain inhibitor compounds exhibiting better brain penetration are needed for clinical translation of these findings, bromodomain inhibition may be an effective clinical therapy when the proper drugs are available. However, it is important to note that bromodomain inhibition appears cytostatic rather than cytocidal and that DIPG cells resistant to HDAC inhibition exhibit concomitant resistance to bromodomain inhibition as well.
Disruption of transcription through CDK7 inhibition using THZ1 also impairs DIPG cell viability. The effect of CDK7 inhibition is cytocidal, and THZ1 therapy results in a modest increase in survival in a patient-derived DIPG xenograft model. However, CDK7 inhibitors with better brain penetration are needed for optimal clinical translation. Transcriptional inhibition via either BRD4 or CDK7 blockade shows therapeutic synergy with HDAC inhibition using panobinostat and panobinostat-resistant DIPG cells retain vulnerability to THZ1. Thus, a combination strategy may prove to be of clinical utility when brain penetrant transcriptional inhibitor compounds are available for clinical use or with alternative delivery strategies such as direct intratumoral infusion using convection enhanced delivery (CED).
Transcriptomic analyses following treatment with single and combinatorial panobinostat, JQ1, and THZ1 therapy provided insights as to how these epigenetic modifying agents disrupt gene expression. SE-associated genes were preferentially disrupted by all three therapies and the H3K27Ac mark was lost at SEs following panobinostat treatment. We found that the top targets JQ1 and panobinostat were similar, potentially explaining our finding that panobinostat-resistant cells display functional resistance to JQ1 as well. By contrast, the set of genes identified as the top targets of THZ1 is only mildly inhibited by panobinostat or JQ1 treatment. As BRD family proteins couple activating histone marks to transcription (Wu & Chiang 2007; LeRoy et al. 2008; Rahman et al. 2011), we hypothesize that JQ1 and panobinostat may synergistically inhibit DIPG viability through orthogonal disruption of a common set of core genes, with JQ1 disrupting BRD4 activity at active histone marks and panobinostat restoring K27me3 at the same set of marks. By contrast, the set of genes disproportionately downregulated by THZ1 treatment are largely non-overlapping with the targets of panobinostat and synergy may be achieved in combinatorial treatment by a disrupting a larger overall number of genes than in single therapy.
To elucidate the chromatin landscape of DIPG, we performed ChIP-seq analyses of four patient-derived cell cultures. As nearly 80% of DIPG patients exhibit the K27M mutation in H3.3 or H3.1 (Khuong-Quang et al. 2012; Schwartzentruber et al. 2012; Wu et al. 2012), which has been shown to cause global histone hypomethylation (Bender et al. 2013; Lewis et al. 2013), the location of activating histone marks such as H3K27Ac may reveal genes that fail to undergo suppression during development and lead to tumor formation. Identification of SEs in DIPG provides insights into the genes maintaining the malignant state of DIPG as well as insights towards the cell of origin. These analyses revealed a large number of oligodendroglial lineage genes associated with SEs in DIPG, including PDGFRA, OLIG1, OLIG2, NKX2.2, CSPG4 and SOX10 amongst others, as well several genes marking an early neural precursor state, such as SOX2 and NES, supporting a leading hypothesis that the cell of origin of DIPG may be an early oligodendrocyte precursor cell (Monje et al. 2011; Tate et al. 2015).
The SE analyses highlighted numerous genes classically involved in neurodevelopment or neuronal communication, underscoring the recently demonstrated importance of neuron-glioma interactions (Venkatesh et al 2015) and the emerging concept that pediatric gliomas hijack and recapitulate mechanisms of development. Prominent were axon pathfinding genes, such as a number of EPH receptors and ephrins. Functional analyses demonstrated that this canonical axon pathfinding pathway plays a robust role in DIPG cell migration and invasion. These findings are consistent with the invasion-promoting roles of the EPH-ephrin pathway in adult gliobastoma (Nakada et al. 2004; Nakada et al. 2006; Miao et al. 2015). We also found a large number of K+ channel genes associated with SEs and demonstrated that, like several other cancers (Sun et al. 2016), DIPG cells are vulnerable to K+ channel blockade. These genomic findings provide a deeper understanding of DIPG pathobiology and elucidate potential targets for DIPG therapy. Although the number of potential targets dysregulated in DIPG suggests that epigenetic therapies that simultaneously disrupt aberrant expression of numerous target genes may be required as a part of any effective therapeutic strategy, some of the genes identified as upregulated and functionally important, such as EPH-ephrins, were not downregulated by the transcriptional inhibitors studied here and may require targeted therapy.
In summary, the data presented here demonstrate that disruption of transcription is a promising therapeutic strategy for DIPG when drugs with sufficient brain penetration are developed, particularly when administered together with an HDAC inhibitor. DIPG super-enhancer analyses support the hypothesis that the cell of origin for DIPG is a precursor cell in the oligodendroglial lineage and uncover several vulnerabilities of DIPG, elucidating fundamental pathological mechanisms promoting DIPG growth and invasion.
STAR Methods
Contact For Reagent And Resource Sharing
Further information and requests for resources and reagents should be directed to and will be fulfilled by the Lead Contact, Michelle Monje (mmonje@stanford.edu) with the exception of the VUMC-DIPG-10 line as it was obtained with a standard institutional material transfer agreement (MTA) through Esther Hulleman (e.hulleman@vumc.nl) at the VU University Medical Center. SU-DIPG and SU-pcGBM2 cells will be distributed through the Monje lab with an MTA with Stanford University.
Experimental Model and Subject Details
Patient-derived DIPG cell cultures
All human cell cultures were generated with informed consent and in compliance with Institutional Review Board (IRB)-approved protocols. Patient-derived primary DIPG cell culture models (SU-DIPG-IV: H3.1-K27M; SU-DIPG-VI/XIII-P, JHH-DIPG1, SF7761: H3.3-K27M) have been previously described (Grasso et al. 2015; Hashizume et al. 2012; Table S1). SU-DIPG-XIII-FL cells were cultured at the time of autopsy from a frontal lobe metastasis in subject SU-DIPG-XIII (Table S1). The pontine tumor from subject SU-DIPG-XIII, also cultured at the time of autopsy, is named SU-DIPG-XIII-P. VUMC-DIPG-10 (Table S1) was similarly derived at the time of autopsy. JHH-DIPG1 cells were provided by Dr. Eric Raabe at Johns Hopkins University; SF7761 cells were provided by Dr. Rinataro Hashizume and Dr. C. David James at Northwestern University. SU-DIPG cultures were generated in the Monje Laboratory at Stanford University. SU-DIPG-XVII and SU-DIPG-XXV are newly established H3.3-K27M DIPG primary cell culture derived from DIPG autopsy tissue. All cultures are grown as tumor neurospheres in Tumor Stem Media (TSM) consisting of DMEM/F12 (Invitrogen, Carlsbad, CA), Neurobasal(-A) (Invitrogen, Carlsbad, CA), B27(-A) (Invitrogen, Carlsbad, CA), human-bFGF (20 ng/ml) (Shenandoah Biotech, Warwick, PA), human-EGF (20 ng/ml) (Shenandoah, Biotech, Warwick, PA), human PDGF-AB (20ng/ml) (Shenandoah, Biotech, Warwick, PA) and heparin (10 ng/ml). Histone mutational status was determined using Sanger sequencing for the H3F3A and HIST1H3B genes. Cell cultures were validated by DNA fingerprinting using short tandem repeat (STR) analysis (Table S2) and checked for mycoplasma contamination. STR fingerprinting is performed on all cultures routinely every ∼3 months to confirm veracity of cultures.
DIPG orthotopic xenograft model and drug testing
All animal procedures were performed with APLAC approval and adhered to the NIH guide for the care and use of laboratory animals. Both male and female animals were used equally. Animals were randomized to control and treatment groups such that each group had equivalent distribution of initial tumor sizes.
Patient-derived pontine DIPG xenografts were performed as previously described (Grasso et al. 2015). Briefly, a single cell suspension was made from DIPG neurospheres and cells were injected stereotactically into the fourth ventricle/pons of NOD-SCID-IL2 gamma chain-deficient cold-anesthetized mouse pups on postnatal day 2 (P2) or isfluorane-anesthetized mice on P43. SU-DIPG-VI and SU-DIPG-XIII-FL xenografts were performed on P2 mouse pups through a 31-gauge burr hole (coordinates: 3 mm posterior to lambda suture and 3 mm deep) using 100,000 cells in 2 μL total volume. SU-DIPG-XIII-P* xenografts were performed on postnatal day 43 (P43) mice through a 26-gauge burr hole (coordinates: 0.8 mm to right of midline, 0.5 mm posterior to lambda and 5 mm deep) using 400,000 cells in 2 μL total volume.
Administration of THZ1 was performed systemically with intravenous tail vein or intraperitoneal injection (as indicated) five days per week (M-F) at 10 mg/kg. THZ1 stock solutions were dissolved in DMSO at 10 mg/mL and dilute to 1 mg/mL in dextrose (5%) before administration. For IVIS imaging analyses of in vivo DIPG tumor growth, animals were imaged at baseline and excluded if no tumors were present. For survival studies, morbidity criteria used were either: reduction of weight by 20% initial weight, or severe neurological motor deficits consistent with brainstem dysfunction (i.e. hemiplegia or an incessant stereotyped circling behavior seen with ventral midbrain dysfunction).
Method Details
Cell viability and combinatorial drug synergy
JQ1, panobinostat, OTX015, iBET762, AZD8055, and SCH772984 were purchased from Selleckchem (Houston, TX, USA). THZ1 and LDN-211904 were purchased from Millipore (Billerica, MA, USA). For cell viability measurement, cells were plated into 96-well plates in at least triplicate and then subjected to drug treatment as indicated. Cell viability was then measured by using Celltiter Glo assay (G7571, Promega, WI, USA), and data were collected on a TECAN Infinite 200 plate reader. For testing combinatory effects of two drugs, the cells were treated with each drug individually or in combination before subjecting to Celltiter Glo assay. CalcuSyn software (Biosoft, Cambridge, UK) was used to calculate the combination index (CI). CI less than 1.0 was considered to be synergistic.
Proliferation, apoptosis, and cell cycle assays
Cell proliferation and cell cycle phase was measured by using the Click-iT EdU Alexa Fluor 488 or 647 Flow Cytometry Assay Kit (Invitrogen, CA, USA). EdU+ population represented the proliferating cell population. Cell apoptosis was measured by using Annexin V-FITC Apoptosis Detection Kit II (556570, BD Biosciences, CA, USA) with some minor modifications. DAPI was used instead of PI. Cell cycle analysis additionally used LIVE/DEAD Near-IR (Life Technologies, L10119) to mark dead cells and DAPI to label nuclei after fixation and permeabilization. FACS analyses were performed by using BD Fortessa FACS machine (BD Biosciences, CA, USA). The data were analyzed using Flowjo software (FlowJo, LLC, OR, USA).
Lentivirus preparation and infection
Two shRNA expressing lentiviral constructs against human BRD4 (TRCN0000021425 and TRCN0000021426) from the RNAi consortium human collection were purchased from Sigma. Lentiviral particles were generated by co-transfection of lentiviral expressing constructs with packaging plasmids (pDelta 8.92 + VSV-G) into 293T cells, and then concentrated by polyethylene glycol (PEG) precipitation method. For lentiviral infection, dissociated DIPG cells were incubated with shRNA expressing lentivirus for 16 h before replacing with fresh medium. Puromycin (0.5 ug/ml) was added to select positively infected cells for further experiments at 48 hours post infection. For in vivo xenograft experiments, no puromycin selection was performed.
Western blotting
Cells were lysed in RIPA Buffer with 1mM PMSF, protease inhibitor cocktail, 1mM sodium orthovanadate, (Santa Cruz Biotechnology sc-24948) and protein concentration was calculated using Pierce™ BCA™ Protein Assay (Thermo Scientific™). Samples were diluted with 1 volume to 2× Laemmli Sample Buffer (Novex), 20% 2-mercaptoethanol. Gel electrophoresis was performed using SDS-PAGE and proteins were transferred to Immun-Blot PVDF Membrane (BioRad) using Mini-PROTEAN Tetra Cell (BioRad). Membranes were incubated with following primary antibodies for 16-20 hours at 4°C: RNAPII (1:100, Santa Cruz Biotechnologies #sc-899), RNAPII-CTD-SER2 (1:10,000, Bethyl #A300-654A-M), RNAPII-CTD-SER5 (1:2000, Bethyl #A304-408A-M), RNAPII-CTD-SER7 (1:500, Cell Signaling 13780S), CDK7 (1:10,000, Bethyl #A300-405A), Beta-Actin (1:2000, Cell Signaling #4970S), BRD4 (1:5000, Bethyl #A301-985A100), Beta-Tubulin (1:5000, Abcam #ab6046).
LC-MS/MS analysis of tissue and serum concentration
Tissues samples were weighed and 1 volume of bullet blender beads (Next Advance) and 3 volume of Milli-Q water were added. Tissues were homogenized by a bullet blender (Next Advance) at 4°C according to manufacturer's instruction. The neat stock solutions of THZ1, its internal standard (IS) mutant-EGFR-inhibitor (ChemScene, Cat. No.: CS-2099), OTX015 and its IS CPI-203 (ApexBio, Cat. No.: B1081) were prepared in DMSO and further diluted in 50% methanol to prepare spiking solutions. For spiked standard curve, 25 μl of THZ1 spiking solutions (5 ng/ml- 500 ng/ml) or OTX015 spiking solutions (1 ng/ml- 500 ng/ml) was mixed with 25 μl of their corresponding IS (100 ng/ml) and 25 μl of blank tissue homogenate or serum. For samples, the spiking solution was replaced by 25 μl of 50% methanol to make up the volume. After vortexing all standards and samples, 150 μl of methanol/acetonitrile 20:80 (v/v) was added to the mixture and vortexed vigorously for 1 min followed by centrifugation at 3,000 g for 10 min. The supernatant was diluted 3 times with Milli-Q water.
The LC-MS/MS system consists of a QTRAP 4000 mass spectrometer (AB SCIEX) coupled to a Shimadzu UFLC system. LC separation was carried out on a Dionex C18 column (100 mm × 2.1 mm, 5 μm) at room temperature for both compounds. The analysis time was 2 min. The injection volume was 10-25 μl. For THZ1, isocratic elution was carried out with a mobile phase composed of 35% water and 65% acetonitrile with 0.1% of formic acid and 5 mM of ammonium acetate and a flow rate of 0.3 ml/min. For OTX015, isocratic elution was used with a mobile phase composed of 30% water and 70% acetonitrile with 0.1% of formic acid and a flow rate of 0.4 ml/min. The mass spectrometer was operated in the positive mode with multiple-reaction monitoring (MRM). The following MRM transitions were used: THZ1 (m/z 566.2→186.0), IS for THZ1 (m/z 520.4→72.0), OTX015 (m/z 492.3→383.1) and IS for OTX015 (m/z 400.2→383.1). Data acquisition and analysis were performed using the Analyst 1.6.1 software (AB SCIEX).
ChIP and library preparation
Cells were fixed with 1% formaldehyde for 10 minutes at room temperature. Cross-linking was quenched using 0.125M glycine for 10 minutes before cells were washed twice with PBS. Cross-linked pellets were frozen with dry-ice ethanol and stored at -80°C. Two biological replicates were collected for each cell culture.
Pellets were thawed on ice before cell membrane lysis in 5mL LB1 (50mM HEPES pH 8.0, 140mM NaCl, 1mM EDTA, 10% glycerol, 0.5% NP-40, 0.25% Triton X-100, 1mM PMSF, Roche protease inhibitors 11836170001) by rotating for 10 min at 4°C. Nuclei were pelleted at 1350×g for 5 minutes at 4°C. Nuclear lysis was performed in 5 mL LB2 (10mM Tris-Cl pH 8.0, 5M, 200mM NaCl, 1mM EDTA, 0.5mM EGTA, 1mM PMSF, Roche protease inhibitors) by rotating for 10 min at room temperature. Chromatin was pelleted at 1350×g for 5 minutes at 4°C and resuspended in 1.5mL LB3 (10mM Tris-Cl pH 8.0, 100 mM NaCl, 1 mM EDTA, 0.5 mM EGTA, 0.1% Na-Deoxycholate, 0.5% N-lauroylsarcosine, 0.1% SDS, 1 mM PMSF, Roche protease inhibitors). Sonication was performed in a Bioruptor Plus until chromatin was 200-700 bp. Debris was pelleted by centrifugation at 16,500×g for 10 minutes at 4°C. Supernatant was collected and Triton X-100 was added to 1% final concentration. Ten percent of sample was collected as input controls. Antibody targeting H3K27Ac (Active Motif #39133) was added at 5ug per IP to sonicated lysate and rotated at 4°C for 16-20 hours.
Protein G Dynabeads (100 μL per IP) were washed 3× with Block Solution (0.5% BSA in PBS). Antibody bound chromatin was added to beads and rotated 2-4 hours at 4°C. Bead bound chromatin was washed 5× with 1mL RIPA Wash Buffer (50 mM HEPES pH 8.0, 500 mM LiCl, 1mM EDTA, 1% NP-40, 0.7% Na-Deoxycholate) then 1× with 1 mL TE Buffer (10 mM Tris-Cl pH 8.0, 1mM EDTA) with 500mM NaCl. Beads were resuspended in 210 μL Elution Buffer (50 mM Tris-Cl pH 8.0, 10 mM EDTA, 1% SDS) and chromatin was eluted at 65°C for 15 minutes. Beads were magnetized and supernatant was removed to a fresh tube. Immunoprecipitated and input control chromatin was reverse cross-linked at 65°C for 12-16 hours.
Samples were diluted with 1 volume TE Buffer. RNA was digested using 0.2 mg/mL RNase A (Qiagen 19101) for 2 hours at 37°C. CaCl2 was added to 5.25 mM and samples were treated with 0.2 mg/mL Proteinase K (Life Technologies EO0491) for 30 minutes at 55°C. One volume Phenol-Chloroform-Isoamyl alcohol was added and centrifuged 16,500×g for 5 minutes to extract DNA, followed by a second extraction using 1 volume pure chloroform. Aqueous phase was removed and DNA was precipitated using 2 volumes ethanol and 0.3M Na-acetate. DNA pellets were resuspended in EB.
To prepare libraries for sequencing, DNA was end repaired using T4 polymerase (New England Biolabs M0203L), Klenow fragment (NEB M0210L), and T4 polynucleotide kinase (NEB M0201L) for 30 minutes at 20°C. 3′ A-tailing was performed using Exo- Klenow fragment (NEB M0212L) for 30 minutes at 37°C. Illumina TruSeq Pre-Indexed Adaptors (1uM) or NEBNext Illumina Multiplex Oligo Adaptors (NEB E7335S) were ligated for 1 hour at room temperature. Unligated adapters were separated by gel electrophoresis (2.5% agarose, 0.5× TBE) and ligated DNA was purified using a NucleoSpin Gel Clean-up Kit (Macherey-Nagel 740609.250). Ligated DNA was PCR amplified using TruSeq Primers 1.0 and 2.0 or NEBNext Multiplex Primers and purified using AMPure XP beads (Beckman Coulter A63881). Purified libraries were quantified using Agilent 2100 Bioanalyzer HS DNA and multiplexed in equimolar concentrations. Sequencing was performed using an Illumina NextSeq or HiSeq at 2×75 bp by Stanford Functional Genomics Facility.
RNA sequencing
All treatment conditions were collected in biological duplicate. Cells were lysed in Trizol reagent and frozen at -80°C. ERCC spike-in controls were added according to kit guidelines (Thermo 4456740). Total RNA was extracted using chloroform extraction followed by ethanol precipitation and quantified using Qubit.
Selection for polyadenylated (polyA+) RNA was performed using Ambion Dynabeads mRNA Purification Kit (Life Technologies 61006). Briefly, 2.5 μg per sample of total RNA was used for each isolation. Secondary structure was disrupted at 65°C. Ambion oligo(dT) beads were washed twice with Binding Buffer (20 mM Tris-Cl pH 7.5, 1 M LiCl, 2 mM EDTA) then incubated with total RNA. Bound RNA was washed twice with Washing Buffer B (10 mM Tris-Cl pH 7.5, 0.15 M LiCl, 1 mM EDTA) before elution in 10mM Tris-Cl pH 7.5 at 80°C. Purified RNA was purified once more with oligo(dT) beads as described above and eluted in 10 μL 10 mM Tris-Cl pH 7.5. Purified polyA+ RNA was fragmented using Fragmentation Buffer (Ambion, #AM8740) to 150-400 bp) and ethanol precipitated. Fragmented polyA+ RNA was resuspended in water. cDNA was synthesized using Random Hexamer Primers (Invitrogen, #48190-011) and SuperScript II (Invitrogen, #18064-014). Second strand synthesis was performed using DNA Pol I (Invitrogen #18010-025) and RNA was removed using RNaseH (Invitrogen #18021-014). DNA was purified using MinElute PCR Purification Kit (Qiagen, #28004).
Libraries were prepared for sequencing with end repair and A-tailing as described above. NEBNext Illumina Multiplex Oligos were used for indexing and samples were pooled in equimolar amounts. Sequencing was performed using an Illumina NextSeq or HiSeq.
Boyden chamber invasion assays
Invasion of the primary cultures was determined using Biocoat™ Matrigel Invasion Chambers (8.0μm pore size, Corning biosciences). Briefly, dissociated cells were resuspended in growth factor free media and added to the upper chamber of the Transwell insert (0.5-2×10⁵ cells/well) along with media containing either DMSO or inhibitor (3 replicates). The lower chamber was filled with stem cell media (2× standard growth factor concentration), with the addition of either DMSO or inhibitor. The assay was allowed to incubate for 72 hours at 37°C, 5% CO2, 95% humidity. Non-invading cells in the upper insert were removed and cells that had invaded into the lower matrigel surface were fixed with 4% paraformaldyde and stained with 0.1% crystal violet/10% methanol. Crystal violet stained cells were collected using 10% acetic acid from the matrigel surface and measured at an absorbance of 595nm on a NanoDrop spectrophotometer. Relative invasion for each biological replicate was calculated as the fraction of mean LDN-211904 absorbance of all technical replicates over the mean DMSO absorbance of all technical replicates.
3D migration and invasion assays
3D invasion assays were adapted from methods previously described (Vinci et al, 2015). Briefly, cells were seeded at 2×10³/100ul/well in ULA 96-well round-bottomed plates (Corning biosciences) and incubated at 37°C, 5% CO2, 95% humidity to facilitate spheroid formation. After four days incubation, 50ul of media per well was removed and 50 μl of matrigel (Corning biosciences) was added to neurospheres of approx. 200-300 μm in diameter (12 replicates), then incubated at 37°C for 1hr. Once the matrigel solidified, 50 μl/well of stem-cell culture medium containing either DMSO or inhibitor (3× final concentration) was added on top. Starting from time zero, and at 24-hour intervals up to 72 hours images were collected using standard exposure and gamma settings. The degree of cell invasion into the matrigel was quantifed by 6 diameter measurements using Image J and the data plotted as the average distance of invasion.
3D migration assays were similarly performed as previously described (Vinci et al, 2013), with additional modifications. Briefly, cells were seeded at 103/200ul/well in ULA 96-well round-bottomed plates and incubated for four days at 37°C, 5% CO2, 95% humidity to facilitate spheroid formation. Flat-bottomed 96-well plates (Corning biosciences) were coated with 125 μg/ml matrigel in stem-cell media. Once coating was completed, 200 μl/well of culture medium containing either DMSO or inhibitor (1.5× final concentration) was added to each well. After removal of 100 μl medium from the ULA 96-well round-bottomed plates containing neurospheres of 250-300 μm in diameter, the remaining medium including the neurosphere was transferred onto the pre-coated plates (12 replicates).
Quantification And Statistical Analysis
Statistical analyses
Bioinformatics methods are described above. IC50 values were determined by a nonlinear best-fit method using GraphPad Prism.
The sample size for in vivo experiments was based on variance estimated from experiments with control animals orthotopically xenografted with DIPG cells showing a standard deviation of approximately 30% of the mean. Sample size calculations to detect a 50% difference in tumor growth between two groups with an alpha of 0.05 and a power of 0.8 indicate a minimum group size of 3 animals.
Two-tailed t tests with Tukey or Sidak correction as indicated for multiple comparisons were used for in vitro experiments. A two-tailed t-test was used for comparison of tumor growth rate in orthotopic xenograft experiments. A log-rank test was used for orthotopic xenograft survival analysis.
Outlying data points (>2 standard deviations from the mean in either direction) were excluded. Variance was similar between groups compared.
ChIP-seq analyses
SU-DIPG-VI and SU-DIPG-XIII-P datasets were generated from 1% DMSO treated cells paired with single and combination treated used for subsequent analysis. SU-DIPG-IV and SU-DIPG-XVII datasets were generated from untreated cells. All datasets were generated in biological duplicate. ChIP-seq datasets were aligned to hg19 annotation of the human genome using bowtie2 (Langmead & Salzberg 2012) (version 2.2.4). PCR duplicates were removed using Picard Tools MarkDuplicates and bigWigs were generated using UCSC bedGraphToBigWig. Genome tracks were generated using UCSC genome browser (http://genome.ucsc.edu/) with tracks normalized to 1 million reads.
H3K27Ac peaks were called over input controls with full depth libraries using MACS2 (version 2.7.5) with default settings. Enhancers were called as H3K27Ac peaks greater than 2 kb from a TSS, as defined by RefSeq gene annotations. Super-enhancers were identified using ROSE (Lovén et al. 2013) (https://bitbucket.org/young_computation/rose) where enhancers within 12.5 kb were joined together. All enhancers were ranked by density of reads in H3K27Ac ChIP over reads in input.
The nearest RefSeq TSS to each super-enhancer was found using HOMER (Heinz et al. 2010) annotatePeaks.pl. In order to identify potential therapeutic target proteins, microRNAs and snoRNAs were removed from the RefSeq gene annotation. Gene expression values used for associated genes were from DMSO treated control, as described below. Super-enhancer interval overlaps were performed using bedtools (Quinlan & Hall 2010) and the set of shared super-enhancers was created by joining overlapping super-enhancers with bedtools merge. Gene ontology was performed using GREAT (McLean et al. 2010) and binomial FDR adjusted p values were reported. Pathway analysis was performed using PANTHER (Mi et al. 2016) and Bonferroni adjusted p values were reported.
All libraries were down-sampled to 20 M unique reads for enrichment and signal analyses. Enrichment was calculated by creating tag directories and coverage using HOMER makeTagDirectory and annotatePeaks, respectively, and signal over input was defined as the difference in coverage between H3K27Ac ChIP-seq and input control. Random genomic intervals for super-enhancer comparison were created using bedtools random to match number of super-enhancers and median super-enhancer length for each culture.
Signal at genomic regions was measured by using bedtools coverage to count ChIP-seq reads within regions. H3K27Ac signal was defined as the difference in number of reads in H3K27Ac ChIP-seq and reads in input controls. Density was then calculated as the signal divided by the length of the region in kilobases. For comparison of replicates and differential testing, DESeq2 was used and scatter plots were generated in R using smoothScatter. Distance of H3K27Ac regions to TSS was determined using bedtools closest.
Gene expression analyses
Reads were mapped to hg19 annotation using Tophat2 (Kim et al. 2013) (version 2.0.13) and duplicates were removed using Picard Tools. ERCC spike-in reads were mapped using bowtie2 alignment an ERCC reference. Transcript coverage of RefSeq gene annotations and ERCC spike-in counts were performed using featureCounts (Liao et al. 2014). Differential testing and log2 fold change calculation was performed using DESeq2 (Love et al. 2014) with two biological replicates and FDR=0.1, with normalization calculated on only the set of ERCC spike-in counts. Primary tumor analysis was performed on all SU-DIPG samples published in Grasso et al. 2015.
Active transcripts were defined as genes with a mean FPKM of at least 5 in DMSO controls. Unsupervised hierarchical clustering was performed on the top 10% of downregulated panobinostat and JQ1 transcripts and top 5% of THZ1 downregulated transcripts active in both cultures using heatmap.2 from R package gplots. Gene Ontology was performed using GO Consortium (Ashburner et al. 2000) and pathway analysis by PANTHER (Mi et al. 2016). Violin plots were generated using ggplot2 of log transformed (FPKM+1) values.
Gene set enrichment analysis (GSEA) of drug-treated DIPG cells was performed as previously described (Grasso et al. 2015) (www.broadinstitute.org/software/gsea) (Subramanian et al. 2005) by using two customized DIPG super-enhancer (SE) related gene sets. These two gene sets, TANG_ACTIVESE_DIPG6 and TANG_ACTIVESE_DIPG13, contained actively transcribed SE-associated genes in SU-DIPG-VI and SU-DIPG-XIII-P cell cultures respectively. Normalized Enrichment Score (NES) and FDR q-value were calculated by using permutation type of gene-set. Significantly enriched gene sets were called by using cut-off of FDR ≤ 0.1.
3D migration and invasion quantification
Starting from time zero, and at 24-hour intervals up to 72 hours, images were collected using standard exposure and gamma settings. The degree of cell spread on the matrix was measured using Image J and relative invasion plotted as the average distance of migration as a ratio to distance at 0 days.
Data and Software Availability
All RNA and ChIP sequence data are available through GEO (GSE94259).
Additional Resources
Not applicable
Supplementary Material
Significance.
DIPG is a universally fatal pediatric cancer. A histone-3 K27M mutation affects ∼80% of DIPGs and drives aberrant transcription. Here, we demonstrate that transcriptional disruption achieved by targeting either BRD4 or CDK7 is a promising strategy for DIPG, particularly in combination with HDAC inhibition. Analyses of key regulatory elements called super-enhancers in DIPG underscores cell identity genes supporting the hypothesis that DIPG arises from a precursor cell in the oligodendroglial lineage and highlights several unexpected gene families that prove functionally important to DIPG pathobiology. Taken together, the findings presented here identify targets for therapy of this devastating cancer.
Highlights.
DIPG is vulnerable to transcriptional disruption via BRD4 or CDK7 blockade
Panobinostat-resistant DIPG cells retain susceptibility to CDK7 blockade with THZ1
Super-enhancer analyses indicate an early oligodendroglial precursor cell of origin
Chromatin analyses reveal EPH receptor signaling as crucial to DIPG invasion
Acknowledgments
We thank Rintaro Hashizume and C. David James for use of the SF7761 cell line and Eric Raabe for use of the JHH-DIPG1 cell line. The authors gratefully acknowledge support from McKenna Claire Foundation (M.M.), Lyla Nsouli Foundation (M.M.), Alex's Lemonade Stand Foundation (M.M. and Y.T.), The Cure Starts Now Foundation and DIPG Collaborative (M.M.), Unravel Pediatric Cancer (M.M.), National Institute of Neurological Disorders and Stroke (R01NS092597 to M.M.), Department of Defense (NF140075 to M.M.), California Institute for Regenerative Medicine (CIRM RN3-06510 to M.M.), Childhood Brain Tumor Foundation (M.M.), V Foundation (M.M.), Joey Fabus Childhood Cancer Foundation (M.M.), Wayland Villars DIPG Foundation (M.M.), Connor Johnson, Zoey Ganesh, Abigail Jensen and Declan Gloster Memorial Funds (M.M.), N8 Foundation (M.M.), Godfrey Family Fund in Memory of Fiona Penelope (M.M.), Virginia and D.K. Ludwig Fund for Cancer Research (M.M.), Child Health Research Institute at Stanford Anne T. and Robert M. Bass Endowed Faculty Scholarship in Pediatric Cancer (M.M.), Liwei Wang Research Fund (M.M.), The Recruitment Program of Global Experts of China (National 1000-Youth Talents Program; Y.T.), The Program for Professor of Special Appointment (Eastern Scholar) at Shanghai Institutions of Higher Learning (Y.T.), National Natural Science Foundation of China (81572761 to Y.T.), Shanghai Rising-Star Program (Y.T.).
Footnotes
Author Contributions: S.N., Y.T. N.A.V., K.R.T. conducted experiments and contributed to experimental design, manuscript editing, and data analysis. P.J.W contributed to conducting in vivo experiments. W.S. conducted LC-MSMS analyses. A.P. designed and validated the shRNA constructs. F.L, W.M, M.L, L.Z., J.M. contributed to the in vitro experiments. E.H. generated the H3WT DIPG cell culture. T.S. and J.W. contributed to the genomic analyses. Y.T. and S.N. made the figures. M.M. and S.N. wrote the manuscript. M.M. and Y.T. supervised all aspects of the work.
Competing interests: The authors have no competing interests to declare.
Publisher's Disclaimer: This is a PDF file of an unedited manuscript that has been accepted for publication. As a service to our customers we are providing this early version of the manuscript. The manuscript will undergo copyediting, typesetting, and review of the resulting proof before it is published in its final citable form. Please note that during the production process errors may be discovered which could affect the content, and all legal disclaimers that apply to the journal pertain.
References
- Araki T, et al. Mechanism of Homophilic Binding Mediated by Ninjurin, a Novel Widely Expressed Adhesion Molecule. Journal of Biological Chemistry. 1997;272(34):21373–21380. doi: 10.1074/jbc.272.34.21373. [DOI] [PubMed] [Google Scholar]
- Araki T, Milbrandt J. Ninjurin, a Novel Adhesion Molecule, Is Induced by Nerve Injury and Promotes Axonal Growth. Neuron. 1996;17(2):353–361. doi: 10.1016/s0896-6273(00)80166-x. [DOI] [PubMed] [Google Scholar]
- Ashburner M, et al. Gene Ontology: tool for the unification of biology. Nature Genetics. 2000;25(1):25–29. doi: 10.1038/75556. [DOI] [PMC free article] [PubMed] [Google Scholar]
- Bender S, et al. Reduced H3K27me3 and DNA hypomethylation are major drivers of gene expression in K27M mutant pediatric high-grade gliomas. Cancer cell. 2013;24(5):660–72. doi: 10.1016/j.ccr.2013.10.006. [DOI] [PubMed] [Google Scholar]
- Bhatia S, et al. Effects of altered ephrin-A5 and EphA4/EphA7 expression on tumor growth in a medulloblastoma mouse model. Journal of hematology & oncology. 2015;8:105. doi: 10.1186/s13045-015-0202-9. [DOI] [PMC free article] [PubMed] [Google Scholar]
- Bid HK, et al. The Bromodomain BET Inhibitor JQ1 Suppresses Tumor Angiogenesis in Models of Childhood Sarcoma. Molecular cancer therapeutics. 2016;15(5):1018–28. doi: 10.1158/1535-7163.MCT-15-0567. [DOI] [PMC free article] [PubMed] [Google Scholar]
- Brown ZZ, et al. Strategy for "detoxification" of a cancer-derived histone mutant based on mapping its interaction with the methyltransferase PRC2. Journal of the American Chemical Society. 2014;136(39):13498–501. doi: 10.1021/ja5060934. [DOI] [PMC free article] [PubMed] [Google Scholar]
- Buczkowicz P, et al. Genomic analysis of diffuse intrinsic pontine gliomas identifies three molecular subgroups and recurrent activating ACVR1 mutations. Nature GeNetics VOLUME. 2014;46(5) doi: 10.1038/ng.2936. [DOI] [PMC free article] [PubMed] [Google Scholar]
- Caretti V, et al. Subventricular spread of diffuse intrinsic pontine glioma. Acta Neuropathologica. 2014;128(4):605–607. doi: 10.1007/s00401-014-1307-x. [DOI] [PMC free article] [PubMed] [Google Scholar]
- Chan KM, et al. The histone H3.3K27M mutation in pediatric glioma reprograms H3K27 methylation and gene expression. Genes & development. 2013;27(9):985–90. doi: 10.1101/gad.217778.113. [DOI] [PMC free article] [PubMed] [Google Scholar]
- Chen P, et al. EphB2 activation is required for ependymoma development as well as inhibits differentiation and promotes proliferation of the transformed cell. Scientific reports. 2015;5:9248. doi: 10.1038/srep09248. [DOI] [PMC free article] [PubMed] [Google Scholar]
- Chipumuro E, et al. CDK7 Inhibition Suppresses Super-Enhancer-Linked Oncogenic Transcription in MYCN-Driven Cancer. Cell. 2014;159(5):1126–1139. doi: 10.1016/j.cell.2014.10.024. [DOI] [PMC free article] [PubMed] [Google Scholar]
- Chresta CM, et al. AZD8055 Is a Potent, Selective, and Orally Bioavailable ATP-Competitive Mammalian Target of Rapamycin Kinase Inhibitor with In vitro and In vivo Antitumor Activity. Cancer Research. 2010;70(1) doi: 10.1158/0008-5472.CAN-09-1751. [DOI] [PubMed] [Google Scholar]
- Christensen CL, et al. Targeting Transcriptional Addictions in Small Cell Lung Cancer with a Covalent CDK7 Inhibitor. Cancer Cell. 2014;26(6):909–922. doi: 10.1016/j.ccell.2014.10.019. [DOI] [PMC free article] [PubMed] [Google Scholar]
- Coudé MM, et al. BET inhibitor OTX015 targets BRD2 and BRD4 and decreases c-MYC in acute leukemia cells. Oncotarget. 2015;6(19):17698–712. doi: 10.18632/oncotarget.4131. [DOI] [PMC free article] [PubMed] [Google Scholar]
- Cramer KS, et al. Eph-ephrin signaling in nervous system development. F1000Research. 2016;5:413. doi: 10.12688/f1000research.7417.1. [DOI] [PMC free article] [PubMed] [Google Scholar]
- Cristea S, Sage J. Is the Canonical RAF/MEK/ERK Signaling Pathway a Therapeutic Target in SCLC? Journal of Thoracic Oncology. 2016;11(8):1233–1241. doi: 10.1016/j.jtho.2016.04.018. [DOI] [PMC free article] [PubMed] [Google Scholar]
- Dawson MA, et al. Inhibition of BET recruitment to chromatin as an effective treatment for MLL-fusion leukaemia. Nature. 2011;478(7370):529–33. doi: 10.1038/nature10509. [DOI] [PMC free article] [PubMed] [Google Scholar]
- Delmore JE, et al. BET Bromodomain Inhibition as a Therapeutic Strategy to Target c-Myc. Cell. 2011;146(6):904–917. doi: 10.1016/j.cell.2011.08.017. [DOI] [PMC free article] [PubMed] [Google Scholar]
- Filippakopoulos P, Knapp S. Targeting bromodomains: epigenetic readers of lysine acetylation. Nature reviews Drug discovery. 2014;13(5):337–56. doi: 10.1038/nrd4286. [DOI] [PubMed] [Google Scholar]
- Fisher RP, Morgan DO. A novel cyclin associates with M015/CDK7 to form the CDK-activating kinase. Cell. 1994;78(4):713–724. doi: 10.1016/0092-8674(94)90535-5. [DOI] [PubMed] [Google Scholar]
- Funato K, et al. Use of human embryonic stem cells to model pediatric gliomas with H3.3K27M histone mutation. Science (New York, NY) 2014;346(6216):1529–33. doi: 10.1126/science.1253799. [DOI] [PMC free article] [PubMed] [Google Scholar]
- Gessi M, et al. High frequency of H3F3A K27M mutations characterizes pediatric and adult high-grade gliomas of the spinal cord. Acta Neuropathologica. 2015;130(3):435–437. doi: 10.1007/s00401-015-1463-7. [DOI] [PubMed] [Google Scholar]
- Glover-Cutter K, et al. TFIIH-Associated Cdk7 Kinase Functions in Phosphorylation of C-Terminal Domain Ser7 Residues, Promoter-Proximal Pausing, and Termination by RNA Polymerase II. Molecular and Cellular Biology. 2009;29(20):5455–5464. doi: 10.1128/MCB.00637-09. [DOI] [PMC free article] [PubMed] [Google Scholar]
- Grasso CS, et al. Functionally defined therapeutic targets in diffuse intrinsic pontine glioma. Nature medicine. 2015;21(6):555–9. doi: 10.1038/nm.3855. [DOI] [PMC free article] [PubMed] [Google Scholar]
- Hagenbuchner J, Ausserlechner MJ. Targeting transcription factors by small compounds—Current strategies and future implications. Biochemical Pharmacology. 2016;107:1–13. doi: 10.1016/j.bcp.2015.12.006. [DOI] [PubMed] [Google Scholar]
- Hashizume R, et al. Characterization of a diffuse intrinsic pontine glioma cell line: implications for future investigations and treatment. Journal of neuro-oncology. 2012;110(3):305–13. doi: 10.1007/s11060-012-0973-6. [DOI] [PubMed] [Google Scholar]
- Hashizume R, et al. Pharmacologic inhibition of histone demethylation as a therapy for pediatric brainstem glioma. Nature Medicine. 2014;20(12):1394–1396. doi: 10.1038/nm.3716. [DOI] [PMC free article] [PubMed] [Google Scholar]
- Heinz S, et al. Simple Combinations of Lineage-Determining Transcription Factors Prime cis-Regulatory Elements Required for Macrophage and B Cell Identities. Molecular Cell. 2010;38(4):576–589. doi: 10.1016/j.molcel.2010.05.004. [DOI] [PMC free article] [PubMed] [Google Scholar]
- Hennika T, et al. Pre-Clinical Study of Panobinostat in Xenograft and Genetically Engineered Murine Diffuse Intrinsic Pontine Glioma Models. In: Castro MG, editor. PLOS ONE. 1. Vol. 12. 2017. p. e0169485. [DOI] [PMC free article] [PubMed] [Google Scholar]
- Herring BE, et al. Cornichon Proteins Determine the Subunit Composition of Synaptic AMPA Receptors. Neuron. 2013;77(6):1083–1096. doi: 10.1016/j.neuron.2013.01.017. [DOI] [PMC free article] [PubMed] [Google Scholar]
- Herz HM, et al. Histone H3 lysine-to-methionine mutants as a paradigm to study chromatin signaling. Science. 2014;345(6200):1065–70. doi: 10.1126/science.1255104. [DOI] [PMC free article] [PubMed] [Google Scholar]
- Hnisz D, et al. Super-Enhancers in the Control of Cell Identity and Disease. Cell. 2013;155(4):934–947. doi: 10.1016/j.cell.2013.09.053. [DOI] [PMC free article] [PubMed] [Google Scholar]
- Hruska M, Dalva MB. Ephrin regulation of synapse formation, function and plasticity. Molecular and Cellular Neuroscience. 2012;50(1):35–44. doi: 10.1016/j.mcn.2012.03.004. [DOI] [PMC free article] [PubMed] [Google Scholar]
- Huang X, et al. EAG2 potassium channel with evolutionarily conserved function as a brain tumor target. Nature neuroscience. 2015;18(9):1236–46. doi: 10.1038/nn.4088. [DOI] [PMC free article] [PubMed] [Google Scholar]
- Huang X, Jan LY. Targeting potassium channels in cancer. The Journal of Cell Biology. 2014;206(2) doi: 10.1083/jcb.201404136. [DOI] [PMC free article] [PubMed] [Google Scholar]
- Jang MK, et al. The Bromodomain Protein Brd4 Is a Positive Regulatory Component of P-TEFb and Stimulates RNA Polymerase II-Dependent Transcription. Molecular Cell. 2005;19(4):523–534. doi: 10.1016/j.molcel.2005.06.027. [DOI] [PubMed] [Google Scholar]
- Jiang YY, et al. Targeting super-enhancer-associated oncogenes in oesophageal squamous cell carcinoma. Gut. 2016 doi: 10.1136/gutjnl-2016-311818. [DOI] [PMC free article] [PubMed] [Google Scholar]
- Khuong-Quang DA, et al. K27M mutation in histone H3.3 defines clinically and biologically distinct subgroups of pediatric diffuse intrinsic pontine gliomas. Acta neuropathologica. 2012;124(3):439–47. doi: 10.1007/s00401-012-0998-0. [DOI] [PMC free article] [PubMed] [Google Scholar]
- Kim D, et al. TopHat2: accurate alignment of transcriptomes in the presence of insertions, deletions and gene fusions. Genome biology. 2013;14(4):R36. doi: 10.1186/gb-2013-14-4-r36. [DOI] [PMC free article] [PubMed] [Google Scholar]
- Kim LC, Cook RS, Chen J. mTORC1 and mTORC2 in cancer and the tumor microenvironment. Oncogene. 2016 doi: 10.1038/onc.2016.363. [DOI] [PMC free article] [PubMed] [Google Scholar]
- Kwiatkowski N, et al. Targeting transcription regulation in cancer with a covalent CDK7 inhibitor. Nature. 2014;511 doi: 10.1038/nature13393. [DOI] [PMC free article] [PubMed] [Google Scholar]
- Langmead B, Salzberg SL. Fast gapped-read alignment with Bowtie 2. Nature Methods. 2012;9(4):357–359. doi: 10.1038/nmeth.1923. [DOI] [PMC free article] [PubMed] [Google Scholar]
- Larochelle S, et al. Cyclin-dependent kinase control of the initiation-to-elongation switch of RNA polymerase II. 2012 doi: 10.1038/nsmb.2399. [DOI] [PMC free article] [PubMed] [Google Scholar]
- Larochelle S, et al. Requirements for Cdk7 in the Assembly of Cdk1/Cyclin B and Activation of Cdk2 Revealed by Chemical Genetics in Human Cells. Molecular Cell. 2007;25(6):839–850. doi: 10.1016/j.molcel.2007.02.003. [DOI] [PMC free article] [PubMed] [Google Scholar]
- LeRoy G, Rickards B, Flint SJ. The Double Bromodomain Proteins Brd2 and Brd3 Couple Histone Acetylation to Transcription. Molecular Cell. 2008;30(1):51–60. doi: 10.1016/j.molcel.2008.01.018. [DOI] [PMC free article] [PubMed] [Google Scholar]
- Lewis PW, et al. Inhibition of RC2 activity by a gain-of-function H3 mutation found in pediatric glioblastoma. Science. 2013;340(6134):857–61. doi: 10.1126/science.1232245. [DOI] [PMC free article] [PubMed] [Google Scholar]
- Liao Y, Smyth GK, Shi W. featureCounts: an efficient general purpose program for assigning sequence reads to genomic features Bioinformatics. 7. Vol. 30. Oxford, England: 2014. pp. 923–30. [DOI] [PubMed] [Google Scholar]
- Love MI, Huber W, Anders S. Moderated estimation of fold change and dispersion for RNA-seq data with DESeq2. Genome biology. 2014;15(12):550. doi: 10.1186/s13059-014-0550-8. [DOI] [PMC free article] [PubMed] [Google Scholar]
- Lovén J, et al. Selective Inhibition of Tumor Oncogenes by Disruption of Super-Enhancers. Cell. 2013;153(2):320–334. doi: 10.1016/j.cell.2013.03.036. [DOI] [PMC free article] [PubMed] [Google Scholar]
- Maes T, Barceló A, Buesa C. Neuron Navigator: A Human Gene Family with Homology to unc-53, a Cell Guidance Gene from Caenorhabditis elegans. Genomics. 2002;80(1):21–30. doi: 10.1006/geno.2002.6799. [DOI] [PubMed] [Google Scholar]
- Mah W, et al. Selected SALM (synaptic adhesion-like molecule) family proteins regulate synapse formation. JNeurosci. 2010;30(16):5559–68. doi: 10.1523/JNEUROSCI.4839-09.2010. [DOI] [PMC free article] [PubMed] [Google Scholar]
- Maier V, et al. Semaphorin 4C and 4G are ligands of Plexin-B2 required in cerebellar development. Molecular and Cellular Neuroscience. 2011;46(2):419–431. doi: 10.1016/j.mcn.2010.11.005. [DOI] [PMC free article] [PubMed] [Google Scholar]
- Martínez-López MJ, et al. Mouse Neuron navigator 1, a novel microtubule-associated protein involved in neuronal migration. Molecular and Cellular Neuroscience. 2005;28(4):599–612. doi: 10.1016/j.mcn.2004.09.016. [DOI] [PubMed] [Google Scholar]
- McCubrey JA, et al. Effects of mutations in Wnt/β-catenin, hedgehog, Notch and PI3K pathways on GSK-3 activity—Diverse effects on cell growth, metabolism and cancer. Biochimica et Biophysica Acta - Molecular Cell Research. 2016;1863(12):2942–2976. doi: 10.1016/j.bbamcr.2016.09.004. [DOI] [PubMed] [Google Scholar]
- McLean CY, et al. GREAT improves functional interpretation of cis-regulatory regions. Nature Biotechnology. 2010;28(5) doi: 10.1038/nbt.1630. [DOI] [PMC free article] [PubMed] [Google Scholar]
- Mertz JA, et al. Targeting MYC dependence in cancer by inhibiting BET bromodomains. Proceedings of the National Academy of Sciences of the United States of America. 2011;108(40):16669–74. doi: 10.1073/pnas.1108190108. [DOI] [PMC free article] [PubMed] [Google Scholar]
- Mi H, et al. PANTHER version 10: expanded protein families and functions, and analysis tools. Nucleic Acids Research. 2016;44(D1):D336–D342. doi: 10.1093/nar/gkv1194. [DOI] [PMC free article] [PubMed] [Google Scholar]
- Miao H, et al. EphA2 promotes infiltrative invasion of glioma stem cells in vivo through cross-talk with Akt and regulates stem cell properties. Oncogene. 2015;34(5):558–67. doi: 10.1038/onc.2013.590. [DOI] [PMC free article] [PubMed] [Google Scholar]
- Mirguet O, et al. Discovery of epigenetic regulator I-BET762: lead optimization to afford a clinical candidate inhibitor of the BET bromodomains. Journal of medicinal chemistry. 2013;56(19):7501–15. doi: 10.1021/jm401088k. [DOI] [PubMed] [Google Scholar]
- Monje M, et al. Hedgehog-responsive candidate cell of origin for diffuse intrinsic pontine glioma. PNAS. 2011;108(11):4453–4458. doi: 10.1073/pnas.1101657108. [DOI] [PMC free article] [PubMed] [Google Scholar]
- Morris EJ, et al. Discovery of a Novel ERK Inhibitor with Activity in Models of Acquired Resistance to BRAF and MEK Inhibitors. Cancer Discovery. 2013;3(7) doi: 10.1158/2159-8290.CD-13-0070. [DOI] [PubMed] [Google Scholar]
- Nakada M, et al. Ephrin-B3 Ligand Promotes Glioma Invasion through Activation of Rac1. Cancer Research. 2006;66(17) doi: 10.1158/0008-5472.CAN-05-4211. [DOI] [PubMed] [Google Scholar]
- Nakada M, et al. The Phosphorylation of EphB2 Receptor Regulates Migration and Invasion of Human Glioma Cells. Cancer Research. 2004;64(9) doi: 10.1158/0008-5472.can-03-3667. [DOI] [PubMed] [Google Scholar]
- Ostrom QT, et al. CBTRUS Statistical Report: Primary Brain and Central Nervous System Tumors Diagnosed in the United States in 2008-2012. Neuro-oncology. 2015;17(4):iv1–iv62. doi: 10.1093/neuonc/nov189. [DOI] [PMC free article] [PubMed] [Google Scholar]
- Paugh BS, et al. Novel Oncogenic PDGFRA Mutations in Pediatric High-Grade Gliomas. Cancer Research. 2013;73(20) doi: 10.1158/0008-5472.CAN-13-1491. [DOI] [PMC free article] [PubMed] [Google Scholar]
- Picaud S, et al. Generation of a Selective Small Molecule Inhibitor of the CBP/p300 Bromodomain for Leukemia Therapy. Cancer research. 2015;75(23):5106–19. doi: 10.1158/0008-5472.CAN-15-0236. [DOI] [PMC free article] [PubMed] [Google Scholar]
- Posternak V, Cole MD. Strategically targeting MYC in cancer. F1000Research. 2016;5 doi: 10.12688/f1000research.7879.1. [DOI] [PMC free article] [PubMed] [Google Scholar]
- Qiao L, et al. Structure–activity relationship study of EphB3 receptor tyrosine kinase inhibitors. Bioorg Med Chem Lett. 2009;19(21):6122–6. doi: 10.1016/j.bmcl.2009.09.010. [DOI] [PMC free article] [PubMed] [Google Scholar]
- Quinlan AR, Hall IM. BEDTools: a flexible suite of utilities for comparing genomic features. Bioinformatics. 2010;26(6):841–2. doi: 10.1093/bioinformatics/btq033. [DOI] [PMC free article] [PubMed] [Google Scholar]
- Rahman S, et al. The Brd4 Extraterminal Domain Confers Transcription Activation Independent of pTEFb by Recruiting Multiple Proteins, Including NSD3. Molecular and Cellular Biology. 2011;31(13):2641–2652. doi: 10.1128/MCB.01341-10. [DOI] [PMC free article] [PubMed] [Google Scholar]
- Rossignol M, et al. Substrate specificity of the cdk-activating kinase (CAK) is altered upon association with TFIIH. The EMBO Journal. 1997;16(7):1628–1637. doi: 10.1093/emboj/16.7.1628. [DOI] [PMC free article] [PubMed] [Google Scholar]
- Schwartzentruber J, et al. Driver mutations in histone H3.3 and chromatin remodelling genes in paediatric glioblastoma. Nature. 2012;482(7384):226–31. doi: 10.1038/nature10833. [DOI] [PubMed] [Google Scholar]
- Sengupta D, et al. Disruption of BRD4 at H3K27Ac-enriched enhancer region correlates with decreased c-Myc expression in Merkel cell carcinoma. Epigenetics. 2015;10(6):460–6. doi: 10.1080/15592294.2015.1034416. [DOI] [PMC free article] [PubMed] [Google Scholar]
- Sengupta S, et al. Inhibition of BET proteins impairs estrogen-mediated growth and transcription in breast cancers by pausing RNA polymerase advancement. Breast cancer research and treatment. 2015;150(2):265–78. doi: 10.1007/s10549-015-3319-1. [DOI] [PMC free article] [PubMed] [Google Scholar]
- Serizawa H, et al. Association of Cdk-activating kinase subunits with transcription factor TFIIH. Nature. 1995;374(6519):280–2. doi: 10.1038/374280a0. [DOI] [PubMed] [Google Scholar]
- Shahbazi J, et al. The Bromodomain Inhibitor JQ1 and the Histone Deacetylase Inhibitor Panobinostat Synergistically Reduce N-Myc Expression and Induce Anticancer Effects. Clinical cancer research. 2016;22(10):2534–44. doi: 10.1158/1078-0432.CCR-15-1666. [DOI] [PubMed] [Google Scholar]
- Shankar GM, et al. BRAF alteration status and the histone H3F3A gene K27M mutation segregate spinal cord astrocytoma histology. Acta Neuropathologica. 2016;131(1):147–150. doi: 10.1007/s00401-015-1492-2. [DOI] [PMC free article] [PubMed] [Google Scholar]
- Strutz N, et al. Identification of domains and amino acids involved in GLuR7 ion channel function. The Journal of neuroscience. 2001;21(2):401–11. doi: 10.1523/JNEUROSCI.21-02-00401.2001. [DOI] [PMC free article] [PubMed] [Google Scholar]
- Subramanian A, et al. Gene set enrichment analysis : A knowledge-based approach for interpreting genome-wide expression profiles. PNAS. 2005;102(43):15545–50. doi: 10.1073/pnas.0506580102. [DOI] [PMC free article] [PubMed] [Google Scholar]
- Sun H, et al. A monoclonal antibody against KCNK9 K+ channel extracellular domain inhibits tumour growth and metastasis. Nature Communications. 2016;7:10339. doi: 10.1038/ncomms10339. [DOI] [PMC free article] [PubMed] [Google Scholar]
- Switon K, et al. Molecular neurobiology of mTOR. Neuroscience. 2017;341:112–153. doi: 10.1016/j.neuroscience.2016.11.017. [DOI] [PubMed] [Google Scholar]
- Tang Y, et al. Epigenetic targeting of Hedgehog pathway transcriptional output through BET bromodomain inhibition. Nature Medicine. 2014;20(7):732–740. doi: 10.1038/nm.3613. [DOI] [PMC free article] [PubMed] [Google Scholar]
- Tate MC, et al. Postnatal growth of the human pons: a morphometric and immunohistochemical analysis. The Journal of comparative neurology. 2015;523(3):449–62. doi: 10.1002/cne.23690. [DOI] [PMC free article] [PubMed] [Google Scholar]
- Taylor IC, et al. Disrupting NOTCH Slows Diffuse Intrinsic Pontine Glioma Growth, Enhances Radiation Sensitivity, and Shows Combinatorial Efficacy With Bromodomain Inhibition. Journal of neuropathology and experimental neurology. 2015;74(8):778–90. doi: 10.1097/NEN.0000000000000216. [DOI] [PMC free article] [PubMed] [Google Scholar]
- Taylor KR, et al. Recurrent activating ACVR1 mutations in diffuse intrinsic pontine glioma. Nature genetics. 2014;46(5):457–61. doi: 10.1038/ng.2925. [DOI] [PMC free article] [PubMed] [Google Scholar]
- Venkatesh HS, et al. Neuronal Activity Promotes Glioma Growth through Neuroligin-3 Secretion. Cell. 2015;161(4):803–816. doi: 10.1016/j.cell.2015.04.012. [DOI] [PMC free article] [PubMed] [Google Scholar]
- Venneti S, et al. Evaluation of histone 3 lysine 27 trimethylation (H3K27me3) and enhancer of Zest 2 (EZH2) in pediatric glial and glioneuronal tumors shows decreased H3K27me3 in H3F3A K27M mutant glioblastomas. Brain pathology. 2013;23(5):558–64. doi: 10.1111/bpa.12042. [DOI] [PMC free article] [PubMed] [Google Scholar]
- Vinci M, et al. Tumor Spheroid-Based Migration Assays for Evaluation of Therapeutic Agents. Methods in Molecular Biology. 1007;986(10):978–1. doi: 10.1007/978-1-62703-311-4_16. [DOI] [PubMed] [Google Scholar]
- Vinci M, Box C, Eccles SA. Three-Dimensional (3D) Tumor Spheroid Invasion Assay. Journal of Visualized Experiments. 2015;99:e52686–e52686. doi: 10.3791/52686. [DOI] [PMC free article] [PubMed] [Google Scholar]
- Walz W, Boulton AA, Alan A, Baker GB. Patch-clamp analysis : advanced techniques. Humana Press; 2002. [Google Scholar]
- Wang Y, et al. CDK7-Dependent Transcriptional Addiction in Triple-Negative Breast Cancer. Cell. 2015;163(1):174–186. doi: 10.1016/j.cell.2015.08.063. [DOI] [PMC free article] [PubMed] [Google Scholar]
- Whyte WA, et al. Master Transcription Factors and Mediator Establish Super-Enhancers at Key Cell Identity Genes. Cell. 2013;153(2):307–319. doi: 10.1016/j.cell.2013.03.035. [DOI] [PMC free article] [PubMed] [Google Scholar]
- Wu G, et al. Somatic histone H3 alterations in pediatric diffuse intrinsic pontine gliomas and non-brainstem glioblastomas. Nature genetics. 2012;44(3):251–3. doi: 10.1038/ng.1102. [DOI] [PMC free article] [PubMed] [Google Scholar]
- Wu SY, Chiang CM. The double bromodomain-containing chromatin adaptor Brd4 and transcriptional regulation. The Journal of biological chemistry. 2007;282(18):13141–5. doi: 10.1074/jbc.R700001200. [DOI] [PubMed] [Google Scholar]
- Xu NJ, Henkemeyer M. Ephrin reverse signaling in axon guidance and synaptogenesis. Seminars in Cell & Developmental Biology. 2012;23(1):58–64. doi: 10.1016/j.semcdb.2011.10.024. [DOI] [PMC free article] [PubMed] [Google Scholar]
- Zhang Z, et al. BET Bromodomain Inhibition as a Therapeutic Strategy in Ovarian Cancer by Downregulating FoxM1. Theranostics. 2016;6(2):219–30. doi: 10.7150/thno.13178. [DOI] [PMC free article] [PubMed] [Google Scholar]
- Zuber J, et al. RNAi screen identifies Brd4 as a therapeutic target in acute myeloid leukaemia. Nature. 2011;478(7370):524–8. doi: 10.1038/nature10334. [DOI] [PMC free article] [PubMed] [Google Scholar]
Associated Data
This section collects any data citations, data availability statements, or supplementary materials included in this article.