

Abstract
Large shifts in medical, recreational, and illicit cannabis consumption in the United States have implications for personalizing treatment and prevention programs to a wide variety of populations. As such, considerable research has investigated clinical presentations of cannabis users in clinical and population-based samples. Studies leveraging big data, social media, and social network analysis have emerged as a promising mechanism to generate timely insights that can inform treatment and prevention research. This study extends a novel method called stochastic block modeling to derive communities of cannabis consumers as part of a complex social network on Twitter. A set of examples illustrate how this method can ascertain candidate samples of medical, recreational, and illicit cannabis users. Implications for research planning, intervention design, and public health surveillance are discussed.
Keywords: Big data, cannabis, network analysis, stochastic block model, methodology
Introduction
The social and political climate surrounding cannabis has continued to evolve in the United States. On the November 2016 ballot, 5 states (California, Arizona, Massachusetts, Nevada, and Maine) voted on adult-use cannabis legalization and 4 states on medical cannabis (Florida, Arkansas, Montana, and North Dakota).1 Although Arizona was the only adult-use states not to pass their initiative, all 4 medical states approved those measures.1 With these new states, a total of 28 states and Washington, DC have implemented laws that permit medical or recreational use as of March 2017.1,2 Given the passing of these state laws permitting cannabis, differences in medical, recreational, and illicit consumption have implications for personalizing treatment and prevention programs to a wide variety of cannabis consumers.
To date, a number of clinical and epidemiologic studies in the United States have investigated common health conditions, psychosocial functioning, consumption patterns, and service utilization among cannabis users. In California, the largest market in the United States, medical cannabis patients most commonly report chronic pain (80%–90%).3 Similar clinical registry studies throughout the United States have also found that 40% to 50% of medical cannabis patients report muscle spasms, headaches, sleep problems, and anxiety.4–6 In a study of 686 emergency department (ED) patients, cannabis-only users were less likely than illicit drug users to have concomitant problems such as psychiatric morbidity and low self-efficacy for avoiding drug use in service settings.7 Although some medical cannabis users have demonstrated comparably lower rates of drug problems and comorbidities than recreational users in ED settings,8 others have reported higher frequency of days, more money spent on cannabis, and lower readiness to change consumption patterns than illicit users.9,10
Among community samples of medical cannabis patients in California, the vast majority also report chronic pain as well as daily use to provide symptom relief from functional impairments.11–13 Some patients also indicate a desire to participate in free clinical services offered at dispensaries, such as psychoeducation and harm reduction strategies.14 Similarly, collective and compassion models have predominated throughout the United States, which emphasize integration of social support, peer counseling, harm reduction, and chronic disease management into service delivery at dispensaries.15 Federal laws, however, preclude the ability to establish a clinical service milieu for medical cannabis dispensaries.14,15 As such, there remains a need for research that identifies distinguishable populations of cannabis consumers that may not use traditional clinical services, make regular health visits, or appear in public health surveillance systems.16
Over the past 10 years, a number of novel design and sampling approaches have been increasingly adapted to epidemiologic studies involving large-scale data collection of substance use among hard-to-reach populations. Indeed, a growing body of research has demonstrated the feasibility in adapting methods such as street ethnography, respondent-driven sampling, and targeted sampling to access these hidden populations, including people who inject drugs, nonmedical prescription opioid users, sexual minorities, and youth who frequent music festivals.17–22 Such approaches, however, incur great costs through rigorous screening processes and outreach practices in disparate service and communities settings. In addition, considerable formative work and community mobilization are necessary to identify the geographic distribution and clustering of hidden populations.
More recently, the ongoing big data revolution has provided innovations to streamline the collection and dissemination of health-related data from large social media platforms such as Twitter.23–26 In particular, several emergent computational methods have shown great promise in reducing the many burdens with collecting clinical and epidemiologic data from representative populations who consume cannabis. As such data would provide important insights for the public health surveillance of cannabis,27,28 this formative study extends a computational method called stochastic block modeling to identify communities of cannabis consumers connected to a sample of dispensary accounts on Twitter. We provide a description of data collection and modeling procedures for the Twitter accounts, highlight the utility of multimode content analyses to characterize the derived blocks of consumers, and detail the implications for population identification, intervention design, and targeted surveillance.
Methods
Collecting Twitter data
The social media Web site Twitter is a massive social network. On Twitter, a user connects to another user by following them. If we take 2 example users, A and B, when user A follows user B, user A elects into seeing user B’s public messages as soon as they are created. This followership relationship can be modeled using network analysis.29 Social networks have 2 components: nodes, which are the actors of interest in an analysis, and edges, which are the relationships among the nodes. In this study, the nodes are Twitter accounts of the users of interest and followership indicates an edge.
Using the Twitter REST API and scripts written in the Python programming language,30 we collected data from a 2-hop network seeded by 6 dispensaries in Oakland. The 6 seed accounts were selected as a targeted, geographically related sample of medical dispensary accounts we have previously validated on Twitter. A 1-hop network represents an ego network of the accounts that follow the 6 dispensary accounts. A 2-hop network is built of accounts that follow the accounts from the 1-hop network. This extended network provides additional contextual information and a more comprehensive data set to understand large networks.
After all the relevant accounts were collected, accounts that only followed one other account in the network sample were removed. Because this research deals with communities and shared followers, having accounts with a single connection adds noise to the block model. This stage removed 75% of the accounts we had collected in the original 2-hop network. With this final set of accounts with multiple following links in our network, we then made another request to the Twitter API to collect the user information for each of these accounts. This request returns data such as friend counts, follower counts, account creation date, and other metrics that are helpful in characterizing the Twitter accounts. At this stage, we also removed protected accounts for which the Twitter API returns no user information.
A summary of the number of accounts collected and filtered out at each stage is presented in Table 1.
Table 1.
Twitter account collection details.
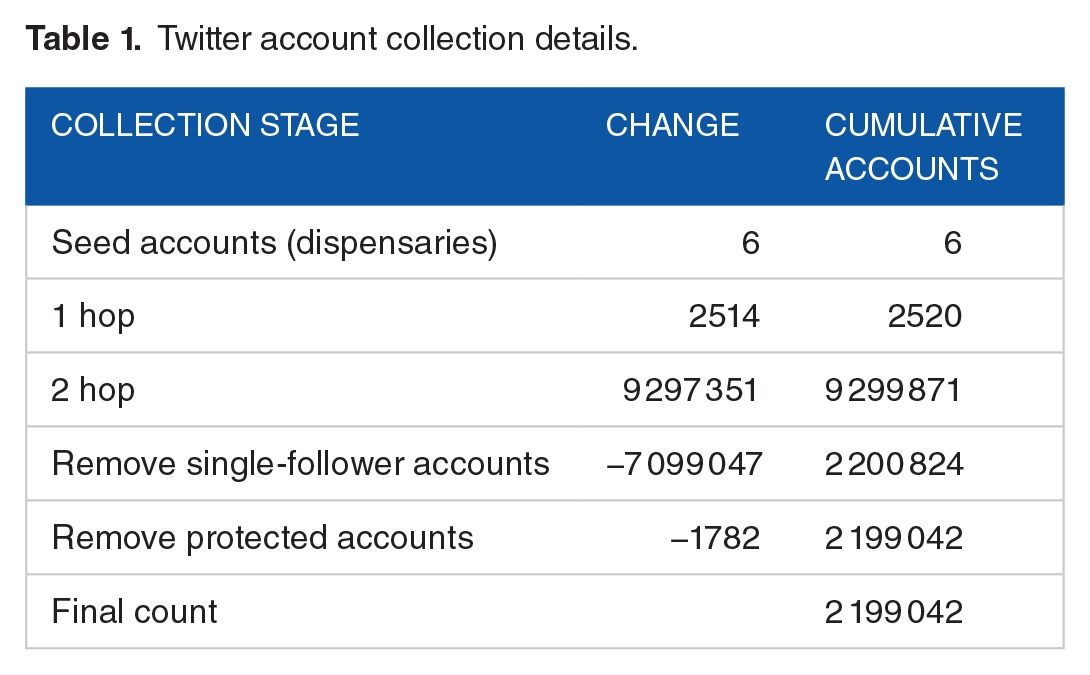
The final result of this stage is a network of almost 2.2 million nodes and their associated followership relationships. We use these data to model community structure in the next step.
Inferring network structure with stochastic block modeling
Understanding the structure of a network is one of the key tasks undertaken in network analysis. One way of understanding structure is to look at groups or clusters of nodes, typically called communities. More specifically, a community is a group of nodes that are more densely connected with intracommunity nodes than other nodes in the network.31 This type of analysis is especially critical to understanding large networks, as communities provide aggregate levels of analysis for examining individual nodes across entire networks. For the purposes of this study, we focus on the potential of Twitter data to uncover hidden populations of cannabis consumers and examine their network structure.
The process of finding distinguishable groups or clusters of nodes in networks is called community detection. One common community detection algorithm, the Louvain method, uses modularity to assess the presence of modules or communities and as a function to optimize in unsupervised learning algorithms.32,33 Although our conceptual approach to community detection broadly resembles this method, we use nonparametric probabilistic models that optimize for statistical likelihood rather than a specific community function.
Nonparametric probabilistic models have recently emerged as a robust methodology for understanding network structure.34 Recent studies have shown that generative models are also able to find network structure outside of the typical modular community structure, including graphs that may have different network structures (eg, bipartite, core-periphery).35 Instead of finding community structure with an algorithm that optimizes a modularity function, probabilistic models optimize the likelihood of several possible models, including community structure and then outputs the specific model with the highest likelihood given the data.34,35 For this type of inference, we need 2 components: the data themselves and a generative model of networks that incorporates communities of nodes in its definition.
A standard stochastic block model is a generative probabilistic model for networks that tends to produce community structure. The output of this model gives an assignment of a block, or community, for each node. For this study, we specify a hierarchical stochastic block model, which allows us to aggregate more granular, lower level blocks into larger, higher level blocks. To do this, we create a meta-graph, where each node is a block and an edge is the number of nodes that is connected between blocks. With this graph, one can again build a model that finds blocks given the network structure, except this time they are blocks of blocks themselves. This pattern can continue until the entire network falls under one block. Each tier, and corresponding block assignments, of this hierarchical model is called a level.
Coding of blocks
Hierarchical stochastic block models identify groups of nodes that form communities, all of which can be further characterized. To describe the communities derived from the model, we conducted multimode content analysis of the Twitter accounts to classify the blocks.36 This involved a close inspection of blocks with inductive approaches, which yielded a core set of 60 codes including specific codes for medical, recreational, and illicit users. With these codes, each block was then manually categorized. Given the diversity of accounts contained in the blocks, most of the blocks had approximately 5 codes. As such, the codes were weighted based on the relevance for a given block, with the first code having the most weight and proceeding iteratively to the last code.
Following the inductive content analyses, the initial codes for each block were cross-referenced with a digital dashboard that displayed account names, aggregate Twitter account metrics (eg, average friends and followers per account in each block), and the most common words used in profile descriptions for accounts in that block. Metrics to detect spam accounts, similar to those used by sites such as Twitter Audit,37 were created to classify blocks with spam accounts. Based on these data-driven heuristics, we validated the inductive codes and refined each block as needed. This coding scheme was also applied up the hierarchy of levels, whereby codes in lower level blocks had larger weights in the aggregated block. After the final codes were determined, the authors computed the pairwise correlations between the 20 most common codes.
Technical overview
All data collection, analysis, and modeling were performed in the python programming language. Analysis and data processing was completed with the pandas python library.38 Network analysis was completed with the graph-tool python library.39 The data were temporarily stored using MongoDB and PostgreSQL databases.
Results
Seed dispensaries
The 6 dispensaries targeted as seeds for data collection have varying levels of Twitter metrics. Table 2 contains basic Twitter statistics on the 6 seed accounts. The 6 accounts were created between June 2012 and November 2013, indicating overall account age and time to build a base of followers. The number of followers for each account ranges from 142 to 992. The number of friends, or accounts followed by the 6 accounts, ranges from 5 to 379. The total number of tweets published by each account ranges from 110 to 5112.
Table 2.
Oakland dispensaries (seed accounts)—basic Twitter statistics.

Hierarchical block structure
The stochastic block model uncovered 359 different blocks of accounts at level 1—the most granular level. The average block contains 6125 accounts at this level and the median number of accounts per block is only 4, indicating high right skew due to several blocks with many accounts. The presence of spam accounts was prevalent in the network, although the block model tended to group spam accounts into the same block.
As the hierarchy proceeds upward, the average number of accounts per block increases as blocks from lower levels merge together. The number of blocks and block size logarithmically change by a factor of 2 as we move up the hierarchy. That is, each level of the hierarchy halves the number of blocks and doubles the average block size. Table 3 illustrates the change in average block size as the hierarchy is traversed. Figure 1 illustrates the structure of the hierarchical block model.
Table 3.
Hierarchical block model summary statistics.
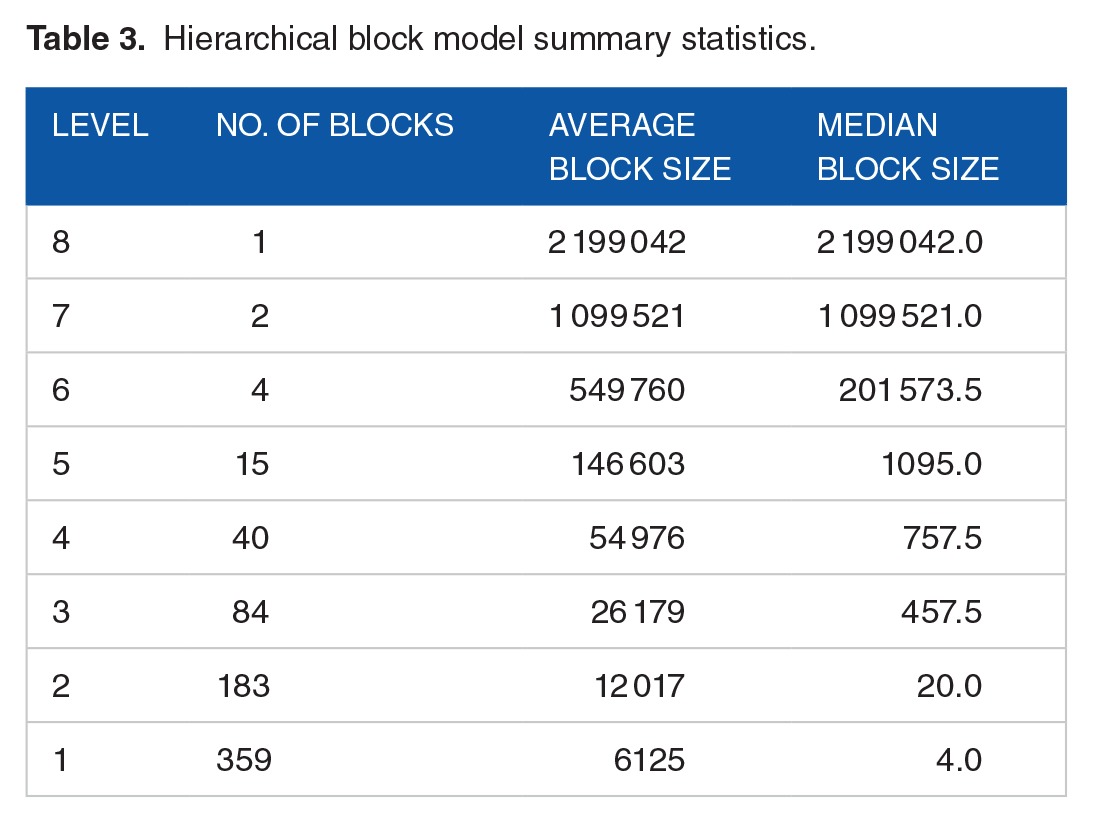
Figure 1.

A visualization of the hierarchical block model, with blocks labeled by level and block ID. The highest level, 8, with its single block of the entire network, labeled L8:B0, at the center. Moving outward, the next level of the block structure is level 7, with its 2 blocks represented by L7:B0 and L7:B1. This pattern continues to the outermost radius of the diagram representing level 1, the most granular level, with its 359 blocks.
Block coding
Table 4 shows the top 20 codes for the 359 blocks at level 1. The most frequent codes include promotion (145), lifestyle (128), business (120), recreational (98), and professional (86). The pairwise correlations between block codes range from −0.3 to 0.8 (Figure 2). The strongest correlation (0.81) is for spam-international, followed by dispensary-collective (0.45). Small to moderate associations (|0.2–0.29|) are found for recreational-promotion (−0.28), professional-advocacy (0.29), business-marketing (0.26), and entertainment-meme (0.26).
Table 4.
Level 1—block code frequencies (top 20).
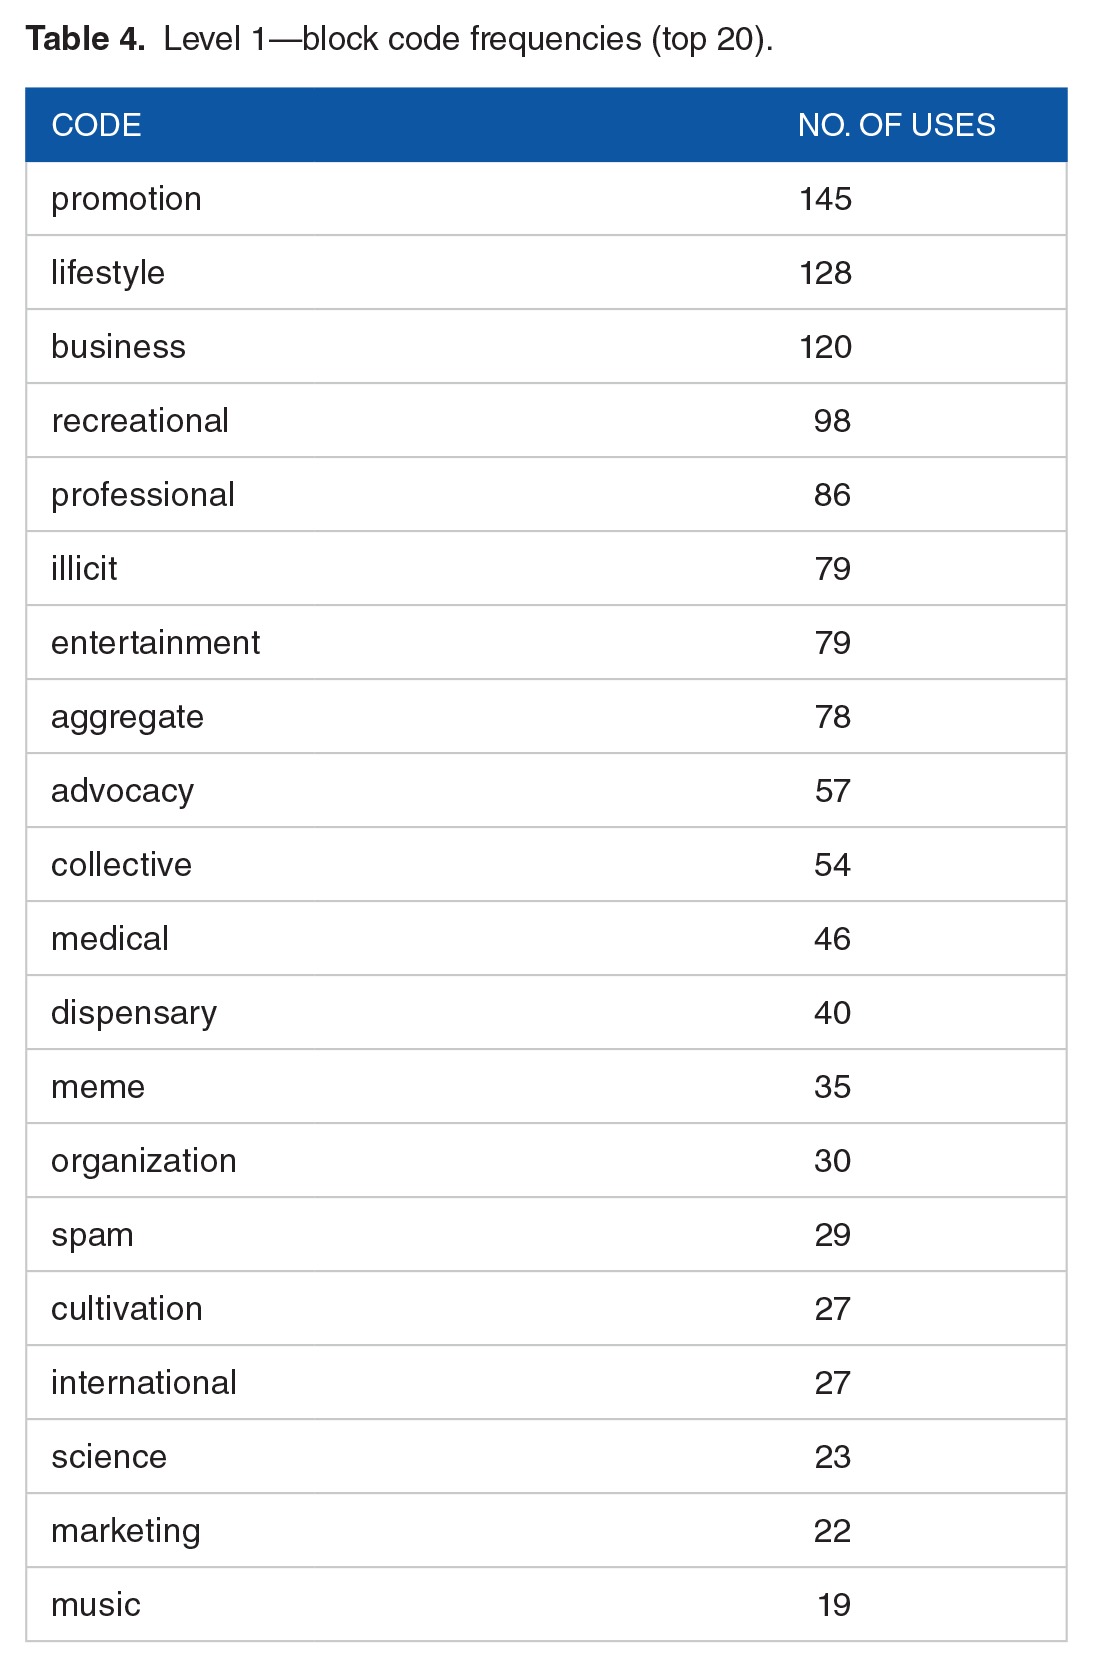
Figure 2.

A heatmap of the pairwise correlations among the top 20 most frequent codes.
For the 3 consumer population codes, recreational occurs the most frequently (n = 98), followed by illicit (n = 79) and medical (n = 46). For the illicit code, small correlations are shown for professional (−0.19), entertainment (0.19), and lifestyle (0.16). Several codes have small to moderate correlations with recreational, including promotion (−0.28), aggregate (−0.20), and lifestyle (0.21). For medical, only 2 small correlations emerge for science (0.24) and entertainment (−0.18). All 3 possible pairwise correlations consumer codes demonstrate small to moderate absolute values that range from 0.01 to 0.23.
Identifying types of cannabis consumers
For the purpose of analyzing 3 comparable consumer populations, we will focus on the blocks at level 3 of the hierarchical structure. In this level, there are 84 blocks, with an average block size of 26 179 accounts and median size 457. To further characterize these blocks, as well as validate our content analysis, we examine the most common words used in the profile descriptions of accounts within each block. We profile 9 total blocks at level 3, containing consumers in the illict, recreational, and medical blocks. To arrive at these level 3 blocks, we selected 3 of the most prominent blocks with illicit, recreational, and medical codes at level 1 and then followed them up the block hierarchy. This allows us to understand the context in which these blocks exist through aggregation with other blocks to higher levels. As such, it is important to note that these groups are not mutually exclusive and that each group contains lower level blocks with diverse characteristics. Figure 3 shows an example of a level 3 block (block 33—medical) and its associated sub-blocks.
Figure 3.

This visual representation of block 33 at level 3 contains 4 subblocks at level 2 and 7 subblocks at level 1. This illustrates the context given to level 1 blocks related to medical use: both intrablock, relationships illustrated by what other codes were used for that block, as well as an interblock understanding of which nonmedical blocks relate at a higher level.
Table 5 contains the most common aggregated codes as well as the most common words used in profile descriptions for each level 3 block.
Table 5.
Aggregate tags and account descriptions for profiled level 3 blocks.

Illicit
Blocks 6, 54, and 61 at level 3 contain consumers who exhibit patterns of illicit use based on the content analyses. These blocks contain explicit evidence of daily consumption, abuse of concentrates, and prosocial behavior. There are also groups of users under the age of 21 years contained within these blocks. In addition to the media and marketing-related codes, less prevalent codes such as memes, entertainment, and sexualization emerge within several of the sub-blocks. The corresponding codes from the account descriptions indicate similar sentiments of cannabis as part of a mainstream lifestyle, with block 61 emerging as a predominantly Oakland-based set of accounts.
Medical
Blocks 16, 28, and 33 at level 3 represent clusters of account blocks characterized as containing medical consumers. These blocks were also heavily composed of dispensaries, collectives, and related businesses. In block 33, many users also self-identify as professionals and list their place of employment in their profiles. In addition, the 3 blocks have the advocacy tag frequently occurring, which indicates a key component of medical. One block has a common profile description word of notmeus, a social justice organization based out of California. A closer examination of the most common codes from the account descriptions reveals more explicit affiliation with medical and patient groups from San Francisco, especially for block 16.
Recreational
Blocks 4, 7, and 34 contain consumers coded as recreational consumers. These users show the most diversity of all the groups, with overlap between illicit and medical blocks. This group also contains accounts from dispensaries, medical users, professionals, businesses, advocacy, and entertainment. The account descriptions further demonstrate the heterogeneity of these blocks, with block 4 sharing similarities with the medical blocks, block 7 resembling illicit blocks, and block 34 falling in between.
Discussion
This study used stochastic block modeling to identify communities of illicit, recreational, and medical cannabis users connected to dispensary accounts on Twitter. With an initial sample of 6 dispensary accounts in Oakland, California, we yielded approximately 2 million accounts that were consolidated and coded into 359 blocks at the lowest level. The hierarchical nature of the model gave us the flexibility to characterize the blocks at the most granular level and determine how these coded blocks aggregated into larger populations of cannabis consumers at higher levels. This aggregation also provided a perspective on the overlap between consumer populations and interconnections with regional cannabis networks. In addition, the dashboard developed for this project served as a data-driven tool that streamlined the content analysis and allowed for the rapid identification of distinct consumer groups. Based on these findings, this study demonstrates the utility of stochastic block modeling and multimode content analysis for identifying hidden populations of cannabis consumers on Twitter.
The initial seed of dispensaries allowed for a positional network approach where choices about nodes were purposely made based on known affiliations with the cannabis industry.40 Through this approach, the distribution of consumer blocks corresponded to distinguishable populations of medical, recreational, and illicit cannabis users with connections to multiple segments of the cannabis industry, including dispensaries, patient collectives, growers, and private investors.36,41 For example, several large blocks were predominantly comprised of self-reported medical users who clustered with dispensaries actively promoting alternative lifestyles and advertising the potential therapeutic benefits of cannabis. Conversely, there were numerous blocks of illicit users that were composed of youth and emergent adults, 2 populations that have been shown to have higher rates of cannabis use compared with older age groups.42,43 These users were also highly connected with large aggregate accounts that frequently post prosocial depictions of daily cannabis use, including regular consumption of concentrates and edibles.44 In addition, the recreational users demonstrated significant heterogeneity, with blocks ranging from working professionals and social activists to musicians and promoters in the entertainment industry. As such, the results of our study suggest that the distribution and characteristics of the consumer blocks could be used to create representative samples of illicit, recreational, and medical users nested within regional cannabis markets. Follow-up studies that leverage these samples in Internet-mediated studies will determine the generalizability of the blocks to clinical and population-based samples of cannabis users.
The scalability of the targeted consumer blocks and dashboard capabilities also has the potential to inform digital interventions and eHealth programs.45,46 Because health departments and community organizations have increasingly leveraged Twitter for public health campaigns, the characteristics of blocks may inform the personalization of health messages and creation of network measures that can be integrated into traditional program evaluations.47 There has been a similar proliferation of health service and support portals that could be adapted as mechanisms to further target consumer blocks and digitally connect consumers to skilled practitioners who can intervene in high-risk behavior.48–50 Moreover, the identification of several illicit blocks comprised of youth suggests that selective and indicated prevention strategies may be warranted to address prosocial depictions of daily consumption and abuse of high potency products as part of a mainstream lifestyle.27,28,42,43 Additional efforts will be necessary to determine the feasibility of tailoring strategies based on demographics such as sex, race, and sexual identity.
Regarding the blocks specific to Oakland and San Francisco, the account biographies in this study provided complementary information to the block codes, which allowed for geolocated consumer groups with strong affinity for communities of dispensaries and collectives. Although less than 20% of Twitter accounts provide geolocation data, the targeted sampling approach for the dispensaries in this study could be replicated to create state samples that yield geographically clustered consumers who follow dispensaries on Twitter.51 Moreover, the accounts from the 3 consumer groups could also be used for public health surveillance and pharmacovigilance of high-risk consumption patterns,52,53 especially as California continues to formalize separate medical and recreational regulatory systems under Proposition 64. Further exploration with natural language processing techniques such as tweet2vec and semantic network analysis will be necessary to create valid surveillance measures to monitor how state policies affect consumer behavior over time and perform case studies of the industry workforce, including cultivators, distributors, and dispensary staff.54–56
Several limitations of this formative study are discussed. The computational requirements to handle larger samples limited this study to only 6 dispensaries and also precluded the feasibility of longitudinal analyses. However, the targeted and theory-driven nature of the sample facilitated an appropriately manageable volume of data from the block model, which can easily be scaled to other state and community samples of dispensaries once computational demands have been balanced. With regard to the content analysis platform developed for this study, the small to moderate correlations between the qualitative codes suggest that additional refinements will be necessary to examine the relationships between blocks. In particular, cluster analytic techniques and epidemiologic methods such as latent class analysis may be better suited to examine relationships between codes and identify combinations of codes that transcend the pairwise correlations used in this study.57–59 Fortunately, both the stochastic block model and content analysis platform greatly reduced the noise typically associated with Twitter data. Given the ability of these methods to rapidly identify spam and fraudulent accounts, future studies will determine whether decision rules for metadata such as friend:follower ratios and account activity can improve the classification of consumer populations. Finally, the results from this Twitter study may not generalize to other social networks such as Facebook, Instagram, and YouTube. As many blocks of accounts in this study had content linked across platforms, a more thorough examination of social media data sources will be necessary to determine the feasibility of cross-network studies.
This study represents the first application of stochastic block modeling to empirically derive populations of cannabis consumers from a sample of dispensary accounts on Twitter. The multimode content analysis platform in this study significantly reduced the time and burden with processing large amounts of social network data. Moving forward, the creation of state repositories of dispensary accounts will serve as the basis for monitoring cannabis consumers while incorporating Internet-related measures into intervention design and outcomes evaluation. This synergy between substance use, clinical epidemiology, public health, and data science represents a key piece of understanding how complex networks of cannabis consumers behave in a dynamic political landscape.
Supplementary Materials
Acknowledgments
The authors thank Victoria Albright for her guidance on conceptualizing the study. The authors also acknowledge the contributors and authors of the Python programming language and associated libraries used in this research.
Footnotes
PEER REVIEW: Three peer reviewers contributed to the peer review report. Reviewers’ reports totaled 394 words, excluding any confidential comments to the academic editor.
FUNDING: The author(s) disclosed receipt of the following financial support for the research, authorship, and/or publication of this article: Funding for this research was provided by a Strategic Investment Fund and the Fellow Program at RTI International.
DECLARATION OF CONFLICTING INTERESTS: The author(s) declared no potential conflicts of interest with respect to the research, authorship, and/or publication of this article.
Author Contributions
PB and NP conceived and designed the experiments, analyzed the data, contributed to the writing of the manuscript, agree with manuscript results and conclusions, jointly developed the structure and arguments for the paper, and made critical revisions and approved final version. PB wrote the first draft of the manuscript. All authors reviewed and approved the final manuscript.
REFERENCES
- 1.Ballotpedia Marijuana on the ballot. [Accessed January 15, 2017]. https://ballotpedia.org/Marijuana_on_the_ballot.
- 2. ProCon.org 28 Legal medical marijuana states. [Accessed January 15, 2017]. http://medicalmarijuana.procon.org/view.resource.php?resourceID=000881.
- 3.Carter GT, Javaher SP, Nguyen MH, Garret S, Carlini BH. Re-branding cannabis: the next generation of chronic pain medicine? Pain Manag. 2015;5:13–21. doi: 10.2217/pmt.14.49. [DOI] [PubMed] [Google Scholar]
- 4.Zaller N, Topletz A, Frater S, Yates G, Lally M. Profiles of medicinal cannabis patients attending compassion centers in Rhode Island. J Psychoactive Drugs. 2015;47:18–23. doi: 10.1080/02791072.2014.999901. [DOI] [PubMed] [Google Scholar]
- 5.Reinarman C, Nunberg H, Lanthier F, Heddleston T. Who are medical marijuana patients? population characteristics from nine California assessment clinics. J Psychoactive Drugs. 2011;43:128–135. doi: 10.1080/02791072.2011.587700. [DOI] [PubMed] [Google Scholar]
- 6.O’Connell TJ, Bou-Matar CB. Long term marijuana users seeking medical cannabis in California. 2001–2007; demographics, social characteristics, patterns of cannabis and other drug use of 4117 applicants. Harm Reduct J. 2007;4:16. doi: 10.1186/1477-7517-4-16. [DOI] [PMC free article] [PubMed] [Google Scholar]
- 7.Woodruff SI, McCabe CT, Hohman M, et al. Characteristics of cannabis-only and other drug users who visit the emergency department. Cannabis Cannabinoid Res. 2016;1:149–153. doi: 10.1089/can.2016.0012. [DOI] [PMC free article] [PubMed] [Google Scholar]
- 8.Woodruff SI, Shillington AM. Sociodemographic and drug use severity differences between medical marijuana users and non-medical users visiting the emergency department. Am J Addict. 2016;25:385–391. doi: 10.1111/ajad.12401. [DOI] [PubMed] [Google Scholar]
- 9.Roy-Byrne P, Maynard C, Bumgardner K, et al. Are medical marijuana users different from recreational users? The view from primary care. Am J Addict. 2015;24:599–606. doi: 10.1111/ajad.12270. [DOI] [PubMed] [Google Scholar]
- 10.Richmond MK, Pampel FC, Rivera LS, Broderick KB, Reimann B, Fischer L. Frequency and risk of marijuana use among substance-using health care patients in Colorado with and without access to state legalized medical marijuana. J Psychoactive Drugs. 2015;47:1–9. doi: 10.1080/02791072.2014.991008. [DOI] [PubMed] [Google Scholar]
- 11.Reiman A. Cannabis as a substitute for alcohol and other drugs. Harm Reduct J. 2009;6:35. doi: 10.1186/1477-7517-6-35. [DOI] [PMC free article] [PubMed] [Google Scholar]
- 12.Boehnke KF, Litinas E, Clauw DJ. Medical cannabis use is associated with decreased opiate medication use in a retrospective cross-sectional survey of patients with chronic pain. J Pain. 2016;6:739–744. doi: 10.1016/j.jpain.2016.03.002. [DOI] [PubMed] [Google Scholar]
- 13.Nunberg H, Kilmer B, Pacula RL, Burgdorf J. An analysis of applicants presenting to a medical marijuana specialty practice in California. J Drug Policy Anal. 2011;4:1. doi: 10.2202/1941-2851.1017. [DOI] [PMC free article] [PubMed] [Google Scholar]
- 14.Janichek JL, Reiman A. Clinical service desires of medical cannabis patients. Harm Reduct J. 2012;9:12. doi: 10.1186/1477-7517-9-12. [DOI] [PMC free article] [PubMed] [Google Scholar]
- 15.Reiman AE. Self-efficacy, social support and service integration at medical cannabis facilities in the San Francisco Bay area of California. Health Soc Care Community. 2008;16:31–41. doi: 10.1111/j.1365-2524.2007.00722.x. [DOI] [PubMed] [Google Scholar]
- 16.Satterlund TD, Lee JP, Moore RS. Stigma among California’s medical marijuana patients. J Psychoactive Drugs. 2015;47:10–17. doi: 10.1080/02791072.2014.991858. [DOI] [PMC free article] [PubMed] [Google Scholar]
- 17.Iguchi MY, Ober AJ, Berry SH, et al. Simultaneous recruitment of drug users and men who have sex with men in the United States and Russia using respondent-driven sampling: sampling methods and implications. J Urban Health. 2009;86:5–31. doi: 10.1007/s11524-009-9365-4. [DOI] [PMC free article] [PubMed] [Google Scholar]
- 18.Zule WA, Bobashev GV, Wechsberg WM, Costenbader EC, Coomes CM. Behaviorally bisexual men and their risk behaviors with men and women. J Urban Health. 2009;86:48–62. doi: 10.1007/s11524-009-9366-3. [DOI] [PMC free article] [PubMed] [Google Scholar]
- 19.Dilkes-Frayne E. Drugs at the campsite: socio-spatial relations and drug use at music festivals. Int J Drug Policy. 2016;33:27–35. doi: 10.1016/j.drugpo.2015.10.004. [DOI] [PubMed] [Google Scholar]
- 20.Dilkes-Frayne E. Tracing the “event” of drug use: “context” and the coproduction of a night out on MDMA. Contemp Drug Probl. 2014;41:445–479. [Google Scholar]
- 21.Palamar JJ, Acosta P, Ompad DC, Cleland CM. Self-reported ecstasy/MDMA/“molly” use in a sample of nightclub and dance festival attendees in New York City. Subst Use Misuse. 2017;52:82–91. doi: 10.1080/10826084.2016.1219373. [DOI] [PMC free article] [PubMed] [Google Scholar]
- 22.Kral AH, Malekinejad M, Vaudrey J, et al. Comparing respondent-driven sampling and targeted sampling methods of recruiting injection drug users in San Francisco. J Urban Health. 2010;87:839–850. doi: 10.1007/s11524-010-9486-9. [DOI] [PMC free article] [PubMed] [Google Scholar]
- 23.Balatsoukas P, Kennedy CM, Buchan I, Powell J, Ainsworth J. The role of social network technologies in online health promotion: a narrative review of theoretical and empirical factors influencing intervention effectiveness. J Med Internet Res. 2015;17:e141. doi: 10.2196/jmir.3662. [DOI] [PMC free article] [PubMed] [Google Scholar]
- 24.Lane TS, Armin J, Gordon JS. Online recruitment methods for Web-based and mobile health studies: a review of the literature. J Med Internet Res. 2015;17:e183. doi: 10.2196/jmir.4359. [DOI] [PMC free article] [PubMed] [Google Scholar]
- 25.Miller EA, West DM. Where’s the revolution? Digital technology and health care in the internet age. J Health Polit Policy Law. 2009;34:261–284. doi: 10.1215/03616878-2008-046. [DOI] [PubMed] [Google Scholar]
- 26.Miller PG, Sønderlund AL. Using the internet to research hidden populations of illicit drug users: a review. Addiction. 2010;105:1557–1567. doi: 10.1111/j.1360-0443.2010.02992.x. [DOI] [PubMed] [Google Scholar]
- 27.Cavazos-Rehg P, Krauss M, Grucza R, Bierut L. Characterizing the followers and tweets of a marijuana-focused Twitter handle. J Med Internet Res. 2014;16:e157. doi: 10.2196/jmir.3247. [DOI] [PMC free article] [PubMed] [Google Scholar]
- 28.Cavazos-Rehg PA, Krauss M, Fisher SL, Salyer P, Grucza RA, Bierut LJ. Twitter chatter about marijuana. J Adolesc Health. 2015;56:139–145. doi: 10.1016/j.jadohealth.2014.10.270. [DOI] [PMC free article] [PubMed] [Google Scholar]
- 29.Hawe P, Webster C, Shiell A. A glossary of terms for navigating the field of social network analysis. J Epidemiol Community Health. 2004;58:971–975. doi: 10.1136/jech.2003.014530. [DOI] [PMC free article] [PubMed] [Google Scholar]
- 30.REST APIs — Twitter Developers [Accessed January 17, 2017]. https://dev.twitter.com/rest/public.
- 31.Caldarelli G, Chessa A. Data Science and Complex Networks: Real Case Studies with Python. Oxford, UK: Oxford University Press; 2016. [Google Scholar]
- 32.Blondel VD, Guillaume J-L, Lambiotte R, Lefebvre E. Fast unfolding of communities in large networks. J Stat Mech. 2008:10008. [Google Scholar]
- 33.Newman MEJ. Modularity and community structure in networks. Proc Natl Acad Sci U S A. 2006;103:8577–8582. doi: 10.1073/pnas.0601602103. [DOI] [PMC free article] [PubMed] [Google Scholar]
- 34.Newman MEJ, Clauset A. Structure and inference in annotated networks. Nat Commun. 2016;1863;7:1. doi: 10.1038/ncomms11863. [DOI] [PMC free article] [PubMed] [Google Scholar]
- 35.Puck Rombach M, Porter MA, Fowler JH, Mucha PJ. Core-periphery structure in networks. SIAM J Appl Math. 2012;74:167–190. [Google Scholar]
- 36.Hamad EO, Savundranayagam MY, Holmes JD, Kinsella EA, Johnson AM. Toward a mixed-methods research approach to content analysis in the digital age: the combined content-analysis model and its applications to health care Twitter feeds. J Med Internet Res. 2016;18:e60. doi: 10.2196/jmir.5391. [DOI] [PMC free article] [PubMed] [Google Scholar]
- 37.Twitter Audit Audit your Twitter followers. [Accessed January 11, 2017]. https://www.twitteraudit.com.
- 38.McKinney W. Data structures for statistical computing in python; Proceedings of the 9th Python in Science Conference; SciPy 2010; Austin, TX. June 28–July 3. [Google Scholar]
- 39.Peixoto PT. The graph-tool python library. Figshare. 2014 doi: 10.6084/m9.figshare.1164194. [DOI] [Google Scholar]
- 40.Contractor N, Monge P, Leonardi PM. Multidimensional networks and the dynamics of sociomateriality: bringing technology inside the network. Int J Commun Syst. 2011;5:39. [Google Scholar]
- 41.O’Halloran KL, Tan S, Pham D-S, Bateman J, Vande Moere A. A digital mixed methods research design: integrating multimodal analysis with data mining and information visualization for big data analytics [published online ahead of print May 31, 2016] J Mix Method Res. doi: 10.1177/1558689816651015. [DOI] [Google Scholar]
- 42.Cabrera-Nguyen EP, Cavazos-Rehg P, Krauss M, Bierut LJ, Moreno MA. Young adults’ exposure to alcohol- and marijuana-related content on Twitter. J Stud Alcohol Drugs. 2016;77:349–353. doi: 10.15288/jsad.2016.77.349. [DOI] [PMC free article] [PubMed] [Google Scholar]
- 43.Krauss MJ, Grucza RA, Bierut LJ, Cavazos-Rehg PA. “Get drunk. Smoke weed. Have fun.”: a content analysis of Tweets about marijuana and alcohol. Am J Health Promot. 2017;31:200–208. doi: 10.4278/ajhp.150205-QUAL-708. [DOI] [PMC free article] [PubMed] [Google Scholar]
- 44.Cavazos-Rehg PA, Sowles SJ, Krauss MJ, Agbonavbare V, Grucza R, Bierut L. A content analysis of tweets about high-potency marijuana. Drug Alcohol Depen. 2016;166:100–108. doi: 10.1016/j.drugalcdep.2016.06.034. [DOI] [PMC free article] [PubMed] [Google Scholar]
- 45.Thackeray R, Burton SH, Giraud-Carrier C, Rollins S, Draper CR. Using Twitter for breast cancer prevention: an analysis of breast cancer awareness month. BMC Cancer. 2013;13:508. doi: 10.1186/1471-2407-13-508. [DOI] [PMC free article] [PubMed] [Google Scholar]
- 46.Rickwood D, Webb M, Kennedy V, Telford N. Who are the young people choosing Web-based mental health support? findings from the implementation of Australia’s National Web-based Youth Mental Health Service, eheadspace. JMIR Ment Health. 2016;3:e40. doi: 10.2196/mental.5988. [DOI] [PMC free article] [PubMed] [Google Scholar]
- 47.Borgatti SP. Centrality and network flow. Soc Networks. 2005;27:55–71. [Google Scholar]
- 48.Victorson D, Banas J, Smith J, et al. eSalud: designing and implementing culturally competent ehealth research with latino patient populations. Am J Public Health. 2014;104:2259–2265. doi: 10.2105/AJPH.2014.302187. [DOI] [PMC free article] [PubMed] [Google Scholar]
- 49.Shanahan CW, Sorensen-Alawad A, Carney BL, et al. The implementation of an integrated information system for substance use screening in general medical settings. Appl Clin Inform. 2014;5:878–894. doi: 10.4338/ACI-2014-03-RA-0025. [DOI] [PMC free article] [PubMed] [Google Scholar]
- 50.Ye XC, Ng I, Seid-Karbasi P, et al. Portal for families overcoming neurodevelopmental disorders (PFOND): implementation of a software framework for facilitated community website creation by nontechnical volunteers. JMIR Res Protoc. 2013;2:e25. doi: 10.2196/resprot.2675. [DOI] [PMC free article] [PubMed] [Google Scholar]
- 51.Takhteyev Y, Gruzd A, Wellman B. Geography of Twitter networks. Soc Networks. 2012;34:73–81. [Google Scholar]
- 52.Norén GN. Pharmacovigilance for a revolving world: prospects of patient-generated data on the internet. Drug Saf. 2014;37:761–764. doi: 10.1007/s40264-014-0205-4. [DOI] [PubMed] [Google Scholar]
- 53.Sarker A, O’Connor K, Ginn R, et al. Social media mining for toxicovigilance: automatic monitoring of prescription medication abuse from Twitter. Drug Saf. 2016;39:231–240. doi: 10.1007/s40264-015-0379-4. [DOI] [PMC free article] [PubMed] [Google Scholar]
- 54.Barratt MJ, Potter GR, Wouters M, et al. Lessons from conducting trans-national Internet-mediated participatory research with hidden populations of cannabis cultivators. Int J Drug Policy. 2015;26:238–249. doi: 10.1016/j.drugpo.2014.12.004. [DOI] [PubMed] [Google Scholar]
- 55.Cato KD, Bockting W, Larson E. Did I tell you that? ethical issues related to using computational methods to discover non-disclosed patient characteristics. J Empir Res Hum Res Ethics. 2016;11:214–219. doi: 10.1177/1556264616661611. [DOI] [PMC free article] [PubMed] [Google Scholar]
- 56.Kavuluru R, Sabbir AKM. Toward automated e-cigarette surveillance: spotting e-cigarette proponents on Twitter. J Biomed Inform. 2016;61:19–26. doi: 10.1016/j.jbi.2016.03.006. [DOI] [PMC free article] [PubMed] [Google Scholar]
- 57.Lubke GH, Muthén B. Investigating population heterogeneity with factor mixture models. Psychol Methods. 2005;10:21–39. doi: 10.1037/1082-989X.10.1.21. [DOI] [PubMed] [Google Scholar]
- 58.Aggarwal CC, Zhai C. A survey of text clustering algorithms. In: Aggarwal CC, Zhai C, editors. Mining Text Data. New York, NY: Springer; 2012. pp. 77–128. [Google Scholar]
- 59.Tighe PJ, Goldsmith RC, Gravenstein M, Bernard HR, Fillingim RB. The painful tweet: text, sentiment, and community structure analyses of tweets pertaining to pain. J Med Internet Res. 2015;17:e84. doi: 10.2196/jmir.3769. [DOI] [PMC free article] [PubMed] [Google Scholar]
Associated Data
This section collects any data citations, data availability statements, or supplementary materials included in this article.