Abstract
Little is known about the unique contribution of schools vs neighborhoods in driving adolescent marijuana use. This study examined the relative contribution of each setting and the influence of school and neighborhood socioeconomic status on use. We performed a series of cross-classified multilevel logistic models predicting past 30-day adolescent (N = 18 329) and young adult (N = 13 908) marijuana use using data from Add Health. Marijuana use differed by age, sex, race/ethnicity, and public assistance in adjusted models. Variance parameters indicated a high degree of clustering by school (σ2 = 0.30) and less pronounced clustering by neighborhood (σ2 = 0.06) in adolescence when accounting for both levels simultaneously in a cross-classified multilevel model. Clustering by school persisted into young adulthood (σ2 = 0.08). Parental receipt of public assistance increased the likelihood of use during adolescence (odds ratio = 1.39; 95% confidence interval: 1.19–1.59), and higher parental education was associated with increased likelihood of use in young adulthood. These findings indicate that both contexts may be promising locations for intervention.
Keywords: Marijuana, adolescence, emerging adulthood, contextual effects, school, neighborhood, cross-classified models, multilevel modeling
Background and Aims
In 1996, California made history as the first state to pass medical marijuana legislation; substantial changes in US state-level marijuana policies have occurred since then.1 As of the 2016 election, 8 states have retail marijuana; Washington, DC has legalized possession and cultivation; and 23 additional states have passed decriminalization and/or medical marijuana laws.2 Although it has been hypothesized that the national trend toward loosening restrictions on marijuana would lead to increases in adolescent marijuana use,3 national data do not confirm those expectations. The prevalence of past 30-day use among US high school students decreased to 23.4% in 2013, from 26.7% in 2009.4,5 There are also a number of methodologically rigorous studies concluding that medical marijuana laws have not led to increases in adolescent marijuana use.6–8 Given the rapid pace of policy change, continued monitoring of changes in the prevalence of adolescent marijuana use is a key public health priority.9 Concern about the public health consequences of more liberal marijuana policies has stimulated epidemiologic research on marijuana use, and this work has highlighted large gaps in knowledge about how contextual and psychosocial factors are associated with adolescent marijuana, particularly in comparison with what is known about alcohol or tobacco use. Now more than ever, we need to identify how psychosocial factors affect risk for adolescent marijuana use6 so as to provide a foundation for the development of effective prevention strategies.10
Socioeconomic status (SES) may be a key marker of risk for engagement in marijuana use. Defined as the “relative position of a family or individual on a hierarchical social structure, based on access to or control over wealth, prestige, resources, and power,”11 SES is a strong predictor of health status throughout the life course; SES in adolescence has implications for future adult health and behaviors.11–14 Specifically, low SES in childhood increases risk for several adolescent risk behaviors, including cigarette smoking, poor nutrition, and sedentary behavior.15 The nature of the association between SES and marijuana use is unclear.15–17 The best evidence suggests that the association is not linear and varies by age, sex, and race/ethnicity.16–18 Summary data from the Monitoring the Future study show that low parental education is associated with higher use among 8th graders but not among 12th graders. Those data also indicate that the associations between family SES and marijuana use are stronger among whites as compared with blacks or Hispanics.19 Finally, although low SES (eg, poverty) is typically associated with poor health outcomes, research shows that high family SES may be a marker of risk for adolescent marijuana use.20
Socioeconomic status does not operate solely at the level of adolescents or their families. Several researchers have noted the importance of investigating how “contextual” SES—ie, the SES of the contexts in which adolescents are embedded—relates to health and behavior. There is an insufficient body of research available that describes how contextual SES relates to adolescent marijuana use and that is the focus on this study. We used cross-classified multilevel modeling (CCMM)21 to estimate the influence of the school and neighborhood contexts simultaneously and to incorporate contextual measures of SES. The CCMM approach is superior to hierarchical multilevel modeling when examining nonhierarchical contexts. Hierarchical multilevel modeling overestimates the importance of contexts under consideration (eg, schools) when cross-classified contexts that are salient (eg, neighborhoods) are eliminated from the model.21
To address gaps in knowledge about the association between SES and marijuana use, we examined the extent to which individual-level, school-level, and neighborhood-level SES in adolescence were associated with marijuana use in adolescence and young adulthood. We used CCMM to estimate the independent and joint influence of schools and neighborhoods on use, whereas also examining individual-level effects. This study had 2 aims. First, we estimated the level of variation in marijuana use in schools and neighborhoods: (1) cross-sectionally, among a national sample of 12- to 19-year olds and (2) longitudinally, when the same respondents were 24- to 32-year olds. In the longitudinal analysis, we nested respondents in the neighborhood they resided in and school they attended as adolescents and estimate their risk for marijuana use in adulthood. This enabled us to determine the extent to which clustering at the school and neighborhood levels persists into adulthood.22 Second, we examined the association between SES at the family, school, and neighborhood levels in adolescence with (1) adolescent marijuana use and (2) marijuana use in young adulthood. Data are from the National Longitudinal Study of Adolescent to Adult Health (Add Health), a nationally representative longitudinal survey of adolescents in the United States.23
Methods
Data source
Add Health is a school-based sample of adolescents who were in grades 7 to 12 when first interviewed in 1994–1995 (Wave I). The sampling strategy consisted of a systematic random sample of high schools and “feeder” schools (ie, middle schools whose students matriculate into the selected high school). A total of 132 schools participated, which was 79% of those sampled. An in-school survey was completed by 90 118 students, and 20 745 students participated in an additional, detailed in-home interview (75.6% and 79.5% of eligible students, respectively). During the in-home interview, 85% of students’ caregivers (usually the mother) were also interviewed (85%, n = 17 760).23–25
We used Wave I data from the in-school survey, in-home interview, and the parent questionnaire. Individual-level data were drawn from the 20 745 youth who completed the in-home survey. Respondents whose caregivers had not completed the parent survey were retained in the sample. We excluded those who were missing information on: school (n = 660), marijuana use (n = 402), other individual-level predictors or covariates (n = 845), school-level demographics (n = 493), or neighborhood-level demographics (n = 16). Our analytic sample included 18 329 students nested in 128 schools and 2255 neighborhoods (ie, census tracts) for the cross-sectional analysis. Data from the Wave IV in-home interview (collected in 2008–2009) were used to explore the longitudinal effects of school and neighborhood on marijuana use in young adulthood for 13 908 participants who were not missing any variables at Wave I and for whom there was data available on past 30-day marijuana use at Wave IV.
Measures
Marijuana use
The primary outcome variable was past 30-day marijuana use at Wave I. Respondents indicated the frequency of marijuana use in the past 30 days, which we recoded to create a binary outcome. Past 30-day marijuana use in young adulthood at Wave IV was constructed in a similar manner.
Socioeconomic status
We used 2 indicators of SES: receipt of public assistance as a proxy for poverty and parental educational attainment as a graded indicator of status. The individual-level indicators for family receipt of public assistance (eg, enrollment in the Aid to Families with Dependent Children program) and parental educational attainment were constructed from the parent report, if available, and from the adolescent participant report if a parent did not provide information. We used parent report of educational attainment to develop a 4-level variable representing the highest level of parent education among all resident caregivers. The categories were as follows: (1) did not complete high school, (2) graduated from high school (including completion of an equivalency test), (3) attended college, and (4) completed college.
For both indicators (ie, receipt of public assistance and parental education), we created analogous variables at the school and neighborhood levels. Individual reports of receipt of public assistance from the total in-school sample were aggregated by school to construct a school-level measure of the percentage of students receiving public assistance. The school-level measure of parental education was constructed to reflect the proportion of students in that school with at least 1 parent who had completed college, aggregated to the school-level from individual responses to the in-school survey. Data on neighborhood-level SES public assistance and educational attainment come from 2 variables from the 1990 US Census: percentage of families currently receiving public assistance, and the percentage of residents (>25 years old) with a college degree or above.
Demographic factors
We included sex, age, and race/ethnicity as covariates. Self-reported race and ethnicity were used to construct a single variable with the following categories: white, black/African American, Hispanic, Asian/Pacific Islander, Native American, other, and multiracial.
Statistical analysis
Initially, we present descriptive statistics on individual-level demographic and SES factors overall and by Wave I and Wave IV past 30-day marijuana use. Differences in marijuana use by demographic factors were examined using chi-square tests. Descriptive and bivariate statistics were computed using SAS (version 9.4; Cary, NC, USA).
In the remaining analyses, we use cross-classified multilevel logistic regression models to examine: (1) between-level variation (random effects) in past 30-day marijuana use during adolescence and young adulthood and (2) individual-level, school-level, and neighborhood-level predictors of past 30-day marijuana use (fixed effects) in adolescence and young adulthood. In addition to the predictors discussed above, age, race/ethnicity, and sex were included in the models as covariates. Models were fit using MLwiN (version 2.29; Birmingham, UK) with the STATA (version 13; College Station, TX, USA) package runmlwin.26 Multilevel and cross-classified multilevel models automatically adjust for sample size of schools and neighborhoods, down-weighting the importance of schools and neighborhoods with small sample sizes so that they do not bias estimates of random effects. The software uses Bayesian estimation procedures and Markov Chain Monte Carlo methods with noninformative priors and a Metropolis-Hastings sampling algorithm allowing for simultaneous modeling of nonhierarchically nested contexts. The deviance information criterion (DIC) was used to assess model fit with lower values indicating better model fit.27–30 Odds ratios and 95% credible intervals (CIs) are presented for fixed effects, parameter estimates and standard errors for intercepts, and variance estimates and 95% CIs for random effects.
Model building proceeded in several steps. First, we examined the independent contributions of neighborhood and school contexts (separately) on the outcome using 2-level hierarchical null (or unconditional) models. These models were fit by including individuals nested within either the school or the neighborhood level. Next, school and neighborhood contexts were examined simultaneously by allowing for cross-classification of the 2 contexts and compared with the single-context only models to verify that cross-classification was necessary in these analyses. Subsequent models incorporated this cross-classification of school and neighborhood. Specifically, a series of 4 models were fit to predict past 30-day marijuana use during adolescence (Wave I): (1) individual-level predictors and covariates, (2) individual predictors and covariates plus school-level demographics, (3) individual predictors and covariates plus neighborhood-level demographics, and (4) all individual-level, school-level, and neighborhood-level predictors and covariates. A similar series of 4 models were fit predicting past 30-day marijuana use during young adulthood (Wave IV) including Wave IV age as a covariate.
Results
Description of sample
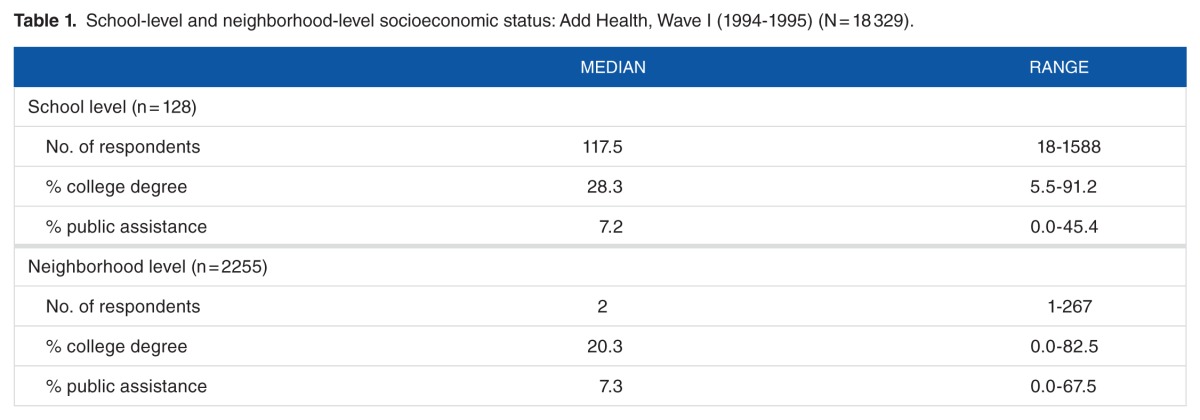
Among the 18 329 respondents included at Wave I, there were 2760 unique combinations of school and neighborhood. The data structure was fully cross-classified; adolescents attending the same school resided in multiple neighborhoods, and adolescents residing in the same neighborhood often attended different schools in the same neighborhood. The median number of students per school was 117.5 (range: 18–1588, n = 128 schools; Table 1). In total, 45% of neighborhoods (n = 1017) had only 1 respondent, and the median number of adolescents per neighborhood was 2 (range: 1–267, n = 2255 neighborhoods). There was a median of 1 school per neighborhood (range: 1–3) and a median of 13.5 neighborhoods per school (range: 1–224).
Table 1.
School-level and neighborhood-level socioeconomic status: Add Health, Wave I (1994–1995) (N = 18 329).
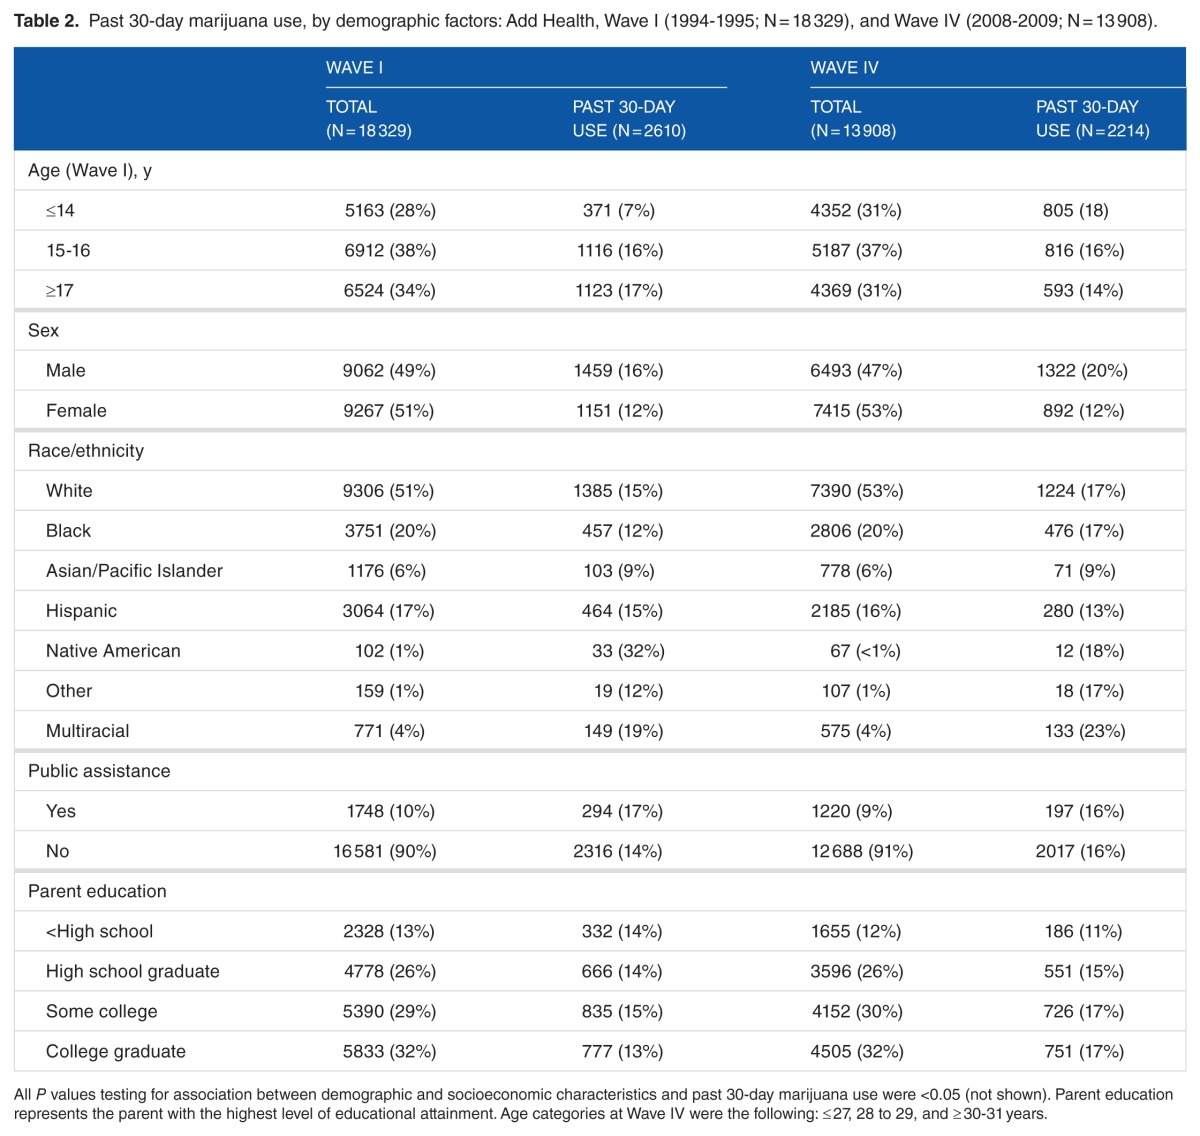
Table 2 presents descriptive statistics for the sample, as well as prevalence estimates for past 30-day marijuana use during adolescence (Wave I) and young adulthood (Wave IV) overall, and by demographic factors. In total, 51% of respondents were white, 49% were men, and the mean age at Wave I was 15.6 (SD: 1.7). Also, at Wave I, 32% had a parent with a college degree and 10% reported receiving public assistance.
Table 2.
Past 30-day marijuana use, by demographic factors: Add Health, Wave I (1994–1995; N = 18 329), and Wave IV (2008–2009; N = 13 908).
The past 30-day prevalence of marijuana use at Wave I was 14.2% and 15.9% at Wave IV (Table 2). Use was higher among men compared with women at both time periods. The prevalence of use increased with age at Wave I and decreased with age at Wave IV. At Wave I, Native American and multiracial respondents had the highest rates of use (32% and 19%), whereas Asians had the lowest (9%). The prevalence for all other groups ranged between 12% and 15%. Native American and multiracial respondents also had the highest rates of use in young adulthood (18% and 23%), but they were not substantially higher than for the other groups (range: 9%–17%). Across all schools, the median percentage of students reporting past 30-day marijuana use was 11% (range: 0%–34%). Figure 1 presents a histogram of school percentage of students reporting past 30-day use indicating a wide degree of variation in marijuana use at the school level. Across neighborhoods, the median percentage of respondents reporting marijuana use was 0% (range: 0%–100%).
Figure 1.
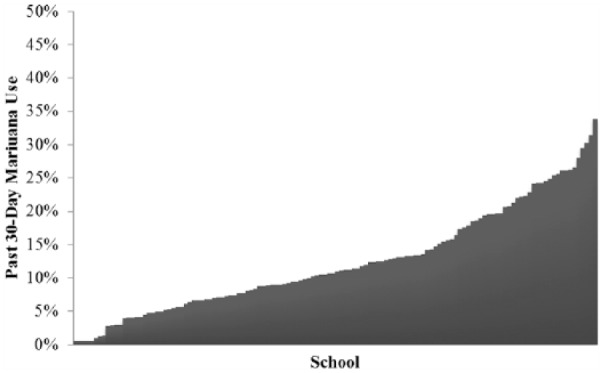
Percentage of students reporting past 30-day marijuana use by school (n = 128 schools): Add Health, Wave I (1994–1995) (N = 18 329).
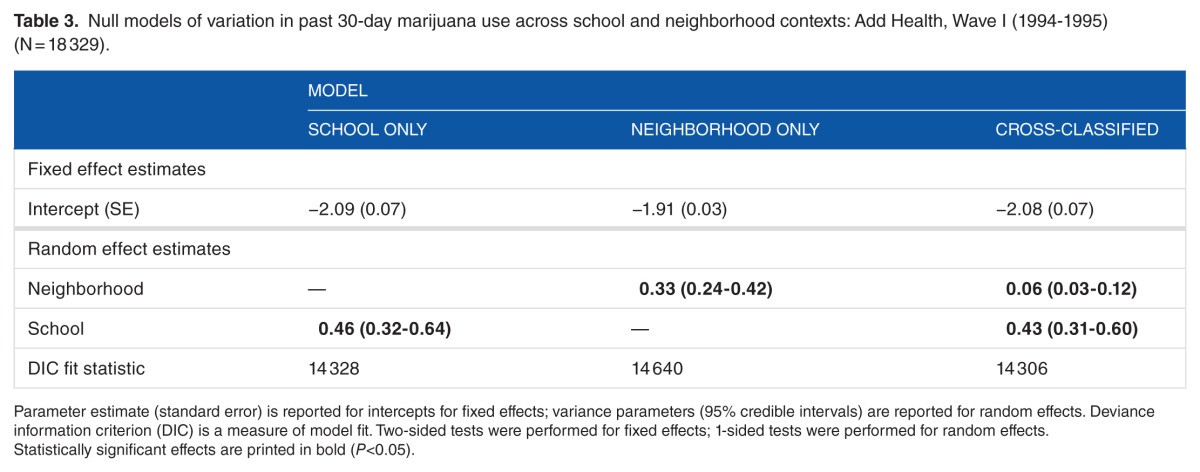
Table 3 presents fixed and random effects for the school-only, neighborhood-only, and cross-classified null models. Results from the single-context models would seem to indicate that there is similar variability at the school level or neighborhood level when the other context is not considered. Between-school variance in the school-only model was 0.46 (95% CI: 0.32–0.64), compared with the between-neighborhood variance estimate of 0.33 (0.24–0.42) for the neighborhood-only model. However, considering both contexts simultaneously in the cross-classified model shows that most of the between-level variability in marijuana smoking is at the school level , whereas the between-neighborhood variance is diminished after accounting for school level. This reinforces the necessity of conducting CCMM in this study, and cross-classification was used in all subsequent models.
Table 3.
Null models of variation in past 30-day marijuana use across school and neighborhood contexts: Add Health, Wave I (1994–1995) (N = 18 329).
Cross-sectional analysis examining marijuana use during adolescence
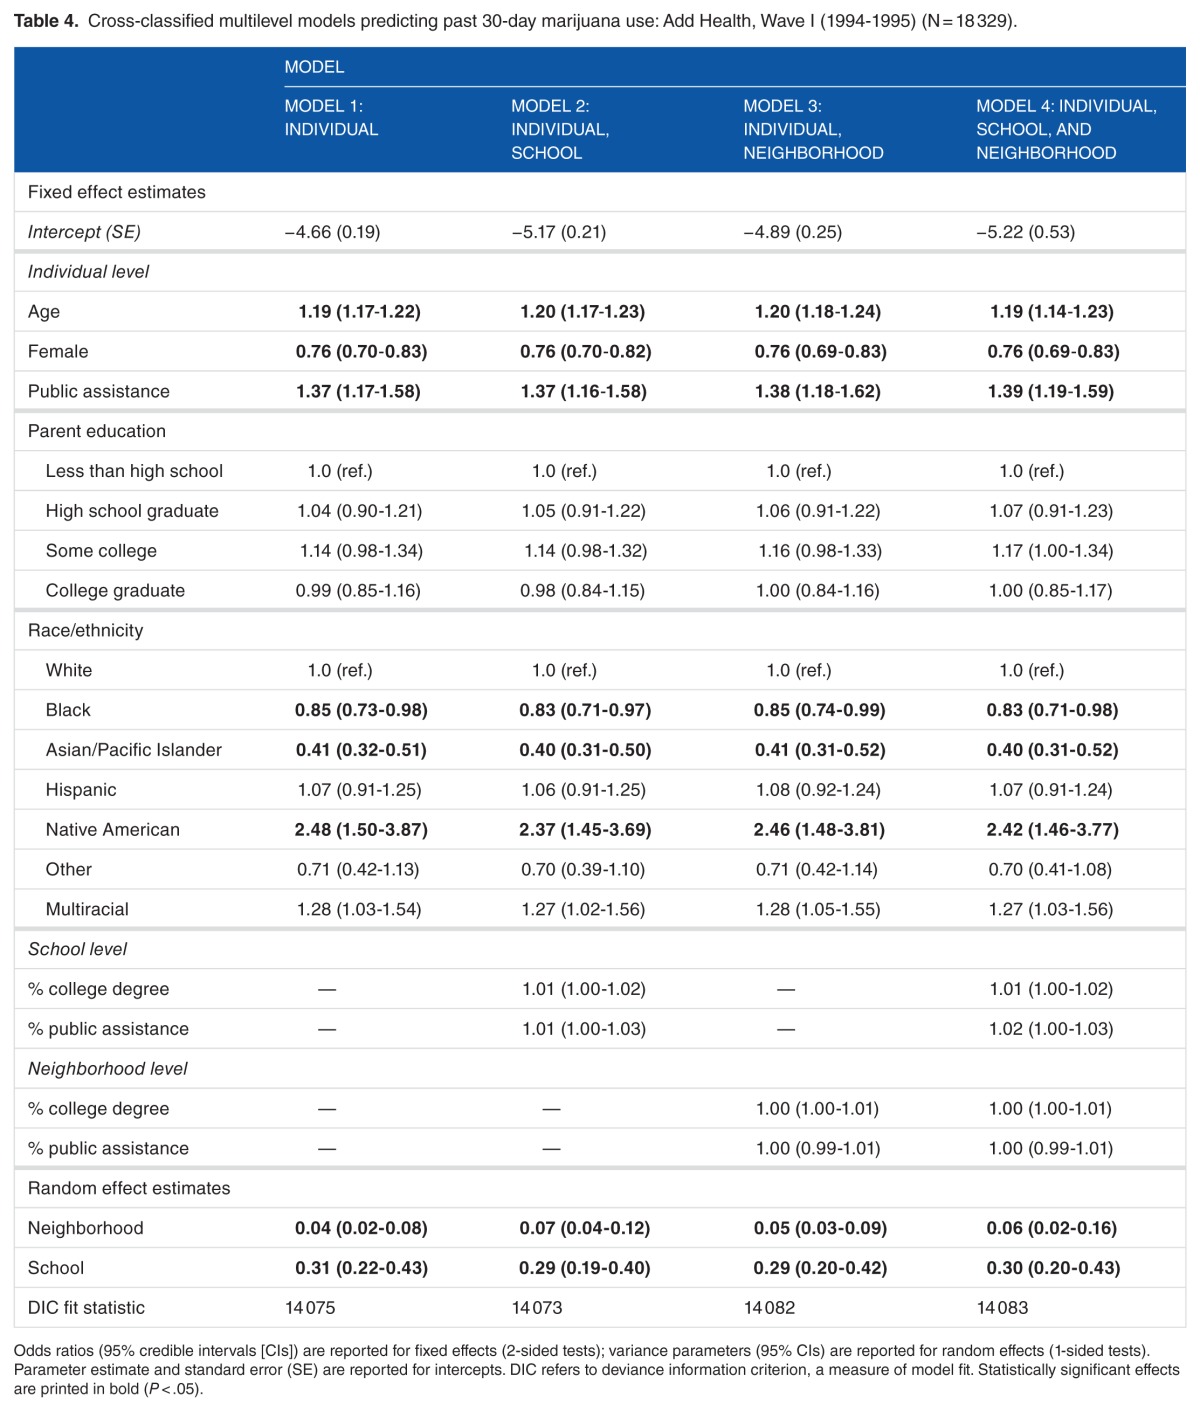
Table 4 presents fixed and random effects from the 4 logistic CCMMs of Wave I marijuana use. Model 1 included individual-level predictors and covariates only. Adding individual-level fixed effects to the null cross-classified model (from Table 3) mildly attenuated between-school variance with minimal effect on neighborhood-level variance . Receiving public assistance, male sex, and older age are associated with an increased odds of past 30-day marijuana use. Relative to whites, blacks, and Asian/Pacific Islanders demonstrated lower odds of marijuana use, whereas Native American and multiracial respondents demonstrated higher odds of marijuana use. There was no association between parental education and recent marijuana use.
Table 4.
Cross-classified multilevel models predicting past 30-day marijuana use: Add Health, Wave I (1994–1995) (N = 18 329).
Table 4 also presents Models 2 to 4, which include individual predictors and covariates along with: school-level factors (model 2), neighborhood-level factors (model 3), and both school-level and neighborhood-level factors (model 4). Trends in individual covariates persist after adjusting for school-level and neighborhood-level demographics. Importantly, no school-level or neighborhood-level indicators of SES covariates were associated with marijuana use.
Two sets of post hoc analyses were conducted to explore these results further.
First, we performed additional sensitivity analyses on the fully adjusted cross-sectional Wave I outcome in adolescence to examine the effect of neighborhood size on our ability to estimate the variance parameters. One potential concern was that having many neighborhoods in the sample with small sample size might bias our estimates of the neighborhood-level variance despite the automatic downweighting of neighborhoods with small sample size in the CCMM estimation. We performed the following 2 sensitivity analyses: (1) dropping any neighborhoods with only 1 respondent (dropping n = 1017 neighborhoods; N = 1017 participants) and (2) dropping any neighborhoods with fewer than 5 respondents (dropping n = 1660 neighborhoods; N = 2693 participants). We present the variance parameters and 95% CIs for these sensitivity analyses and the original analysis (model 4; Table 4) in Supplemental Table 1. Excluding neighborhoods with only 1 respondent yielded similar variance parameters at the school (σ2 = 0.28) and neighborhood (σ2 = 0.06) in the fully adjusted model predicting adolescent marijuana use. Excluding neighborhoods with fewer than 5 respondents also yielded similar results Both the neighborhood and school variance parameters are robust to excluding small neighborhoods despite many neighborhoods having only 1 respondent.
Second, we explored the meaningfulness of the cross-sectional school-level variance result . The school-level variance parameter describes the variation between schools in the magnitude of the school-level effects. In other words, assuming a causal interpretation, attending a certain school may increase or decrease the likelihood of a given adolescent using marijuana. This “school effect” for each school can be estimated after the model is fit. These posterior estimates of the random effects are also known as empirical Bayes estimates or best linear unbiased predictions (BLUPs). Calculating BLUPs and then comparing their magnitude with other significant fixed effects can therefore help us to understand the meaningfulness of the school-level variance results. In this case, we compare the magnitude of the BLUPs from the cross-sectional fully CCMM (model 4; Table 4) to the magnitude of the fixed effects for female sex and receipt of public assistance. As noted above, female sex is protective against marijuana use in Wave I, and on the log odds scale, this difference is −0.28. Of the 128 schools in the sample, 67 (52.3%) have a school effect (BLUP) of this magnitude or larger (in terms of absolute values). Receipt of public assistance is associated with increased odds of marijuana use in Wave I, and on the log odds scale, this difference is 0.32. Of the 128 schools, 61 (47.7%) have a school effect of this magnitude or larger. These are substantial and meaningful differences between schools in the “school effect.” In approximately half of schools, attending those schools is associated with a greater impact on student likelihood to use marijuana than public assistance or female sex.
Longitudinal analyses examining marijuana use in young adulthood
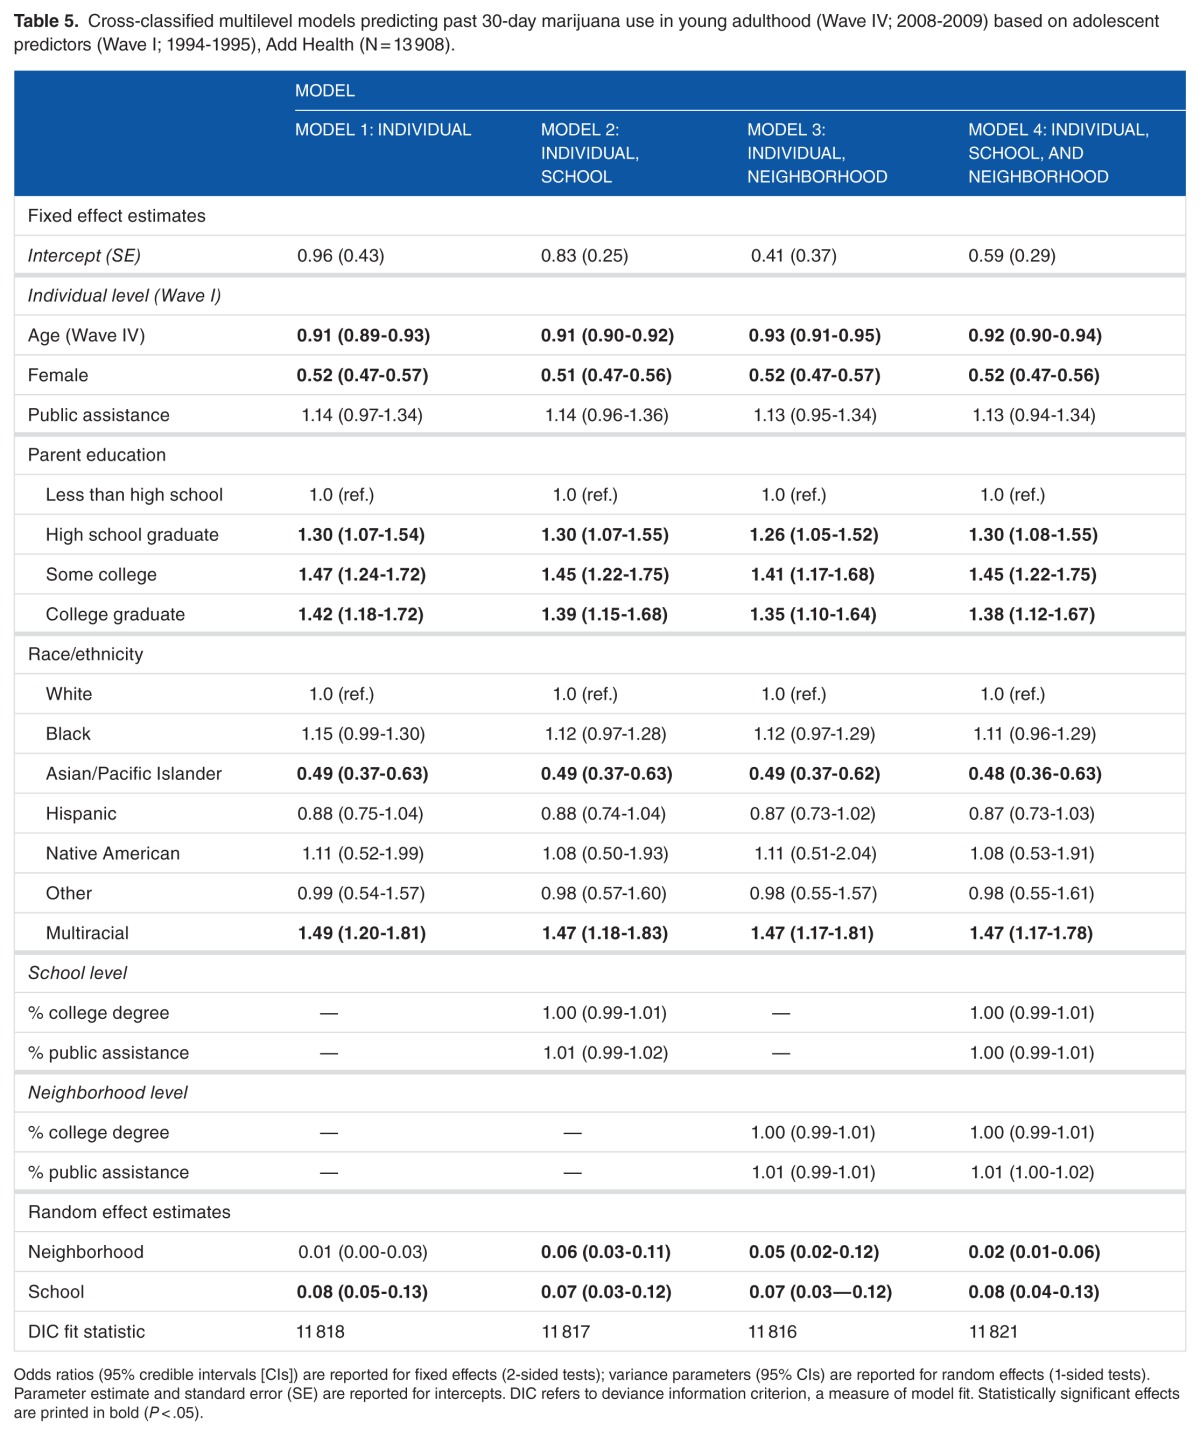
Cross-classified models predicting marijuana use at in young adulthood are presented in Table 5. In Wave IV, male sex was still associated with elevated odds of past 30-day marijuana use, but the effect of age was reversed, with older age being associated with decreased odds of use. Compared with whites, Asian/Pacific Islanders remained less likely to use marijuana, whereas multiracial participants remained more likely to do so. Although parent education was not associated with marijuana use in Wave I, it was statistically significant in young adulthood. Adults whose parents had at least a high school degree had higher odds of marijuana use than those whose parents had not completed high school. By contrast, family receipt of public assistance—which was a significant predictor of use in Wave I—was not predictive of marijuana use by Wave IV.
Table 5.
Cross-classified multilevel models predicting past 30-day marijuana use in young adulthood (Wave IV; 2008–2009) based on adolescent predictors (Wave I; 1994–1995), Add Health (N = 13 908).
Similar to the Wave I models, school-level and neighborhood-level SES were not significant predictors of Wave IV marijuana use. Importantly, the random effect at the school level persisted into Wave IV. The school-level variance parameter for schools was reduced from 0.31 in Wave I to 0.08 in Wave IV (ie, more than 25% of the school-level clustering remain), indicating that young adults’ marijuana use was similar to those with whom they attended school in adolescence. The neighborhood-level variance parameter, which initially in Wave I was 0.04, was attenuated to 0.01 in Wave IV.
Discussion
The purpose of this work was to examine the effects of school and neighborhood context on marijuana use and to estimate whether contextual SES was associated with use. We used cross-classified multilevel models to simultaneously examine the contextual effects of both school and neighborhood on marijuana use cross-sectionally (ie, in adolescence) and longitudinally (ie, in young adulthood). Of the 2 contexts, schools explained more variability than neighborhoods in marijuana use, with school-level variance being approximately 4 times that of the neighborhood. There are substantial and meaningful differences between schools in the “school effect.” In approximately half of schools, attending those schools is associated with a greater impact on student likelihood to use marijuana than public assistance or female sex. This finding reinforces the importance of the school setting in existing prevention programming.31
We also found that school clustering persisted to a significant degree into young adulthood. The ongoing importance of schools may be due to adolescence being a “sensitive period” when lifelong behavioral patterns are established.32,33 Regardless of the underlying mechanism, these findings indicate the potential for school-level or neighborhood-level interventions in adolescence to exert ongoing effects into young adulthood. Examining persistence of school-level and neighborhood-level clustering is still highly novel, with only 1 study we are aware of examining the persistence of school-level clustering (of weight-status outcomes).22
Findings indicate that marijuana use is common among adolescents regardless of SES, and that none of the school-level or neighborhood-level SES indicators were associated with marijuana use. Taken alongside the existing literature on SES and marijuana use, our results underscore the complex relationship between SES and marijuana use. The association between SES (individual and contextual) and marijuana use may be different for behavioral outcomes, such as early pregnancy and cigarette use, for which low SES is a strong marker of risk. In addition, the prevalence of marijuana use may be similar across levels of contextual SES, as it is across levels of individual SES. This limited variability makes it difficult to estimate the association between the 2 variables. A promising approach for future research may be to examine within-group differences in marijuana use among populations with different levels of SES.
Limitations
This study has several limitations that should be noted. The analysis was based on a nationally representative sample of adolescents selected for participation through school-based sampling. Due to the sampling strategy, the number of adolescents per school was much greater than per neighborhood, with a large number of neighborhoods having only 1 individual. This raises the possibility that findings are a reflection of sampling design. However, examinations of other outcomes in Add Health using cross-classified modeling have demonstrated meaningful effects at both school and neighborhood, which suggest that the findings are unlikely an artifact of the sampling strategy.21,34,35 In addition, sensitivity analyses excluding neighborhoods with only 1 respondent and excluding neighborhoods with fewer than 5 respondents yielded similar results to the main analysis. These results indicate that estimates of variance parameters are robust to extremes in neighborhood size.
Another limitation is the age of the data, particularly Wave I data, which were collected in the mid-1990s. We opted to use Add Health because it comprises a large, nationally representative sample of adolescents and has information about their schools and neighborhoods. It is one of very few data sets available to examine our specific research questions. In addition, the fact that the data are from the mid-1990s enables us to establish the effects of adolescent social environments and sociodemographic risk factors on today’s adults—ie, those born when marijuana use was at its highest (late 1970s) and who have witnessed changes in the legal status of marijuana. The longitudinal impacts of contexts and risk factors on a more recent cohort are important, but will not be visible for a number of years.
Conclusions
This study also adds to the current literature by examining the longitudinal impact of school and neighborhood on marijuana use into young adulthood. Results suggest that there are school and neighborhood contributions to the likelihood of marijuana use during adolescence, along with small but persistent contextual effects predicting marijuana use into young adulthood. Future research is need to further elucidate mechanisms through which schools and neighborhoods influence marijuana use as markers of SES in this analysis indicated no relationship with marijuana use. However, this study demonstrates the salience of schools and neighborhoods as predictors of marijuana use, particularly in adolescence, indicating that these contexts may provide unique opportunities for targeted interventions or policy change.
Supplementary Materials
Acknowledgments
This research uses data from Add Health, a program project directed by Kathleen Mullan Harris and designed by J Richard Udry, Peter S Bearman, and Kathleen Mullan Harris at the University of North Carolina at Chapel Hill, and funded by grant P01-HD31921 from the Eunice Kennedy Shriver National Institute of Child Health and Human Development, with cooperative funding from 23 other federal agencies and foundations. Special acknowledgment is due Ronald R Rindfuss and Barbara Entwisle for assistance in the original design. Information on how to obtain the Add Health data files is available on the Add Health Web site (http://www.cpc.unc.edu/addhealth). No direct support was received from grant P01-HD31921 for this analysis.
Footnotes
PEER REVIEW: Five peer reviewers contributed to the peer review report. Reviewers’ reports totaled 1054 words, excluding any confidential comments to the academic editor.
FUNDING: The author(s) disclosed receipt of the following financial support for the research, authorship, and/or publication of this article: This study is supported the National Institutes of Health (K01MH102403, Dunn; K01DA031738, Johnson).
DECLARATION OF CONFLICTING INTERESTS: The author(s) declared no potential conflicts of interest with respect to the research, authorship, and/or publication of this article.
Author Contributions
CEM, ECD, and TKR conceived and designed the study and analysis. CEM analyzed the data and wrote the first draft of the manuscript. CEM, RMJ, ECD, TKR, and CRE contributed to the writing of the manuscript; agree with manuscript results and conclusions; and made critical revisions and approved final version. CEM and RMJ jointly developed the structure and arguments for the paper.
Disclosures and Ethics
As a requirement of publication, author(s) have provided to the publisher signed confirmation of compliance with legal and ethical obligations including but not limited to the following: authorship and contributorship, conflicts of interest, privacy and confidentiality, and (where applicable) protection of human and animal research subjects. The authors have read and confirmed their agreement with the ICMJE authorship and conflict of interest criteria. The authors have also confirmed that this article is unique and not under consideration or published in any other publication, and that they have permission from rights holders to reproduce any copyrighted material. The external blind peer reviewers report no conflicts of interest.
REFERENCES
- 1.Ammerman S, Ryan S, Adelman WP. The impact of marijuana policies on youth: clinical, research, and legal update. Pediatrics. 2015;135:e769–e785. doi: 10.1542/peds.2014-4147. [DOI] [PubMed] [Google Scholar]
- 2.National Conference on State Legislatures. Marijuana deep dive, state policy updates 2016; [Accessed December 12, 2016]. http://www.ncsl.org/bookstore/state-legislatures-magazine/marijuana-deep-dive.aspx. [Google Scholar]
- 3.Anderson DM, Rees DI. The legalization of recreational marijuana: how likely is the worst-case scenario. J Policy Anal Manag. 2014;33:221–232. doi: 10.1002/pam.21727. [DOI] [PubMed] [Google Scholar]
- 4.Kann L, Kinchen S, Shanklin SL, et al. Youth Risk Behavior Surveillance—United States, 2013. MMWR Suppl. 2014;63:1–68. [PubMed] [Google Scholar]
- 5.Johnson RM, Fairman B, Gilreath T, et al. Past 15-year trends in adolescent marijuana use: differences by race/ethnicity and sex. Drug Alcohol Depend. 2015;155:8–15. doi: 10.1016/j.drugalcdep.2015.08.025. [DOI] [PMC free article] [PubMed] [Google Scholar]
- 6.Joffe A. Understanding the full effect of the changing legal status of marijuana on youth: getting it right. JAMA Pediatr. 2017;171:115–116. doi: 10.1001/jamapediatrics.2016.3920. [DOI] [PubMed] [Google Scholar]
- 7.Hasin DS, Wall M, Keyes KM, et al. Medical marijuana laws and adolescent marijuana use in the USA from 1991 to 2014: results from annual, repeated cross-sectional surveys. Lancet Psychiat. 2015;2:601–608. doi: 10.1016/S2215-0366(15)00217-5. [DOI] [PMC free article] [PubMed] [Google Scholar]
- 8.Wall MM, Mauro C, Hasin DS, et al. Prevalence of marijuana use does not differentially increase among youth after states pass medical marijuana laws: commentary on and reanalysis of US National Survey on Drug Use in Households data 2002–2011. Int J Drug Policy. 2016;29:9–13. doi: 10.1016/j.drugpo.2016.01.015. [DOI] [PMC free article] [PubMed] [Google Scholar]
- 9.Hadland SE, Harris SK. Youth marijuana use: state of the science for the practicing clinician. Curr Opin Pediatr. 2014;26:420–427. doi: 10.1097/MOP.0000000000000114. [DOI] [PMC free article] [PubMed] [Google Scholar]
- 10.Holder H, Flay B, Howard J, Boyd G, Voas R, Grossman M. Phases of alcohol problem prevention research. Alcohol Clin Exp Res. 1999;23:183–194. [PubMed] [Google Scholar]
- 11.Shavers VL. Measurement of socioeconomic status in health disparities research. J Natl Med Assoc. 2007;99:1013–1023. [PMC free article] [PubMed] [Google Scholar]
- 12.Lynch J, Kaplan G. Chapter 2: socioeconomic position. In: Berkman LF, Kawachi I, editors. Social Epidemiology. New York: Oxford University Press; 2000. pp. 13–35. [Google Scholar]
- 13.Cheng TL, Goodman E, Committee on Pediatric Research Race, ethnicity, and socioeconomic status in research on child health. Pediatrics. 2015;135:e225–e237. doi: 10.1542/peds.2014-3109. [DOI] [PMC free article] [PubMed] [Google Scholar]
- 14.Bradley RH, Corwyn RF. Socioeconomic status and child development. Annu Rev Psychol. 2002;53:371–399. doi: 10.1146/annurev.psych.53.100901.135233. [DOI] [PubMed] [Google Scholar]
- 15.Hanson MD, Chen E. Socioeconomic status and health behaviors in adolescence: a review of the literature. J Behav Med. 2007;30:263–285. doi: 10.1007/s10865-007-9098-3. [DOI] [PubMed] [Google Scholar]
- 16.Goodman E, Huang B. Socioeconomic status, depressive symptoms, and adolescent substance use. Arch Pediatr Adolesc Med. 2002;156:448–453. doi: 10.1001/archpedi.156.5.448. [DOI] [PubMed] [Google Scholar]
- 17.Miller DS, Miller TQ. A test of socioeconomic status as a predictor of initial marijuana use. Addict Behav. 1997;22:479–489. doi: 10.1016/s0306-4603(96)00059-7. [DOI] [PubMed] [Google Scholar]
- 18.Humensky JL. Are adolescents with high socioeconomic status more likely to engage in alcohol and illicit drug use in early adulthood. Subst Abuse Treat Prev Policy. 2010;5:19. doi: 10.1186/1747-597X-5-19. [DOI] [PMC free article] [PubMed] [Google Scholar]
- 19.Bachman JG, O’Malley PM, Johnston LD, Schulenberg JE. Impacts of Parental Education on Substance Use: differences among White, African-American, and Hispanic Students in 8th, 10th, and 12th Grades 1999–2008. Ann Arbor, MI: Institute for Social Research; 2010. (Monitoring the Future Occasional Paper 70). [Google Scholar]
- 20.Patrick ME, Wightman P, Schoeni RF, Schulenberg JE. Socioeconomic status and substance use among young adults: a comparison across constructs and drugs. J Stud Alcohol Drugs. 2012;73:772–782. doi: 10.15288/jsad.2012.73.772. [DOI] [PMC free article] [PubMed] [Google Scholar]
- 21.Dunn EC, Milliren CE, Evans CR, Subramanian SV, Richmond TK. Disentangling the relative influence of schools and neighborhoods on adolescents’ risk for depressive symptoms. Am J Public Health. 2015;105:732–740. doi: 10.2105/AJPH.2014.302374. [DOI] [PMC free article] [PubMed] [Google Scholar]
- 22.Evans CR, Lippert AM, Subramanian SV. The persistent clustering of adult body mass index by school attended in adolescence. J Epidemiol Community Health. 2016;70:260–263. doi: 10.1136/jech-2015-205833. [DOI] [PubMed] [Google Scholar]
- 23.Harris KM, Halpern CT, Whitsel E, et al. The National Longitudinal Study of Adolescent to Adult Health: research design. [Accessed November 10, 2014]. http://www.cpc.unc.edu/projects/addhealth/design. Published 2009.
- 24.Harris KM. The National Longitudinal Study of Adolescent Health (Add Health), Waves I & II, 1994–1996; Wave III, 2001–2002; Wave IV, 2007–2009 [machine-readable data file and documentation] Chapel Hill, NC: Carolina Population Center, University of North Carolina at Chapel Hill; 2009. [Google Scholar]
- 25.Resnick MD, Bearman PS, Blum RW, et al. Protecting adolescents from harm: findings from the National Longtudinal Study on Adolescent Health. JAMA. 1997;278:823–832. doi: 10.1001/jama.278.10.823. [DOI] [PubMed] [Google Scholar]
- 26.Leckie G. Charlton C runmlwin: a program to run the MLwiN Multilevel Modeling Software from within Stata. J Stat Softw. 2012;52:40. [Google Scholar]
- 27.Rasbash J, Steele F, Browne WJ, Goldstein H. A User’s Guide to MLwiN, Version 2.26. Bristol, UK: Centre for Multilevel Modeling, University of Bristol; 2012. [Google Scholar]
- 28.Browne WJ. MCMC Estimation in MLwiN, Version 2.26. Bristol, UK: Centre for Multilevel Modeling, University of Bristol; 2012. [Google Scholar]
- 29.Rodriguez G, Goldman N. An assessment of estimation procedures for multilevel models with binary responses. J R Stat Soc. 1995;158:73–89. [Google Scholar]
- 30.Rasbash J, Browne WJ. Non-hierarchical multilevel models. In: Leyland AH, Goldstein H, editors. Modeling Non-Hierarchical Structures. New York, NY: John Wiley & Sons; 2001. pp. 93–105. [Google Scholar]
- 31.Fletcher A, Bonell C, Hargreaves J. School effects on young people’s drug use: a systematic review of intervention and observational studies. J Adolesc Health. 2008;42:209–220. doi: 10.1016/j.jadohealth.2007.09.020. [DOI] [PubMed] [Google Scholar]
- 32.Dunn EC, McLaughlin KA, Slopen N, Rosand J, Smoller JW. Developmental timing of child maltreatment and symptoms of depression and suicidal ideation in young adulthood: results from the National Longitudinal Study of Adolescent Health. Depress Anxiety. 2013;30:955–964. doi: 10.1002/da.22102. [DOI] [PMC free article] [PubMed] [Google Scholar]
- 33.Knudsen E. Sensitive periods in the development of the brain and behavior. J Cogn Neurosci. 2004;16:1412–1425. doi: 10.1162/0898929042304796. [DOI] [PubMed] [Google Scholar]
- 34.Dunn EC, Richmond TK, Milliren CE, Subramanian SV. Using cross-classified multilevel models to disentangle school and neighborhood effects: an example focusing on smoking behaviors among adolescents in the United States. Health Place. 2015;31:224–232. doi: 10.1016/j.healthplace.2014.12.001. [DOI] [PMC free article] [PubMed] [Google Scholar]
- 35.Richmond TK, Dunn EC, Milliren CE, Rosenfeld Evans C, Subramanian SV. Disentangling overlapping influences of neighborhoods and schools on adolescent body mass index. Obesity. 2016;24:2570–2577. doi: 10.1002/oby.21672. [DOI] [PMC free article] [PubMed] [Google Scholar]
Associated Data
This section collects any data citations, data availability statements, or supplementary materials included in this article.


