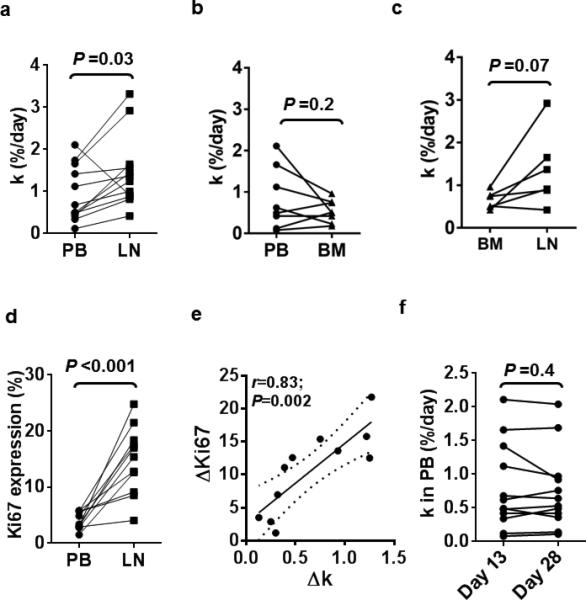
Figure 2. Growth rates of CLL cells are higher in the LN than in PB or BM.

(a-c) The population growth rate k, defined as the % newly born cells added to a population per day is compared between concurrently obtained samples from PB and LN (n=12) (a), PB and BM (n=8) (b) and BM and LN (n=6) (c). (d-e) Expression of the proliferation marker Ki67 is higher in LN than in PB and correlated to growth rate. (d) Ki67 expression measured by flow cytometry in CLL cells obtained on day 13 from PB and LN (n=11). (e) The correlation between the change in Ki67 expression and the population growth rate k in the LN compared to PB is shown (n=11). Solid line represents linear regression fit and dotted lines represent 95% confidence intervals. P-value and r-value were calculated by Pearson's correlation. (f) The population growth rate k estimated from analysis of PB on day 13 and day 28 (n=12). Paired data (samples from the same patient) are connected by a line; statistical comparison by paired Student t test.
