

Abstract
To study Megalobrama amblycephala adaption to water hypoxia, the changes in physiological levels, innate immune responses, redox balance of M.amblycephala during hypoxia were investigated in the present study. When M. amblycephala were exposed to different dissolved oxygen (DO) including control (DO: 5.5 mg/L) and acute hypoxia (DO: 3.5 and 1.0 mg/L, respectively), hemoglobin (Hb), methemoglobin (MetHb), glucose, Na+, succinatedehydrogenase (SDH), lactate, interferon alpha (IFNα), and lysozyme (LYZ), except hepatic glycogen and albumin gradually increased with the decrease of DO level. When M. amblycephala were exposed to different hypoxia time including 0.5 and 6 h (DO: 3.5 mg/L), and then reoxygenation for 24 h after 6 h hypoxia, Hb, MetHb, glucose, lactate, and IFNα, except Na+, SDH, hepatic glycogen, albumin, and LYZ increased with the extension of hypoxia time, while the above investigated indexes (except albumin, IFNα, and LYZ) decreased after reoxygenation. On the other hand, the liver SOD, CAT, hydrogen peroxide (H2O2), and total ROS were all remained at lower levels under hypoxia stress. Finally, Hif-1α protein in the liver, spleen, and gill were increased with the decrease of oxygen concentration and prolongation of hypoxia time. Interestingly, one Hsp70 isoforms mediated by internal ribozyme entry site (IRES) named junior Hsp70 was only detected in liver, spleen and gill. Taken together, these results suggest that hypoxia affects M. amblycephala physiology and reduces liver oxidative stress. Hypoxia-reoxygenation stimulates M. amblycephala immune parameter expressions, while Hsp70 response to hypoxia is tissue-specific.
Keywords: Megalobrama amblycephala, hypoxia, physiological response, immune activity, oxidative stress
Introduction
Oxygen is critical for both terrestrial and aquatic aerobic organisms. Most of the organisms need molecular oxygen to support metabolic processes (Chandel and Schumacker, 2000). Compared with terrestrial environments, aquatic environments exhibit much wider temporal and spatial variations in oxygen concentration, and water contains extremely lower oxygen in the same volume of air at the same atmosphere pressure (Rytkönen et al., 2007). As a result, aquatic organisms are frequently exposed to variations in oxygen levels. In most cases, they will usually respond by escaping to other environments when encountering hypoxia condition. However, if hypoxia is unavoidable, aquatic organisms including fish have to make responses either by increasing oxygen transfer to tissues or reducing oxygen consumption through metabolic depression to survive (Moraes et al., 2002; Douxfils et al., 2012).
The earlier studies of fish under hypoxia stress are focused on tissue changes including blood, heart, gill, and brain. In rainbow trout, hypoxia markedly decreases the oxygen uptake effectiveness in blood (Randall et al., 1967), whereas during progressive hypoxia, the rate of oxygen uptake does not alter (Holeton and Randall, 1967b). During hypoxia the percentage saturation of both arterial and venous blood are decreased, while blood pressure in the dorsal and ventral aortae increases, all these changes are associated with a marked bradycardia in fish after hypoxia stress (Holeton and Randall, 1967a). Bradycardia does not affect fish cardiac output but stroke volume of cardiac enhanced, and vascular resistance to blood flow correspondingly increased (Holeton and Randall, 1967b; Butler and Taylor, 1975). Hypoxia also increases fish Hb-O2 affinity and oxygen capacity, and directly provides higher and more stable effectiveness of oxygen uptake in blood; however the total PO2 is till decreased (Holeton and Randall, 1967b; Wood and Johansen, 1972). During hypoxia, the ATP concentration and ATP:Hb ratio in the red cells decreased (Wood et al., 1975), further demonstrate that the erythrocytic ATP:Hb4 molar ratios declined with increasing hypoxic stress as did the pH gradient between the erythrocyte and plasma (Boutilier et al., 1988). Hypoxia leads to the fish bradycardia, while the cardiac output is regulated by changes in the stroke volume not heart rate (Hemmingsen et al., 1972). Long period of hypoxia has no effect on fish heart functions but leads to the decrease of myocardial glycogen concentration and the occurrence of mitochondrial necrosis (Leknes, 1985; Lennard and Huddart, 1992). Primarily, fish moves higher in the water column, increases gill ventilation and exhibits aquatic surface respiration during aquatic hypoxia (Urbina et al., 2011). Gills display protruding lamellae after 1 day of hypoxia and reach its greatest extent after 7 days, and the changes are completely reversible after 7 days reoxygenation (Sollid et al., 2003). The capillary diameter of fish brain increases after hypoxia, and 90 min hypoxia leads to the disappearance of brain pyruvate kinase (Scheich et al., 1972; Lushchak, 1993). Brain sensitivity to hypoxia in fish is reflected by changes in extracellular K+ activity, and in the hypoxia-tolerant fish crucian carp the Na+/K+-ATPase level in hypoxia crucian carp brain is maintained (Hylland et al., 1997).
The recent studies show that some hematological parameters including red and white blood cell count, hematocrit and hemoglobin concentrations are significantly increased after hypoxia treatment in fish (Petersen and Gamperl, 2011; Richards, 2011; Ni et al., 2014). Meanwhile, the biochemical parameters, such as blood glucose, lactate, corticosteroids, ATP, and GTP are also altered under hypoxia (Rees et al., 2009; Omlin and Weber, 2010; Urbina and Glover, 2012; Ni et al., 2014). During hypoxia, metabolic activity decreases and most of the energy will be used for the maintenance of primary physiological functions, probably leading to the changes of the immune defense. It is reported that in Eurasian perch and Catla, the lysozyme activity is significantly decreased under hypoxia conditions (Douxfils et al., 2012; Singh et al., 2016).
During the aerobic metabolism, the negative tetravalent atom of O2 produces water at the end of the mitochondrial electron transport chain, while negative monovalent atom of O2 generates several reactive oxygen species (ROS) such as superoxide anions (), hydroxyl anions (OH−•), and hydrogen peroxide (H2O2) (Turrens, 2003). These ROS have damage effect on organisms including induction of oxidation of proteins, DNA and steroid components, and peroxidation of unsaturated lipids in cell membranes (Chance et al., 1979; Southorn and Powis, 1988). To minimize the detrimental influence of ROS, aerobic organisms have evolved enzymatic antioxidant mechanism accompanying the formation of antioxidant defenses such as superoxide dismutases (SOD), catalases (CAT), and glutathione (GSH), to scavenge the superoxide radicals and hydrogen peroxide for maintaining the homeostasis (Scandalios, 2005; Kobayashi and Yamamoto, 2006). SOD catalyzes the dismutation of to H2O2, and CAT and glutathione peroxidases (GSH-Px) reduce H2O2 to H2O (Scandalios, 2005). When the ROS generation exceeds their removal, oxidative stress occurs. It has been reported that hyperoxia or even hypoxia alters cellular ROS levels in fish (Ross et al., 2001; Cooper et al., 2002; Garcia Sampaio et al., 2008). In some fish species, hypoxia alone causes elevation of the activities of enzymes involved in antioxidant defense (Lushchak et al., 2001, 2005; Lushchak and Bagnyukova, 2007), while in other fish species the antioxidant enzyme activities are decreased or/and unchanged in hypoxia stress (Leveelahti et al., 2014; Huang et al., 2015; Ransberry et al., 2016). Moreover, ROS-detoxifying enzyme activities rather than direct reactive intermediate levels are investigated in most experiments to indicate the altered status of ROS in hypoxia.
Megalobrama amblycephala (Wuchang bream) as an important freshwater fish has been cultured for half a century, whereas intensive aquaculture has brought lots of problems, such as crowding and hypoxia. More seriously, the absence of oxygen in water usually causes the large-scale suffocation death of M. amblycephala, thus resulting in great economic losses. In the present study, M. amblycephala were treated by different dissolved oxygen (DO) concentration and hypoxia time to systematically study their responses to hypoxia in physiological and immune levels by evaluating blood parameters. In addition, oxidative stress status in hypoxia was studied by analyzing ROS and related antioxidant enzymes in liver. Finally, the distributions of the stress response proteins in different tissues were also investigated.
Materials and methods
Experimental fish
Juvenile M. amblycephala (mean weight 50 ± 10 g) were obtained from Tuanfeng breeding base in Hubei province, China. The fish were acclimated for 2 weeks with daily diet under a 14/10 h day/night photoperiod cycle at 25°C in one 500 L tank with circulating water system.
Hypoxia stress
The DO concentration was maintained by flowing the nitrogen gas into the 100 L hermetic tank by a self-designed automatic hypoxia control machine. The DO concentration was set based on the previous studies (Wang et al., 2015). Fish were randomly divided into DO level groups (n = 5 for each group): the control (CTRL-5.5, DO: 5.5 ± 0.2 mg/L), acute hypoxia 1 group (aH1-3.5, DO: 3.5 ± 0.2 mg/L for 0.5 h), and acute hypoxia 2 group (aH2-1.0, DO: 1.0 ± 0.2 mg/L for 0.5 h); hypoxia time groups: comparable-acute hypoxia group (cH-0.5h, DO: 3.5 ± 0.2 mg/L for 0.5h), comparable-acute hypoxia 1 group (cH1-6h, DO: 3.5 ± 0.2 mg/L for 6 h), and reoxygenation group (rH-24h, DO: 3.5 mg/L for 6 h and then recovered to DO: 5.5 mg/L for 24 h). The aH1-3.5 (from DO level groups) and cH-0.5h (from hypoxia time groups) were treated with same hypoxia conditions and the samples were shared. Fish were immediately anesthetized with MS-222 (150 mg/L), and sampled at the end of each experimental period when fish gill ventilation ceased. Fish were not fed during the experiment.
All investigations were conducted in accordance with the ethical standards and according to the national and international guidelines, and this study has been approved by the Institutional Animal Care and Use Committee (IACUC) of Huazhong Agricultural University, Wuhan, China.
Blood and tissue sampling
Blood samples were taken gently from the caudal vein by 1 mL plastic syringe without heparin sodium. These samples were incubated at 37°C for 2 h and clotted at 4°C, then centrifuged at 4,000 g for 10 min to obtain the serum.
Tissues including liver, spleen, brain, gill and kidney were excised and subsequently frozen in liquid nitrogen. The frozen samples were then thawed and homogenized individually using TissueLyser ∏ (Qiagen, Germany) at the frequency of 30 Hz for 5 min in ice-cold RIPA lysis buffer at a ratio of 1:10 (Cowin Biotech, China). The homogenates were further centrifuged at 12,000 g for 10 min at 4°C, and the supernatant was used for western blot analysis. Liver was also homogenized in 0.65% (m/V) brine at a ratio of 1:10, and after centrifugation, the supernatant was used for enzyme activity assays. All the protein concentrations were determined by bicinchoninic acid (BCA) protein determination kit (Dingguo, China) according to the instructions.
Hematological and biochemical assays
Hemoglobin (Hb) concentration was determined with Drabkin's reagent as an absorbance at 540 nm. MetHb was computed from Hb by double-wavelength spectrophotometry method (Sakata et al., 1982). Biochemical parameters including Na+, glucose, lactate, and hepatic glycogen were determined by commercial kits according to chromogenic ionophore-based method (Kumar et al., 1988), glucose oxidase/peroxidase method (Trinder, 1969), p-phenilphenol method (Harrower and Brown, 1972), and modified glycogen method (Bidinotto et al., 1997), respectively.
ROS and antioxidant defense assays in liver
An oxidant-sensing fluorescent probe 2′,7′-dichlorodihydrofluorescein diacetate (DCFH-DA) was used to determine the total status of ROS as previously described (Li et al., 1999; Cash et al., 2007). Other two reactive intermediates, H2O2 and nitric oxide (NO) were determined by phenol red (Pick and Mizel, 1981) and hemoglobin methods (Murphy and Noack, 1994), respectively. The SOD activity was measured based on the ability of the enzyme to inhibit the reduction of nitro blue tetrazolium (NBT) by superoxide radicals (Crouch et al., 1981). The CAT activity was measured using the catalase assay kit (Jiancheng, China).
Immune parameter detection
Serum albumin was evaluated following the bromcresol green (BCG) method (Barber and Stanhope, 1992). Serum interferon alpha (IFNα) protein level was studied with the ELISA kit (Jiancheng, China). Serum lysozyme (LYZ) activity in mixing serum sample (20 μL) with 200 μL Micrococcus luteus solution was measured for transmittance at 530 nm after 15 min incubation at 37°C, and assessed by comparing transmittance values with reference standards.
Western blot analysis
Total proteins from M. amblycephala liver, spleen, brain, gill, and kidney (n = 5 for each group) were quantified and separated on 8% SDS-PAGE, then transferred to nitrocellulose membranes. The membranes were incubated for 2 h with polyclonal antibodies, Hif-1α (1:500) and Hsp70 (1:200) (Boster, China), respectively, and then anti-rabbit IRDye 800CW-labeled secondary antibody (1:10,000) at room temperature for 1 h, and observed using Odyssey Fc machine (Licor Biosciences, USA). Gray values of every band were further calibrated and measured by ImageJ 1.46r (NIH, USA).
Statistics
Statistical analysis was performed using SPSS 16.0 software. Data from each groups were, respectively, analyzed by the one-way ANOVA test followed by the Duncan's new multiple range tests. Data were represented as mean ± S.D. and p < 0.05 was considered statistically significant.
Results
Hypoxia significantly increased hematological and biochemical parameters
Compared with the control, the Hb and MetHb concentrations increased with the decrease of oxygen concentration and the prolongation of hypoxia time, however, after 24 h reoxygenation, their concentrations returned to the normal levels (Figure 1A). Glucose contents increased in an oxygen concentration-, but not hypoxia time- dependent manner, and recovered to the normal levels after reoxygenation (Figure 1A).
Figure 1.
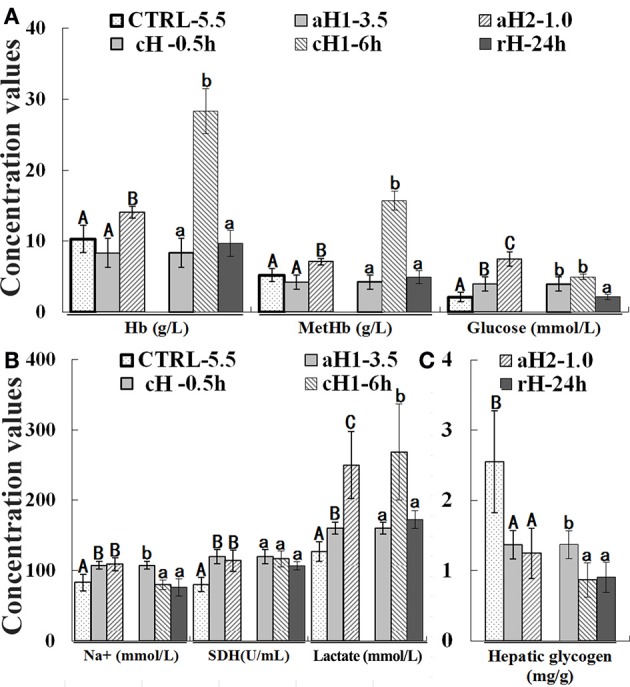
Effect of hypoxia upon hemoglobin (Hb), methemoglobin (MetHb), and glucose (A), Na+, succinatedehydrogenase (SDH) and lactate (B), and hepatic glycogen (C) concentrations in Megalobrama amblycephala. CTRL-5.5, the control; aH1-3.5 and aH2-1.0, acute hypoxia at 1.0 and 3.5 mg/L of DO last for 0.5 h, respectively; cH-0.5h and cH1-6h, comparable-acute hypoxia (DO: 3.5 mg/L) last for 0.5 and 6 h, respectively; rH-24h, hypoxia (DO: 3.5 mg/L) last for 6 h and then recover to DO: 5.5 mg/L for 24 h. Three different DO level groups are individually analyzed and indicated with capital letters, while three hypoxia time condition groups are also separately analyzed and showed with lowercase letters. Different letters above bars represent significant difference (p < 0.05), and the same letters above bars indicate no significant difference. Values are mean ± S.D.; N = 5 for every groups.
Na+ concentration gradually increased with the decrease of DO concentration, whereas it decreased with the prolongation of hypoxia time, and recovered to the normal levels after reoxygenation (Figure 1B). SDH activity showed the same tendency with Na+ during hypoxia treatment. Additionally, with the decrease of DO and prolongation of hypoxia time, lactate concentration increased and reached the maximum (268.43 mmol/L) at moderate hypoxia (DO: 3.5 mg/L) treatment for 6 h (Figure 1B). On the other hand, the hepatic glycogen concentration was continuously decreased during hypoxia and reoxygenation (Figure 1C).
Hypoxia stimulated M. amblycephala immune activity
The albumin concentration declined in hypoxia, but returned to the normal level after reoxygenation. Conversely, the IFNα content showed an increase tendency with the decrease of DO concentration and prolongation of hypoxia time. The LYZ level significantly increased after hypoxia treatment. It should be emphasized that the albumin, IFNα, and LYZ concentrations were stayed at higher levels after hypoxia-reoxygenation compared to the control (~2.1- and 1.8-fold increase for IFNα and LYZ, respectively; Figure 2).
Figure 2.

Serum albumin, interferon alpha (IFNα) and lysozyme (LYZ) levels in M. amblycephala after hypoxia treatment. Three different DO level groups are individually analyzed and indicated with capital letters, while three hypoxia time condition groups are also separately analyzed and showed with lowercase letters. Different letters above bars represent significant difference (p < 0.05), and the same letters above bars indicate no significant difference. Values are mean ± S.D.; N = 5 for every groups.
Hypoxia generally decreased antioxidant enzyme activities and ROS production
The activities of antioxidant enzymes, SOD, and CAT were detected in the liver, and the results indicated that both SOD and CAT activities were declined with the decrease of DO concentration and reached the minimum level (16.73 and 15.46 U/mg, respectively) under severe acute hypoxia (DO: 1.0 mg/L) condition (Figure 3A). Interestingly, the concentration of H2O2, the CAT substrate, also showed the similar change tendency with the SOD and CAT activities. After hypoxia-reoxygenation, SOD and CAT activities increased and were comparable to the control (T-test: p-values for SOD and CAT are 0.272 and 0.052, respectively). The NO content increased with the decrease of DO and prolongation of hypoxia time (Figure 3B). The total ROS concentration fluctuated under hypoxia, which decreased at 0.5 h hypoxia (DO: 3.5 mg/L) treatment, but significantly increased when DO was continually dropped to 1.0 mg/L (Figure 3C). As shown in Figure 3, these detected reactive species H2O2 and ROS were all retained a lower level in hypoxia but a higher level in normoxia or reoxygenation.
Figure 3.
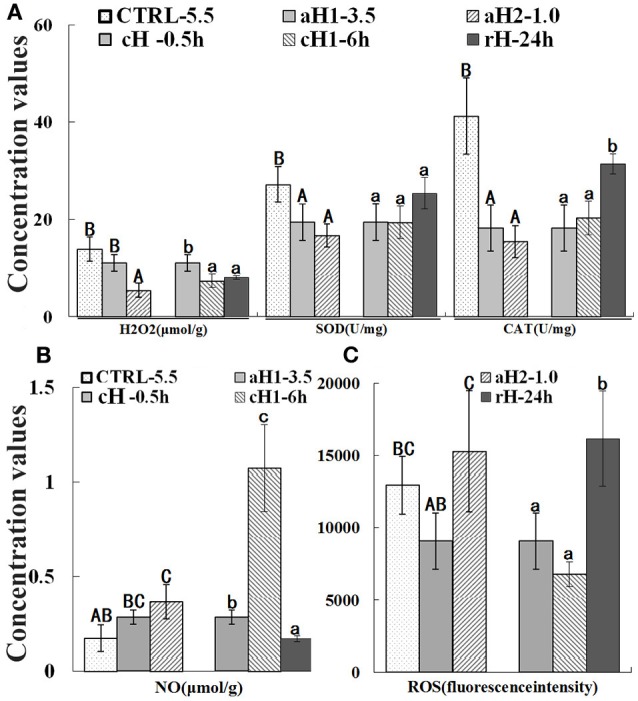
Hydrogen peroxide (H2O2) concentration, superoxide dismutase (SOD), and catalases (CAT) activity (A), nitric oxide (NO) concentration (B), and total reactive oxygen species (ROS) (C) in M. amblycephala liver after hypoxia treatment. Three different DO level groups are individually analyzed and indicated with capital letters, while three hypoxia time condition groups are also separately analyzed and showed with lowercase letters. Different letters above bars represent significant difference (p < 0.05), and the same letters above bars indicate no significant difference. Values are mean ± S.D.; N = 5 for every groups.
Hypoxia response in M. amblycephala was tissue-specific
The key hypoxia response factor, Hif-1α protein was induced by hypoxia in liver, spleen, brain, gill and kidney (Figure 4). Hif-1α levels were gradually increased in oxygen concentration- and hypoxia time-dependent manner in liver, spleen, and gill, while in brain and kidney, Hif-1α was firstly increased and then decreased. Meanwhile, the more accumulation of Hif-1α protein was observed with the prolongation of hypoxia time in liver, spleen, brain, and especially in gill. However, after 24 h hypoxia-reoxygenation, Hif-1α was decreased (Figure 4).
Figure 4.

Western blot analysis of Hif-1α and Hsp70 proteins in different tissues after hypoxia treatment in M. amblycephala. CTRL-5.5, the control; aH1-3.5 and aH2-1.0, acute hypoxia at 1.0 and 3.5 mg/L of DO last for 0.5 h, respectively; cH-0.5h and cH1-6h, comparable-acute hypoxia (DO: 3.5 mg/L) last for 0.5 and 6 h, respectively; rH-24h, hypoxia (DO: 3.5 mg/L) last for 6 h and then recover to DO: 5.5 mg/L for 24 h. The lower band in liver, spleen and gill is the junior Hsp70 protein generated by IRES-mediated translation. The left sides are western blot result, while the right sides are corresponding ratio of gray values of Hif-1α and Hsp70 proteins.
The two Hsp70 isoforms including the junior one generated by IRES were detected in liver, spleen, brain, gill, and kidney of M. amblycephala. The two isoforms in liver had similar expression tendency which remained at higher levels during hypoxia treatment and decreased after hypoxia-reoxygenation. In spleen and gill, the senior Hsp70 had higher levels in normoxia or hypoxia-reoxygenation, while the junior one increased after hypoxia treatment. In brain and kidney, the junior Hsp70 was undetectable, but the senior one responded to hypoxia in oxygen concentration- and time-dependent manner (Figure 4).
Discussion
In order to provide insight into mechanisms of the hypoxia adaptation in physiology, immune response and oxidative stress in M. amblycephala, some well-known hypoxia indicators, Hb, MetHb, glucose, lactate, glucose, and hepatic glycogen concentrations were investigated after hypoxia stress, and showed the consistency with the previous studies, for instance, Hb and MetHb, functioning in oxygen transport and utilization are induced when the pressure of oxygen decreases in blood (Grek et al., 2011). Our results show that Hb and MetHb are more significantly induced at 6 h for moderate hypoxia treatment, suggesting that Hb and MetHb may be more sensitive to hypoxia time rather than oxygen levels in fish. Na+ influx in fish erythrocytes can indicate the activation of Na+/H+ exchanger and the increase of the pH value, inducing a decrease of hemoglobin affinity to oxygen in fish erythrocytes, as a result the oxygen is delivered into tissues (Nikinmaa, 1992; Reid and Perry, 1994; Nielsen, 1997). In this study, Na+ stayed at high levels with the decrease of DO, but decreased at 6 h for hypoxia, indicating that Na+ probably flows into M. amblycephala erythrocytes (Figure 1). SDH is involved in both the citric acid cycle and respiratory electron transfer chain (Rutter et al., 2010), and its activity under hypoxia stress was obviously increased in M. amblycephala.
During the hypoxia treatment, glucose increased while the hepatic glycogen content decreased, which has also been reported in fish and other species (Routley et al., 2002; Douxfils et al., 2012; Polak et al., 2013). It is suspected that hepatic glycogen is the primary source of glucose, when animals are subjected to acute hypoxia, glycogenolysis is enhanced and hepatic glucose is released to blood to provide sufficient blood glucose and energy (through anaerobic glycolysis), thus ensure adequate basal metabolism for organism survival (Chen et al., 2007). Therefore, glucose homeostasis during the hypoxia treatment depends primarily on hepatic glucose output (Wahren and Ekberg, 2007).
It is well-known that the ROS increase naturally stimulates the activities of antioxidant enzymes, SOD, CAT, GSH-Px, GST, etc. to remove ROS (Niki, 2010). However, the increase of antioxidant enzyme activities does not mean the ROS generation, or vice versa, especially under combined-factor conditions. Additionally, the antioxidant enzyme levels could only reflect the antioxidant capacity rather than the status of oxidative stress. Thus, the levels of the reactive intermediates, H2O2 and ROS are analyzed and the results showed that hypoxia decline H2O2 and ROS levels integrally. However, ROS reaches the peak after severe acute hypoxia (DO: 1.0 ± 0.2 mg/L) treatment for 0.5 h, suggesting that anaerobic metabolism has probably taken the place of aerobic metabolism during this DO point since M. amblycephala suffocation point ranges from 0.64 to 0.35 mg/L (Chen et al., 2012). Meanwhile, the lactate level representing anaerobic metabolism also reached the peak, indicating the anaerobic metabolism is occurred (Segura et al., 1996). The activities of the antioxidant enzymes (SOD, CAT), and the H2O2 and ROS contents retained at lower levels under hypoxia conditions, which are consistent with some published studies in fish, but contrary with others (Table S1). After careful and scrupulous analysis and comparison, we suggest that the biomarkers of oxidative stress caused by hypoxia and especially co-hypoxia factors probably be primarily focused on ROS itself. Moreover, moderate hypoxia treatment may positively affect M. amblycephala by driving liver into lower oxidative stress status. It is reported that chronic hypoxia leads to a marked improvement in mouse survival, body weight, body temperature, behavior, and enhancement against mitochondrial toxicity (Jain et al., 2016).
It has been known that some eukaryotic mRNAs can be translated via internal initiation by specific mRNA regions termed internal ribosome entry site (IRES) (Holcik et al., 1999; Cornelis et al., 2000). Remarkably, many IRES-containing mRNAs encode proteins that have important roles in development, differentiation, cell cycle progression, cell growth, cell apoptosis, and stress response (Holcik et al., 1999; Henis-Korenblit et al., 2000; Stoneley et al., 2000; Prats and Prats, 2002). The presence of IRES elements allows crucial survival factors to be transiently translated under stress conditions that require immediate changes in protein levels (Hellen and Sarnow, 2001; Holcik and Sonenberg, 2005; Komar and Hatzoglou, 2005). The IRES on 5′-UTR of Hsp70 has been studied to drive cap-independent Hsp70 protein translation in apoptosis, hypertonic and thermal stress (Rubtsova et al., 2003; Hernández et al., 2004; Rocchi et al., 2013; Chen et al., 2014). Our results firstly indicate that Hsp70 could respond to hypoxia stress through IRES-mediated manner, moreover, the Hif-1α and junior Hsp70 expressions in limited tissues indicate that hypoxia stress induce tissue-specific response.
Taken together, we have performed hypoxia/reoxygenation treatment in M. amblycephala and systematically studied their responses to hypoxia in aspect of physiology, oxidative stress, and immune. The results demonstrate that hypoxia significantly induces M. amblycephala hematological and biochemical parameters, and moderate hypoxia drives the liver into a lower oxidative stress status to protect fish from oxidative damage. Furthermore, we have firstly observed that hypoxia-reoxygenation treatment stimulates M. amblycephala innate immune activity.
Author contributions
NC and HLW conceived and designed the experiments. MW, HJW, CXH, XW, YH, BZ, and CHH carried out the experiments and analyzed the data. NC, WW, HL, and HLW supervised the project. NC wrote the manuscript and all authors reviewed the manuscript.
Conflict of interest statement
The authors declare that the research was conducted in the absence of any commercial or financial relationships that could be construed as a potential conflict of interest.
Acknowledgments
This work was supported by the Fundamental Research Funds for the Central Universities (2662015PY205 and 2016PY030), and Modern Agroindustry Technology Research System entitled “Staple Freshwater Fishery Industry Technology System” (No. CARS-46-05).
Supplementary material
The Supplementary Material for this article can be found online at: http://journal.frontiersin.org/article/10.3389/fphys.2017.00375/full#supplementary-material
References
- Barber B. J., Stanhope V. L. (1992). Bromcresol green assay is nonspecific for rat plasma albumin. Am. J. Physiol. 262, 299–302. [DOI] [PubMed] [Google Scholar]
- Bidinotto P. M., Moraes G., Souza R. H. S. (1997). Hepatic glycogen and glucose in eight tropical fresh water teleost fish: a procedure for field determinations of micro samples. Bol. Tec. CEPTA 10, 53–60. [Google Scholar]
- Boutilier R. G., Dobson G., Hoeger U., Randall D. J. (1988). Acute exposure to graded levels of hypoxia in rainbow trout (Salmo gairdneri): metabolic and respiratory adaptations. Respir. Physiol. 71, 69–82. 10.1016/0034-5687(88)90116-8 [DOI] [PubMed] [Google Scholar]
- Butler P. J., Taylor E. W. (1975). The effect of progressive hypoxia on respiration in the dogfish (Scyliorhinus canicula) at different seasonal temperatures. J. Exp. Biol. 63, 117–130. [DOI] [PubMed] [Google Scholar]
- Cash T. P., Pan Y., Simon M. C. (2007). Reactive oxygen species and cellular oxygen sensing. Free Radic. Biol. Med. 43, 1219–1225. 10.1016/j.freeradbiomed.2007.07.001 [DOI] [PMC free article] [PubMed] [Google Scholar]
- Chance B., Sies H., Boveris A. (1979). Hydroperoxide metabolism in mammalian organs. Physiol. Rev. 59, 527–605. [DOI] [PubMed] [Google Scholar]
- Chandel N. S., Schumacker P. T. (2000). Cellular oxygen sensing by mitochondria: old questions, new insight. J. Appl. Physiol. 88, 1880–1889. Available online at: http://jap.physiology.org/content/88/5/1880 [DOI] [PubMed] [Google Scholar]
- Chen N., Chen L. P., Zhang J., Chen C., Wei X. L., Gul Y., et al. (2012). Molecular characterization and expression analysis of three hypoxia-inducible factor alpha subunits, HIF-1α/2α/3α of the hypoxia-sensitive freshwater species, Chinese sucker. Gene 498, 81–90. 10.1016/j.gene.2011.12.058 [DOI] [PubMed] [Google Scholar]
- Chen N., Wan X. L., Huang C. X., Wang W. M., Liu H., Wang H. L. (2014). Study on the immune response to recombinant Hsp70 protein from Megalobrama amblycephala. Immunobiology 219, 850–858. 10.1016/j.imbio.2014.07.012 [DOI] [PubMed] [Google Scholar]
- Chen X. Q., Dong J., Niu C. Y., Fan J. M., Du J. Z. (2007). Effects of hypoxia on glucose, insulin, glucagon, and modulation by corticotropin-releasing factor receptor type 1 in the rat. Endocrinology 148, 3271–3278. 10.1210/en.2006-1224 [DOI] [PubMed] [Google Scholar]
- Cooper R. U., Clough L. M., Farwell M. A., West T. L. (2002). Hypoxia-induced metabolic and antioxidant enzymatic activities in the estuarine fish Leiostomus xanthurus. J. Exp. Mar. Biol. Ecol. 279, 1–20. 10.1016/S0022-0981(02)00329-5 [DOI] [Google Scholar]
- Cornelis S., Bruynooghe Y., Denecker G., Van Huffel S., Tinton S., Beyaert R. (2000). Identification and characterization of a novel cell cycle-regulated internal ribosome entry site. Mol. Cell 5, 597–605. 10.1016/S1097-2765(00)80239-7 [DOI] [PubMed] [Google Scholar]
- Crouch R. K., Gandy S. E., Kimsey G., Galbraith R. A., Galbraith G. M., Buse M. G. (1981). The inhibition of islet superoxide dismutase by diabetogenic drugs. Diabetes 30, 235–241. 10.2337/diab.30.3.235 [DOI] [PubMed] [Google Scholar]
- Douxfils J., Deprez M., Mandiki S. N., Milla S., Henrotte E., Mathieu C., et al. (2012). Physiological and proteomic responses to single and repeated hypoxia in juvenile Eurasian perch under domestication–clues to physiological acclimation and humoral immune modulations. Fish Shellfish Immunol. 33, 1112–1122. 10.1016/j.fsi.2012.08.013 [DOI] [PubMed] [Google Scholar]
- Garcia Sampaio F., de Lima Boijink C., Tie Oba E., Romagueira Bichara dos Santos L., Lúcia Kalinin A., Tadeu Rantin F. (2008). Antioxidant defenses and biochemical changes in pacu (Piaractus mesopotamicus) in response to single and combined copper and hypoxia exposure. Comp. Biochem. Physiol. C Toxicol. Pharrmacol. 147, 43–51. 10.1016/j.cbpc.2007.07.009 [DOI] [PubMed] [Google Scholar]
- Grek C. L., Newton D. A., Spyropoulos D. D., Baatz J. E. (2011). Hypoxia up-regulates expression of hemoglobin in alveolar epithelial cells. Am. J. Respir. Cell Mol. Biol. 44, 439–447. 10.1165/rcmb.2009-0307OC [DOI] [PMC free article] [PubMed] [Google Scholar]
- Harrower J. R., Brown C. H. (1972). Blood lactic acid–a micromethod adapted to field collection of microliter samples. J. Appl. Physiol. 32, 709–711. [DOI] [PubMed] [Google Scholar]
- Hellen C. U., Sarnow P. (2001). Internal ribosome entry sites in eukaryotic mRNA molecules. Genes Dev. 15, 1593–1612. 10.1101/gad.891101 [DOI] [PubMed] [Google Scholar]
- Hemmingsen E. A., Douglas E. L., Johansen K., Millard R. W. (1972). Aortic blood flow and cardiac output in the hemoglobin-free fish Chaenocephalus aceratus. Comp. Biochem. Physiol. A Comp. Physiol. 43, 1045–1051. 10.1016/0300-9629(72)90176-4 [DOI] [PubMed] [Google Scholar]
- Henis-Korenblit S., Strumpf N. L., Goldstaub D., Kimchi A. (2000). A novel form of DAP5 protein accumulates in apoptotic cells as a result of caspase cleavage and internal ribosome entry site-mediated translation. Mol. Cell Biol. 20, 496–506. 10.1128/MCB.20.2.496-506.2000 [DOI] [PMC free article] [PubMed] [Google Scholar]
- Hernández G., Vázquez-Pianzola P., Sierra J. M., Rivera-Pomar R. (2004). Internal ribosome entry site drives cap-independent translation of reaper and heat shock protein 70 mRNAs in Drosophila embryos. RNA 10, 1783–1797. 10.1261/rna.7154104 [DOI] [PMC free article] [PubMed] [Google Scholar]
- Holcik M., Lefebvre C., Yeh C., Chow T., Korneluk R. G. (1999). A new internal-ribosome-entry-site motif potentiates XIAP-mediated cytoprotection. Nat. Cell Biol. 1, 190–192. 10.1038/11109 [DOI] [PubMed] [Google Scholar]
- Holcik M., Sonenberg N. (2005). Translational control in stress and apoptosis. Nat. Rev. Mol. Cell Biol. 6, 318–327. 10.1038/nrm1618 [DOI] [PubMed] [Google Scholar]
- Holeton G. F., Randall D. J. (1967a). Changes in blood pressure in the rainbow trout during hypoxia. J. Exp. Biol. 46, 297–305. [DOI] [PubMed] [Google Scholar]
- Holeton G. F., Randall D. J. (1967b). The effect of hypoxia upon the partial pressure of gases in the blood and water afferent and efferent to the gills of rainbow trout. J. Exp. Biol. 46, 317–327. [DOI] [PubMed] [Google Scholar]
- Huang C. Y., Lin H. C., Lin C. H. (2015). Effects of hypoxia on ionic regulation, glycogen utilization and antioxidative ability in the gills and liver of the aquatic air-breathing fish Trichogaster microlepis. Comp. Biochem. Physiol. A Mol. Integr. Physiol. 179, 25–34. 10.1016/j.cbpa.2014.09.001 [DOI] [PubMed] [Google Scholar]
- Hylland P., Milton S., Pek M., Nilsson G. E., Lutz P. L. (1997). Brain Na+/K+-ATPase activity in two anoxia tolerant vertebrates: crucian carp and freshwater turtle. Neurosci. Lett. 235, 89–92. 10.1016/S0304-3940(97)00727-1 [DOI] [PubMed] [Google Scholar]
- Jain I. H., Zazzeron L., Goli R., Alexa K., Schatzman-Bone S., Dhillon H., et al. (2016). Hypoxia as a therapy for mitochondrial disease. Science 352, 54–61. 10.1126/science.aad9642 [DOI] [PMC free article] [PubMed] [Google Scholar]
- Kobayashi M., Yamamoto M. (2006). Nrf2-Keap1 regulation of cellular defense mechanisms against electrophiles and reactive oxygen species. Adv. Enzyme Regul. 46, 113–140. 10.1016/j.advenzreg.2006.01.007 [DOI] [PubMed] [Google Scholar]
- Komar A. A., Hatzoglou M. (2005). Internal ribosome entry sites in cellular mRNAs: mystery of their existence. J. Biol. Chem. 280, 23425–23428. 10.1074/jbc.R400041200 [DOI] [PubMed] [Google Scholar]
- Kumar A., Chapoteau E., Czech B. P., Gebauer C. R., Chimenti M. Z., Raimondo O. (1988). Chromogenic ionophore-based methods for spectrophotometric assay of sodium and potassium in serum and plasma. Clin. Chem. 34, 1709–1712. [PubMed] [Google Scholar]
- Leknes I. L. (1985). Ultrastructural and ultrahistochemical studies of post-mortem changes and effects of hypoxia in the bony fish heart. J. Submicrosc. Cytol. 17, 223–228. [PubMed] [Google Scholar]
- Lennard R., Huddart H. (1992). The effects of hypoxic stress on the fine structure of the flounder heart (Platichthys flesus). Comp. Biochem. Physiol. Comp. Physiol. 101, 723–732. 10.1016/0300-9629(92)90350-Y [DOI] [PubMed] [Google Scholar]
- Leveelahti L., Rytkönen K. T., Renshaw G. M., Nikinmaa M. (2014). Revisiting redox-active antioxidant defenses in response to hypoxic challenge in both hypoxia-tolerant and hypoxia-sensitive fish species. Fish Physiol. Biochem. 40, 183–191. 10.1007/s10695-013-9835-1 [DOI] [PubMed] [Google Scholar]
- Li Y., Zhu H., Trush M. A. (1999). Detection of mitochondria-derived reactive oxygen species production by the chemilumigenic probes lucigenin and luminol. Biochim. Biophys. Acta 1428, 1–12. 10.1016/S0304-4165(99)00040-9 [DOI] [PubMed] [Google Scholar]
- Lushchak V. I. (1993). Free and bound pyruvate kinase from fish brain: properties and redistribution after hypoxia. Biochem. Mol. Biol. Int. 29, 1103–1109. [PubMed] [Google Scholar]
- Lushchak V. I., Bagnyukova T. V. (2007). Hypoxia induces oxidative stress in tissues of a goby, the rotan Perccottus glenii. Comp. Biochem. Physiol. B Biochem. Mol. Biol. 148, 390–397. 10.1016/j.cbpb.2007.07.007 [DOI] [PubMed] [Google Scholar]
- Lushchak V. I., Bagnyukova T. V., Lushchak O. V., Storey J. M., Storey K. B. (2005). Hypoxia and recovery perturb free radical processes and antioxidant potential in common carp (Cyprinus carpio) tissues. Int. J. Biochem. Cell Biol. 37, 1319–1330. 10.1016/j.biocel.2005.01.006 [DOI] [PubMed] [Google Scholar]
- Lushchak V. I., Lushchak L. P., Mota A. A., Hermes-Lima M. (2001). Oxidative stress and antioxidant defenses in goldfish Carassius auratus during anoxia and reoxygenation. Am. J. Physiol. Regul. Integr. Comp. Physiol. 280, R100–R107. Available online at: http://ajpregu.physiology.org/content/280/1/R100.long [DOI] [PubMed] [Google Scholar]
- Moraes G., Avilez I. M., Altran A. E., Barbosa C. C. (2002). Biochemical and hematological responses of the banded knife fish Gymnotus carapo (Linnaeus, 1758) exposed to environmental hypoxia. Braz. J. Biol. 62, 633–640. 10.1590/S1519-69842002000400011 [DOI] [PubMed] [Google Scholar]
- Murphy M. E., Noack E. (1994). Nitric oxide assay using hemoglobin method. Methods Enzymol. 233, 240–250. 10.1016/S0076-6879(94)33027-1 [DOI] [PubMed] [Google Scholar]
- Ni M., Wen H., Li J., Chi M., Bu Y., Ren Y., et al. (2014). The physiological performance and immune responses of juvenile Amur sturgeon (Acipenser schrenckii) to stocking density and hypoxia stress. Fish Shellfish Immunol. 36, 325–335. 10.1016/j.fsi.2013.12.002 [DOI] [PubMed] [Google Scholar]
- Nielsen O. B. (1997). Effects of haemoglobin O2 saturation on volume regulation in adrenergically stimulated red blood cells from the trout, Oncorhynchus mykiss. J. Comp. Physiol. B 167, 159–168. 10.1007/s003600050060 [DOI] [PubMed] [Google Scholar]
- Niki E. (2010). Assessment of antioxidant capacity in vitro and in vivo. Free Radic. Biol. Med. 49, 503–515. 10.1016/j.freeradbiomed.2010.04.016 [DOI] [PubMed] [Google Scholar]
- Nikinmaa M. (1992). Membrane transport and control of hemoglobin-oxygen affinity in nucleated erythrocytes. Physiol. Rev. 72, 301–321. [DOI] [PubMed] [Google Scholar]
- Omlin T., Weber J. M. (2010). Hypoxia stimulates lactate disposal in rainbow trout. J. Exp. Biol. 213, 3802–3809. 10.1242/jeb.048512 [DOI] [PubMed] [Google Scholar]
- Petersen L. H., Gamperl A. K. (2011). Cod (Gadus morhua) cardiorespiratory physiology and hypoxia tolerance following acclimation to low-oxygen conditions. Physiol. Biochem. Zool. 284, 18–31. 10.1086/657286 [DOI] [PubMed] [Google Scholar]
- Pick E., Mizel D. (1981). Rapid microassays for the measurement of superoxide and hydrogen peroxide production by macrophages in culture using an automatic enzyme immunoassay reader. J. Immunol. Methods 46, 211–226. 10.1016/0022-1759(81)90138-1 [DOI] [PubMed] [Google Scholar]
- Polak J., Shimoda L. A., Drager L. F., Undem C., McHugh H., Polotsky V. Y., et al. (2013). Intermittent hypoxia impairs glucose homeostasis in C57BL6/J mice: partial improvement with cessation of the exposure. Sleep 36, 1483–1490. 10.5665/sleep.3040 [DOI] [PMC free article] [PubMed] [Google Scholar]
- Prats A. C., Prats H. (2002). Translational control of gene expression: role of IRESs and consequences for cell transformation and angiogenesis. Prog. Nucleic. Acid Res. Mol. Biol. 72, 367–413. 10.1016/S0079-6603(02)72075-8 [DOI] [PubMed] [Google Scholar]
- Randall D. J., Holeton G. F., Stevens E. D. (1967). The exchange of oxygen and carbon dioxide across the gills of rainbow trout. J. Exp. Biol. 46, 339–348. [DOI] [PubMed] [Google Scholar]
- Ransberry V. E., Blewett T. A., McClelland G. B. (2016). The oxidative stress response in freshwater-acclimated killifish (Fundulus heteroclitus) to acute copper and hypoxia exposure. Comp. Biochem. Physiol. C Toxicol. Pharrmacol. 179, 11–18. 10.1016/j.cbpc.2015.08.001 [DOI] [PubMed] [Google Scholar]
- Rees B. B., Boily P., Williamson L. A. (2009). Exercise- and hypoxia-induced anaerobic metabolism and recovery: a student laboratory exercise using teleost fish. Adv. Physiol. Educ. 33, 72–77. 10.1152/advan.90188.2008 [DOI] [PubMed] [Google Scholar]
- Reid S. D., Perry S. F. (1994). Quantification of presumptive Na+/H+ antiporters of the erythrocytes of trout and eel. Fish Physiol. Biochem. 12, 455–463. 10.1007/BF00004448 [DOI] [PubMed] [Google Scholar]
- Richards J. G. (2011). Physiological, behavioral and biochemical adaptations of intertidal fishes to hypoxia. J. Exp. Biol. 214, 191–199. 10.1242/jeb.047951 [DOI] [PubMed] [Google Scholar]
- Rocchi L., Alfieri R. R., Petronini P. G., Montanaro L., Brigotti M. (2013). 5′-Untranslated region of heat shock protein 70 mRNA drives translation under hypertonic conditions. Biochem. Biophys. Res. Commun. 431, 321–325. 10.1016/j.bbrc.2012.12.100 [DOI] [PubMed] [Google Scholar]
- Ross S. W., Dalton D. A., Kramer S., Christensen B. L. (2001). Physiological (antioxidant) responses of estuarine fishes to variability in dissolved oxygen. Comp. Biochem. Physiol. C Toxicol. Pharmacol. 130, 289–303. 10.1016/S1532-0456(01)00243-5 [DOI] [PubMed] [Google Scholar]
- Routley M. H., Nilsson G. E., Renshaw G. M. (2002). Exposure to hypoxia primes the respiratory and metabolic responses of the epaulette shark to progressive hypoxia. Comp. Biochem. Physiol. A Mol. Integr. Physiol. 131, 313–321. 10.1016/S1095-6433(01)00484-6 [DOI] [PubMed] [Google Scholar]
- Rubtsova M. P., Sizova D. V., Dmitriev S. E., Ivanov D. S., Prassolov V. S., Shatsky I. N. (2003). Distinctive properties of the 5'-untranslated region of human hsp70 mRNA. J. Biol. Chem. 278, 22350–22356. 10.1074/jbc.M303213200 [DOI] [PubMed] [Google Scholar]
- Rutter J., Winge D. R., Schiffman J. D. (2010). Succinate dehydrogenase - Assembly, regulation and role in human disease. Mitochondrion 10, 393–401. 10.1016/j.mito.2010.03.001 [DOI] [PMC free article] [PubMed] [Google Scholar]
- Rytkönen K. T., Vuori K. A., Primmer C. R., Nikinmaa M. (2007). Comparison of hypoxia-inducible factor-1 alpha in hypoxia-sensitive and hypoxia-tolerant fish species. Comp. Biochem. Physiol. Part D Genomics Proteomics 2, 177–186. 10.1016/j.cbd.2007.03.001 [DOI] [PubMed] [Google Scholar]
- Sakata M., Yoshida A., Haga M. (1982). Methemoglobin in blood as determined by double-wavelength spectrophotometry. Clin. Chem. 28, 508–511. [PubMed] [Google Scholar]
- Scandalios J. G. (2005). Oxidative stress: molecular perception and transduction of signals triggering antioxidant gene defenses. Braz. J. Med. Biol. Res. 38, 995–1014. 10.1590/S0100-879X2005000700003 [DOI] [PubMed] [Google Scholar]
- Scheich H., Honegger H. W., Warrell D. A., Kennedy G. (1972). Capillary dilatation in response to hypoxia in the brain of a gobiid fish. Respir. Physiol. 15, 87–95. 10.1016/0034-5687(72)90006-0 [DOI] [PubMed] [Google Scholar]
- Segura R., Javierre C., Ventura J. L., Lizarraga M. A., Campos B., Garrido E. (1996). A new approach to the assessment of anaerobic metabolism: measurement of lactate in saliva. Br. J. Sports Med. 30, 305–309. 10.1136/bjsm.30.4.305 [DOI] [PMC free article] [PubMed] [Google Scholar]
- Singh S. P., Sharma J., Ahmad T., Chakrabarti R. (2016). Oxygen stress: impact on innate immune system, antioxidant defence system and expression of HIF-1α and ATPase 6 genes in Catla catla. Fish Physiol. Biochem. 42, 673–688. 10.1007/s10695-015-0168-0 [DOI] [PubMed] [Google Scholar]
- Sollid J., De Angelis P., Gundersen K., Nilsson G. E. (2003). Hypoxia induces adaptive and reversible gross morphological changes in crucian carp gills. J. Exp. Biol. 206, 3667–3673. 10.1242/jeb.00594 [DOI] [PubMed] [Google Scholar]
- Southorn P. A., Powis G. (1988). Free radicals in medicine. I. Chemical nature and biologic reactions. Mayo Clin. Proc. 63, 381–389. 10.1016/S0025-6196(12)64861-7 [DOI] [PubMed] [Google Scholar]
- Stoneley M., Chappell S. A., Jopling C. L., Dickens M., MacFarlane M., Willis A. E. (2000). c-Myc protein synthesis is initiated from the internal ribosome entry segment during apoptosis. Mol. Cell Biol. 20, 1162–1169. 10.1128/MCB.20.4.1162-1169.2000 [DOI] [PMC free article] [PubMed] [Google Scholar]
- Trinder P. (1969). Determination of blood glucose using an oxidase-peroxidase system with a non-carcinogenic chromogen. J. Clin. Pathol. 22, 158–161. 10.1136/jcp.22.2.158 [DOI] [PMC free article] [PubMed] [Google Scholar]
- Turrens J. F. (2003). Mitochondrial formation of reactive oxygen species. J. Physiol. 552, 335–344. 10.1113/jphysiol.2003.049478 [DOI] [PMC free article] [PubMed] [Google Scholar]
- Urbina M. A., Forster M. E., Glover C. N. (2011). Leap of faith: voluntary emersion behaviour and physiological adaptations to aerial exposure in a non-aestivating freshwater fish in response to aquatic hypoxia. Physiol. Behav. 103, 240–247. 10.1016/j.physbeh.2011.02.009 [DOI] [PubMed] [Google Scholar]
- Urbina M. A., Glover C. N. (2012). Should I stay or should I go?: physiological, metabolic and biochemical consequences of voluntary emersion upon aquatic hypoxia in the scaleless fish Galaxias maculatus. J. Comp. Physiol. B 182, 1057–1067. 10.1007/s00360-012-0678-3 [DOI] [PubMed] [Google Scholar]
- Wahren J., Ekberg K. (2007). Splanchnic regulation of glucose production. Annu. Rev. Nutr. 27, 329–345. 10.1146/annurev.nutr.27.061406.093806 [DOI] [PubMed] [Google Scholar]
- Wang H., Huang C., Chen N., Zhu K., Chen B., Wang W., et al. (2015). Molecular characterization and mRNA expression of HIF-prolyl hydroxylase-2 (phd2) in hypoxia-sensing pathways from Megalobrama amblycephala. Comp. Biochem. Physiol. B Biochem. Mol. Biol. 186, 28–35. 10.1016/j.cbpb.2015.04.001 [DOI] [PubMed] [Google Scholar]
- Wood S. C., Johansen K. (1972). Adaptation to hypoxia by increased HbO 2 affinity and decreased red cell ATP concentration. Nat. New Biol. 237, 278–279. 10.1038/newbio237278a0 [DOI] [PubMed] [Google Scholar]
- Wood S. C., Johansen K., Weber R. E. (1975). Effects of ambient PO2 on hemoglobin-oxygen affinity and red cell ATP concentrations in a benthic fish, Pleuronectes platessa. Respir. Physiol. 25, 259–267. 10.1016/0034-5687(75)90002-X [DOI] [PubMed] [Google Scholar]
Associated Data
This section collects any data citations, data availability statements, or supplementary materials included in this article.