Abstract
A highly sensitive and simple colorimetric assay for the detection of Fe3+ ions was developed using gold nanoparticles (AuNPs) conjugated with glycol chitosan (GC). The Fe3+ ion coordinates with the oxygen atoms of GC in a hexadentate manner (O-Fe3+-O), decreasing the interparticle distance and inducing aggregation. Time-of-flight secondary ion mass spectrometry showed that the bound Fe3+ was coordinated to the oxygen atoms of the ethylene glycol in GC, which resulted in a significant color change from light red to dark midnight blue due to aggregation. Using this GC-AuNP probe, the quantitative determination of Fe3+ in biological, environmental, and pharmaceutical samples could be achieved by the naked eye and spectrophotometric methods. Sensitive response and pronounced color change of the GC-AuNPs in the presence of Fe3+ were optimized at pH 6, 70°C, and 300 mM NaCl concentration. The absorption intensity ratio (A700/A510) linearly correlated to the Fe3+ concentration in the linear range of 0–180 μM. The limits of detection were 11.3, 29.2, and 46.0 nM for tap water, pond water, and iron supplement tablets, respectively. Owing to its facile and sensitive nature, this assay method for Fe3+ ions can be applied to the analysis of drinking water and pharmaceutical samples.
1. Introduction
Fe3+ is an essential trace metal ion that plays a vital role in living organisms. It is essential to maintain and balance the iron level in our body because both its deficiency and its excess can induce a variety of diseases [1–4]. In this context, a convenient assay method is required, necessitating the design of simple, highly sensitive, and selective sensor for trace level detection of Fe3+ in biological and environmental samples.
Numerous analytical methods including inductively coupled plasma atomic emission spectrometry, atomic absorption spectrometry (AAS), and inductively coupled plasma mass spectrometry have recently been utilized to detect ferric ions [5, 6]. However, these methods usually require sophisticated instrumentation, tedious sample pretreatment steps, and well-trained operators. Therefore, development of a facile analytical method for the detection of Fe3+ ions is still highly desirable. Recently, numerous fluorescence sensors and chemosensors have been reported for the detection of metal ions; these sensors have several advantages, such as ease of use, high sensitivity, low-cost, and enabling of on-site monitoring [7–16]. Colorimetric nanoparticle assays have also been widely used to monitor metal ions because of their cost-efficiency and applicability for on-site monitoring, as opposed to other methods [17, 18]. Advances in nanoscience and nanotechnology have led to the development of new nanoparticle assays for Fe3+ ions detection such as Cu or Au nanoclusters [19, 20], etching [21, 22], graphene quantum dot [23], and carbon dot [24] assay methods. Moreover, nanoparticle-based assay method using ligands that coordinate to Fe3+ ions have been recently reported, in which nanoparticles are functionalized with receptors with specific binding affinity for Fe3+ ions. Among these, silver nanoparticles (AgNPs) conjugated with a pyridyl-appended calix[4]arene and gold nanoparticles (AuNPs) functionalized with pyrophosphate, histidine, or p-amino salicylic acid dithiocarbamate have recently been developed as Fe3+ color sensors [25–28].
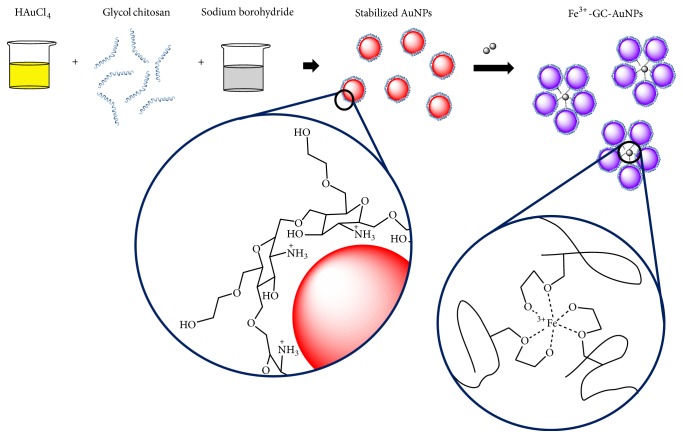
Glycol chitosan (GC) is a water soluble chitosan derivative, and AuNPs conjugated with GC (GC-AuNPs) have been used in biomedical applications [29, 30]. GC can easily bind to AuNPs through the -NH groups as -SH groups were usually conjugated to AuNPs (Scheme 1). The physicochemical properties of GC could be exploited to develop colorimetric probes for specific metal ion monitoring in aqueous solution, based on the complexing ability of its oxygen atoms with metal ions. The binding sites of GC-AuNPs for Fe3+ ions were characterized by time-of-flight secondary ion mass spectrometry (TOF-SIMS) and X-ray photoelectron spectroscopy (XPS).
Scheme 1.
Schematic illustration of a AuNP capped with GC, aggregation of GC-AuNPs reacting with Fe3+ ions, accompanied by a color change, and the predicted coordination bond between Fe3+ ions and GC-AuNP. AuNPs, gold nanoparticles; GC-AuNPs, gold nanoparticles conjugated with GC.
We show here that GC-AuNPs aggregate upon reaction with Fe3+ ions, leading to a color change only observed for Fe3+ ions even in the presence of other metal ions. The potential interference effects from other anions were also evaluated. In addition, the optimum conditions, concentration linearity of the reaction, and limit of detection for the GC-AuNP Fe3+ sensor were identified. This optimized GC-AuNPs could be exploited in simple and convenient real-time assays for the detection of Fe3+ ions.
2. Materials and Methods
2.1. Materials
Gold(III) chloride trihydrate (HAuCl4·3H2O), GC, sodium borohydride (NaBH4), sodium thiocyanate (NaSCN), sodium cyanide (NaCN), ascorbic acid, sodium hexametaphosphate ((NaPO3)6), iron(II) sulfate heptahydrate (FeSO4·7H2O), lithium iron(II) phosphate (LiFePO4), and iron disulfide (FeS2) were sourced from Sigma-Aldrich (St. Louis, MO, USA). Salts of Fe3+, Fe2+, Ba2+, Mn2+, Ga3+, Ti4+, Al3+, Mg2+, K+, Ag+, Ge4+, Cr3+, Cu2+, Li+, As3+, Co2+, Sn2+, Na+, Pb2+, Hg2+, Ni2+, and Zn2+ were purchased from Accu Standard (New Haven, CT, USA). NaCl, HCl, and NaOH were purchased from Samchun Chemical (Gyeong gi-Do, Korea). Distilled water was obtained using a Milli-Q water purification system (Millipore, Bedford, MA, USA). Iron supplement tablets were sourced from Green Cross (Gyeong gi-Do, Korea).
2.2. Apparatus
Absorption spectra were recorded on a Sinco S-3100 UV-Vis spectrometer in the range of 300–800 nm using 4-mm path length quartz cuvettes. The pH of the solutions was measured with an HI 2210 pH meter. The concentration of Fe3+ ions in aqueous solutions was measured by Varian AAS. A 400 MHz Bruker NMR spectrometer was used to record NMR spectra. Mass spectra were measured using ION-TOF TOF-SIMS. Malvern Zetasizer was used to determine the particle size distribution. CM30 transmission electron microscopy (TEM) and XE-100 atomic force microscopy (AFM) images were obtained from samples prepared by depositing a dispersion of AuNPs and evaporating the solvent.
2.3. Preparation of GC-AuNPs
GC-AuNPs were synthesized following literature procedures [29, 30]: 1 mL of HAuCl4·3H2O (0.025 M) was added to 23 mL of ultrapure water in a round bottom flask with continuous stirring. Then, 7.8 mL of GC (5.64 mM) was added to the stirred solution followed by the slow addition of NaBH4 (0.5%), and the solution turned to wine-red. The mixture was stirred overnight at 4°C.
2.4. Colorimetric Detection of Fe3+ Ions in Real Samples Using Nanoparticles
To evaluate the utility of the method, Fe3+ ions in real water samples were determined. Samples were collected from tap and pond water in our research institute (Korea Institute of Science and Technology (KIST)). The results of our method were confirmed by AAS measurements. A syringe filter with pore size of 0.20 μm was used to remove the suspended particles in all water samples. Sample aliquots (9 mL) were mixed with a 100 μgmL−1 Fe3+ solution (1 mL) to produce a 10 μg mL−1 Fe3+ concentrated solution. About 0–10 μL of real water samples containing 0–1.0 μgmL−1 Fe3+ was analyzed using the GC-AuNP solution. The Fe3+ content of iron supplement tablets obtained from a local drugstore was quantified. All tablet samples were dissolved in water and centrifuged for 30 min to remove suspended particles. Iron supplements containing 0–20 mg of Fe3+ according to manufacturer specifications were examined using 1 mL of the GC-AuNP solution. The analytical results obtained for real samples using GC-AuNP sensing were subsequently confirmed by UV-Vis spectrophotometry.
3. Results and Discussion
3.1. Characterization of GC-AuNPs and Their Complexes with Fe3+
HAuCl4·3H2O was reduced in the presence of GC using NaBH4 as a reducing agent to form GC-AuNPs. The GC-AuNPs obtained under these conditions are much smaller (~10 nm) than those obtained by the conventional citrate-based reduction method (~33 nm). The mean AuNP size is dependent on the amount of reducing agent used and on other conditions [31–35].
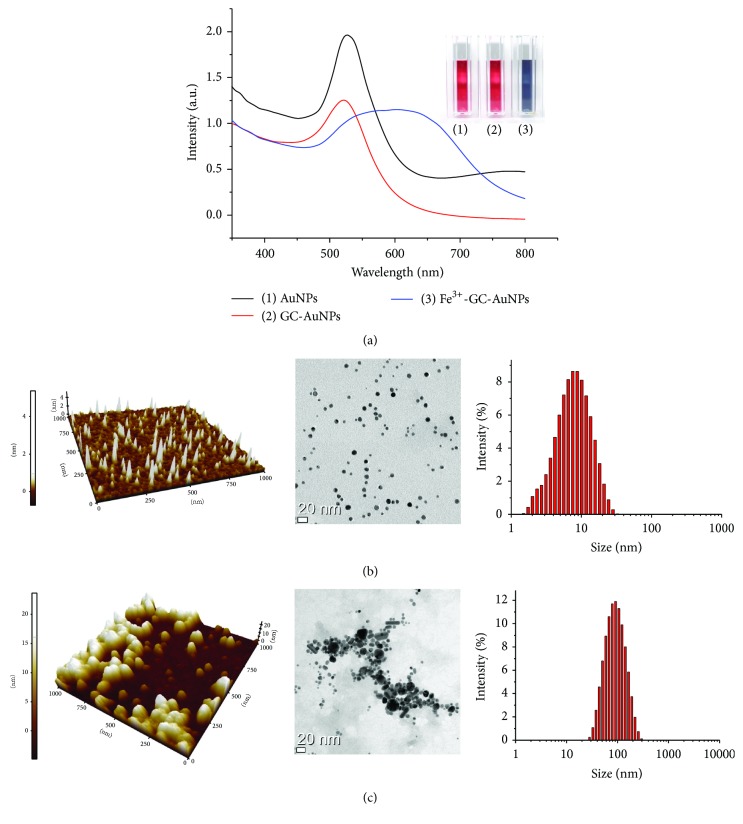
The localized surface plasmon resonance (LSPR) maxima and sensing performance of AuNPs depend on the AuNP size. A strong LSPR peak appears at ca. 510 nm in the UV-Vis spectrum of label-free AuNPs, which is associated with the red color of their solutions. Notably, solutions of GC-AuNPs exhibit a similar red color. Thus, it was envisioned that this intense red color could be used to develop a facile assay method for the determination of metal ions. Upon addition of 180 µM Fe3+, the color of GC-AuNP solutions was found to rapidly change from red to dark midnight blue (Figure 1(a)), and the intensity of the UV-Vis absorption band at 510 nm decreased with concomitant formation of a new peak at 700 nm. This could be explained by the binding of Fe3+ to GC-capped AuNPs, which reduces the internanoparticle distance resulting in a close interaction among GC-AuNPs. The aggregation of GC-AuNPs in the presence of Fe3+ ions leads to the delocalization of the surface conduction electrons of AuNPs over neighboring particles, which results in the shift of the absorption band towards lower energies. This phenomenon allows the easy differentiation of Fe3+ from other metal ions. AFM and TEM images as well as size distribution measurements of GC-AuNPs and Fe3+-GC-AuNPs (Figures 1(b) and 1(c)) revealed that the size of GC-AuNPs and Fe3+-GC-AuNPs was ~10 and 102 nm, respectively (in agreement with the values obtained by Zetasizer measurements).
Figure 1.
(a) UV-Vis absorption spectra of (1) AuNPs, (2) GC-AuNPs, and (3) GC-AuNPs conjugated with Fe3+. (b) 3D-AFM image (left), TEM image (middle), and the corresponding particle size distribution histogram of GC-AuNPs (right). (c) 3D-AFM image (left), TEM image (middle), and particle size distribution histogram of GC-AuNPs conjugated with Fe3+ (right). AuNPs, gold nanoparticles; GC-AuNPs, gold nanoparticles conjugated with GC.
3.2. Selectivity of GC-AuNPs for Fe3+ Ions and Interference Effects
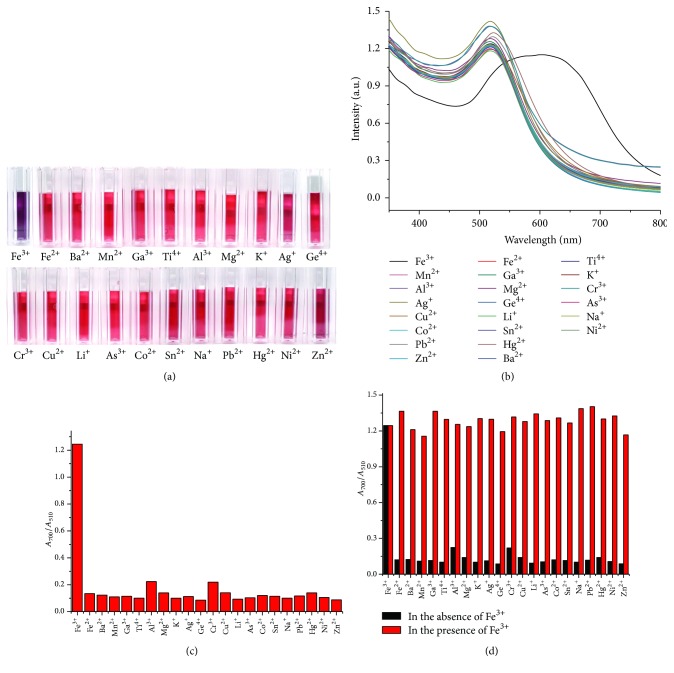
The selectivity of the GC-AuNP sensor towards Fe3+ was investigated by using 90 μM Fe3+ and 900 μM other metal cations (Fe2+, Ba2+, Mn2+, Ga3+, Ti4+, Al3+, Mg2+, K+, Ag+, Ge4+, Cr3+, Cu2+, Li+, As3+, Co2+, Sn2+, Na+, Pb2+, Hg2+, Ni2+, and Zn2+ ions). It was found that, besides Fe3+, the other metal ions did not give any color change (Figure 2(a)). The absorption spectra of GC-AuNP solutions upon addition of various metal ions were recorded at pH 6, 70°C, and 300 mM NaCl concentration (Figure 2(b)), and the absorption band at 700 nm was uniquely strong for Fe3+, allowing its easy differentiation from other ions. The selectivity for Fe3+ ions was estimated by comparing of the absorbance ratio (A700/A510) of the solution containing Fe3+ ions with that of solutions containing other metal ions (Figure 2(c)). The reason why the absorbance ratio was calculated with the absorbance at 510 and 700 nm was that the absorption ratio (A700/A510) was linearly correlated to the Fe3+ concentration in the linear range of 0–180 μM. A high absorbance ratio was attributed to aggregated AuNPs exhibiting a dark midnight blue color, whereas a lower ratio indicated well-dispersed GC-AuNPs. AuNPs were found to selectively react with Fe3+ ions, as indicated by the marked increase in the corresponding absorbance ratio. Specifically, the absorbance ratio of GC-AuNPs in the presence of Fe3+ was about 6–8 times higher than those obtained for other metal ions, suggesting a specific metal ion coordination between GC-AuNPs and Fe3+ ions. To investigate the interference effect of other metal ions on the selectivity of GC-AuNPs towards Fe3+, we examined the absorbance intensity of GC-AuNPs in the simultaneous presence of Fe3+ and other metal ions. The determination of Fe3+ ions was not affected by other metal ions, even when their concentration was ten times higher than that of Fe3+, because no metal ions except Fe3+ produced an absorption band at 700 nm (Figure 2(d)). Thus, other metal ions did not show any interference under the optimum Fe3+ sensing conditions, proving the excellent selectivity of the GC-AuNP probe for Fe3+ monitoring. The selectivity for Fe3+ ions was further tested using solutions containing various anions. Interestingly, among the tested anions, GC-AuNPs were found to react exclusively with iodide ions (Figure S1A in the Supporting Information available online at https://doi.org/10.1155/2017/3648564) among various anions. This interference was removed by the addition of a masking agent (SCN−) for iodide ions (Figure S1(B) in the Supporting Information) [36].
Figure 2.
(a) Photographic color images, (b) UV-Vis absorption spectra, and (c) absorption ratios (A700/A510) of GC-AuNPs with 90 μM Fe3+ and 900 μM metal cations (Fe2+, Ba2+, Mn2+, Ga3+, Ti4+, Al3+, Mg2+, K+, Ag+, Ge4+, Cr3+, Cu2+, Li+, As3+, Co2+, Sn2+, Na+, Pb2+, Hg2+, Ni2+, and Zn2+ ions) at pH 6, 70°C, and 300 mM NaCl concentration. (d) Absorption ratios (A700/A510) of GC-AuNPs with 900 μM metal cations (Fe3+, Fe2+, Ba2+, Mn2+, Ga3+, Ti4+, Al3+, Mg2+, K+, Ag+, Ge4+, Cr3+, Cu2+, Li+, As3+, Co2+, Sn2+, Na+, Pb2+, Hg2+, Ni2+, and Zn2+ ions) in the presence and absence of 90 μM Fe3+.
3.3. GC to AuNP and Fe3+ to GC-AuNP Binding Sites
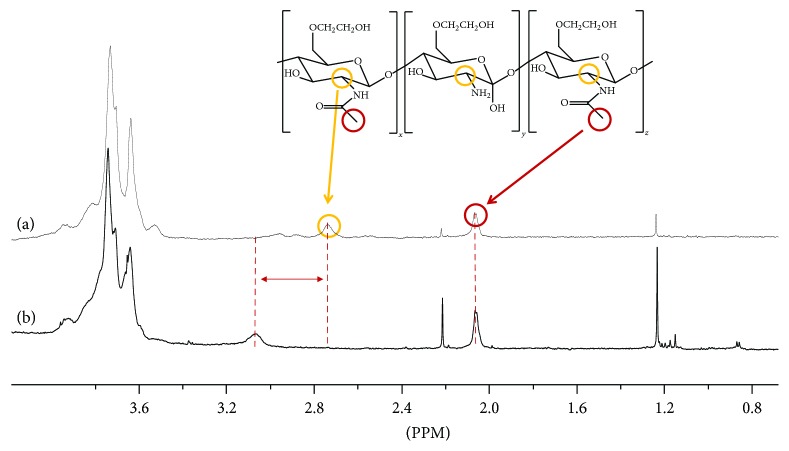
The binding sites of GC on the AuNPs were investigated by 1H NMR spectroscopy (Figure 3). The 1H NMR spectrum of free GC showed two characteristic peaks at 2.06 ppm (CH3 protons of the acetyl groups of N-acetamidoglucose units) and 2.60 ppm (CH proton of N-unsubstituted glucosamine units). The signal of GC at 2.60 ppm shifted to 3.06 ppm in the spectrum of GC-AuNPs, whereas that at 2.06 ppm did not shift (Figure 3(b)), indicating that the AuNPs were conjugated to the nitrogen atoms of GC, as expected [37].
Figure 3.
1H NMR spectra of (a) GC and (b) GC-AuNPs.
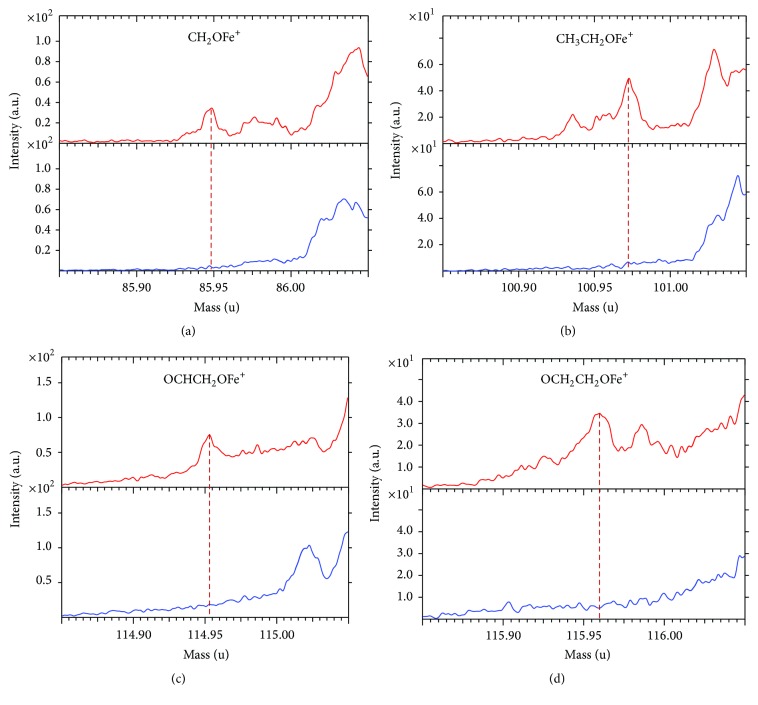
To confirm the Fe3+-binding sites, TOF-SIMS spectra were recorded for GC-AuNPs and Fe3+-GC-AuNPs (Figure 4). The TOF-SIMS spectrum of Fe3+-GC-AuNPs displayed fragments corresponding to CH2OFe+, OCHCH2OFe+, CH3CH2OFe+, and OCH2CH2OFe+, whereas these were not observed in the corresponding spectrum of GC-AuNPs. These fragment patterns indicate that Fe3+ must be bound to the ethylene glycol oxygen atoms of GC [38, 39].
Figure 4.
Mass peaks of (a) CH2OFe+, (b) CH3CH2OFe+, (c) OCHCH2OFe+, and (d) OCH2CH2OFe+ fragments in the TOF-SIMS spectrum of GC-AuNPs (blue) and Fe3+-GC-AuNPs (red). These molecular fragments were expected based on the Fe3+-GC-AuNP structural elements in the zoomed circle in Scheme 1.
Next, we measured the XPS spectra of GC-AuNPs and Fe3+-GC-AuNPs to characterize the binding of Fe3+ ion to GC-AuNPs (Figure S2 in the Supporting Information). In the spectrum of Fe3+-GC-AuNPs, the high resolution Fe 2p3/2 signal at 710.6 eV is attributed to the binding energy of Fe-O bonds, indicating that the Fe3+ ions are bound to the oxygen atoms of GC [40].
3.4. Optimum Sensitivity Conditions for the GC-AuNP Sensor
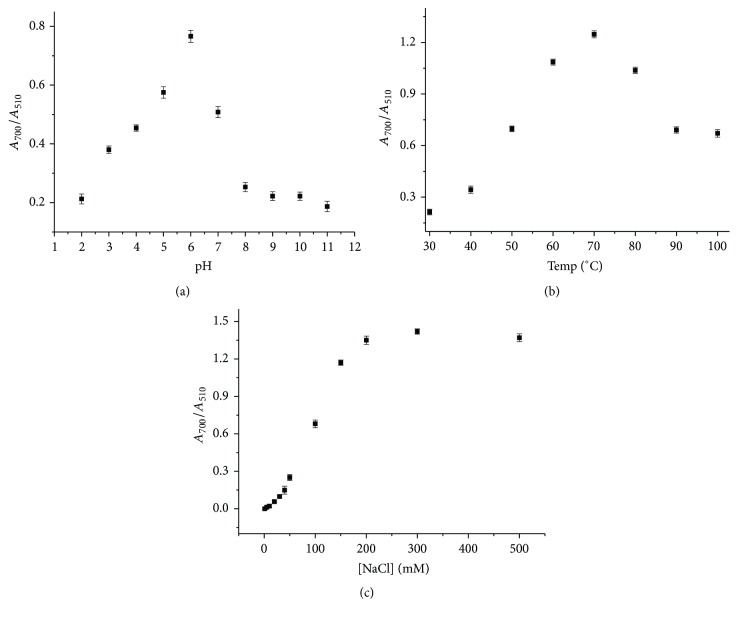
After establishing the good selectivity of GC-AuNPs towards Fe3+, the sensitivity of the GC-AuNP probe was examined as a function of pH, temperature, salt concentration, GC concentration, and reaction time. The performance of the GC-AuNP sensor towards Fe3+ was highly influenced by the pH of the medium. The absorbance ratio (A700/A510) changes of Fe3+-GC-AuNPs were examined in the range of pH 2–11, and it was found that this ratio dramatically increased at pH 6 (Figure 5(a)). Presumably, Fe3+ ions are optimally bound to the O atoms of GC in its O-hexadentate form at slightly acidic pH (pH 6), resulting in the highest sensitivity.
Figure 5.
Absorption ratios (A700/A510) of Fe3+-GC-AuNPs as a function of (a) pH, (b) temperature, and (c) concentration of NaCl.
Next, the GC-AuNP aggregation in the presence of Fe3+ ions was tested in the temperature range of 30–100°C. Although the absorption ratio increased as the temperature was raised from 30 to 70°C, it significantly decreased from 70 to 100°C. GC conjugated to AuNP seemed to be perturbed structurally above 70°C. As a result, 70°C was chosen as the optimal temperature (Figure 5(b)).
The aggregation of GC-AuNPs in the presence of Fe3+ ions was optimized by increasing the NaCl concentration above ~50 mM. The absorption ratio increased until the salt concentration reached 300 mM (Figure 5(c)). As a result, this concentration was used, which resulted in the highest absorption ratio.
In order to determine the optimum GC concentration for conjugation to AuNPs a 0.4 μg mL−1 Fe3+ solution was added to the sample, and the absorbance ratios were measured. The most suitable GC concentration for AuNP aggregation was found to be 30–35 μM (data not shown).
Moreover, the aggregation kinetics of GC-AuNPs in the presence of various Fe3+ concentrations were evaluated by monitoring the absorbance ratios. The absorbance ratios continuously increased and reached a plateau at 40-min regardless of the Fe3+ concentration; thus, a 40-min reaction time was found to be necessary (Figure S3 in the Supporting Information).
3.5. Quantitation of Fe3+ Using the GC-AuNPs Sensor
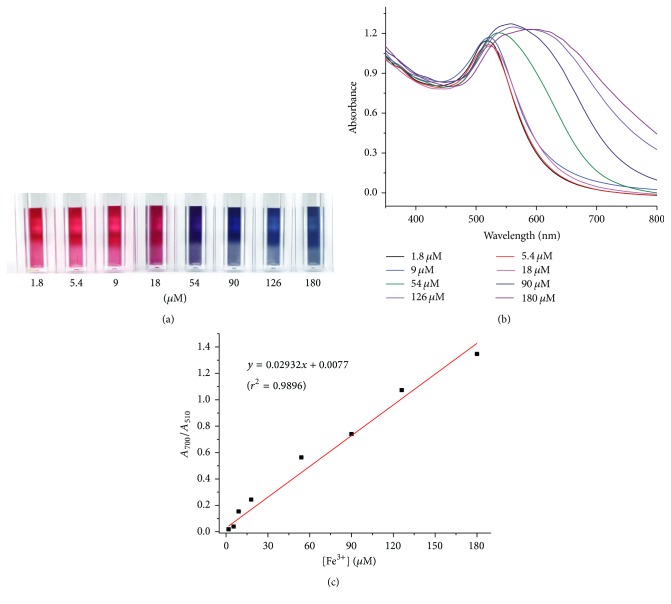
The color change of GC-AuNPs correlates with the concentration of Fe3+ ions and can be monitored from the absorption ratio. The GC-AuNP solution color changed gradually from red to dark midnight blue as the Fe3+ concentration increased (Figure 6(a)). The absorbance increase at 700 nm and the concomitant decrease of the peak at 510 nm were measured for increasing Fe3+ concentrations (1.8, 5.3, 8.9, 17.9, 53.7, 89.5, 125.3, and 179.0 μM) in GC-AuNP solutions (Figure 6(b)). The absorbance ratio at each Fe3+ ion concentration was determined in triplicate (Figure 6(c)) within the linear dynamic range of the calibration curve (0.0–180 μM). Linear regression analysis of the calibration curve displayed good linearity with a regression coefficient of 0.9834. The limits of detection (LODs) of this colorimetric probe were calculated to be 11.3, 29.2, and 46.0 nM for tap water, pond water, and iron supplements, respectively, using (3σ/slope).
Figure 6.
(a) Photographic images of the color change of GC-AuNPs upon Fe3+ addition at various concentrations (1.8, 5.3, 8.9, 17.9, 53.7, 89.5, 125.3, and 179.0 μM from left to right) in the presence of 300 mM NaCl. (b) UV-Vis absorption spectra of GC-AuNPs upon addition of Fe3+ of various concentrations of Fe3+ (i.e., 1.8, 5.3, 8.9, 17.9, 53.7, 89.5, 125.3, and 179.0 μM) in the presence of 300 mM NaCl. (c) Absorption ratios (A700/A510) of Fe3+-GC-AuNP versus Fe3+ concentration in the presence of 300 mM NaCl (y = 0.02932x + 0.0077 (r2 = 0.9896)).
3.6. Application of the GC-AuNP Probe in the Analysis of Real Samples
This colorimetric method was validated by determination of Fe3+ in real tap water, pond water, and iron supplement samples. Tap water, pond water, and iron supplement samples added with 0.6 and 1.8 μM Fe3+ were analyzed using the GC-AuNP probe and by AAS. The results of the GC-AuNP probe assay are in good agreement with those obtained by AAS, as shown in Table 1.
Table 1.
Determination of Fe3+ ions in spiked tap water, pond water, and iron supplement samples analyzed by the GC-AuNP probe and AAS.
| Amount of Fe3+ added to real samples (n = 7) | ||||||
|---|---|---|---|---|---|---|
| Sample | Present probe | AAS | ||||
| Added amount (nM) |
Detected amount (nM) |
Coefficient of variation (%) |
Recovery (%) |
LOD (nM) |
Detected amount (nM) |
|
| Tap water | 60.0 | 60.4 ± 0.745 | 1.23 | 100.7 ± 1.24 | 11.3 | 60.0 ± 1.00 × 10⁻² |
| 1.80 × 10² | 1.81 × 10² ± 0.472 | 0.261 | 100.6 ± 0.262 | 1.80 × 10² ± 1.00 × 10⁻² | ||
| Pond water | 60.0 | 60.3 ± 0.429 | 0.711 | 100.6 ± 0.715 | 29.2 | 60.0 ± 1.00 × 10⁻² |
| 1.80 × 10² | 1.80 × 10² ± 0.413 | 0.229 | 100.1 ± 0.229 | 1.80 × 10² ± 1.00 × 10⁻² | ||
| Iron supplement | 60.0 | 60.4 ± 0.629 | 1.04 | 100.7 ± 1.05 | 46.0 | 60.0 ± 1.00 × 10⁻² |
| 1.80 × 10² | 1.79 × 10² ± 1.05 | 0.589 | 99.6 ± 0.587 | 1.80 × 10² ± 1.00 × 10⁻² | ||
As can be seen from Table 2, no Fe3+ ions were detected in real water samples by both the colorimetric AuNP probe and AAS. Therefore, the present assay method for the detection of Fe3+ ions in aqueous samples would be superior to the currently used AAS method in terms of facileness, sensitivity, and cost.
Table 2.
Determination of Fe3+ in real water samples collected from KIST.
| Sample | Content of Fe3+ ion (μM) | |
|---|---|---|
| Present probe | AAS | |
| Tap water | <0.01 | <0.1 |
| Pond water | <0.01 | <0.1 |
It should be noted that the present probe provides the lowest LOD for the analysis of Fe3+ ions in aqueous samples as compared to the previously reported nanoparticle sensors for the detection of Fe3+ ions, as shown in Table 3.
Table 3.
Comparison of present probe with previously reported nanoparticle assay methods for the analysis of Fe3+.
| Detection tool | Functionalized agent | Sensing method | LDRa | LODb | Ref |
|---|---|---|---|---|---|
| Chemosensor | 2-Chloro-N-(9-ethyl-9H-carbazol-3-yl)acetamide and 2-(((pyridin-2-ylmethyl)amino)methyl) phenol | Color change | — | 13.5 μM | [14] |
| Chemosensor | 2-(Aminomethyl)benzimidazole dihydrochloride and 4-diethylaminosalicylaldehyde | Color change | 0–5.0 μM | 1.21 μM | [15] |
| Chemosensor | 5-Amino-1H-imidazole-4-carboxamide and 8-hydroxyjulolidine-9-carboxaldehyde | Fluorescence | — | 0.27 μM | [16] |
| Cu nanoclusters | Polyethylenimine | Fluorescence | 0.5–1000 μM, | 0.34 μM | [19] |
| Au nanoclusters | L-3,4-Dihydroxyphenylalanine | Fluorescence | 5–1280 μM | 3.5 μM | [20] |
| AgNPs | N-Acetyl-L-cysteine | Color change (etching) |
80 nM–80 mM | 80 nM | [21] |
| Au nanorods | Label-free | Color change (etching) |
— | 1.79 μM | [22] |
| Graphene quantum dots | 1-Butyl-3-methylimidazolium hexafluorophosphate (BMIMPF6) |
Fluorescence | 0–80 µM | 7.22 µM | [23] |
| Carbon dots | label-free | Fluorescence | 0–20 μM. | 0.32 μM | [24] |
| AgNPs | Calix[4] resorcinarene polyhydrazide | Fluorescence | 0.1–10 μM | 0.1 μM. | [25] |
| AuNPs | Pyrophosphate | Color change (aggregation) |
10–60 μM | 5.6 μM. | [26] |
| AuNPs | Histidine | Color change (aggregation) |
— | — | [27] |
| AuNPs | p-Amino salicylic acid dithiocarbamate | Color change (aggregation) |
40–80 mM | 14.82 nM | [28] |
| AuNPs | Glycol chitosan | Color change (aggregation) |
0.0–180 μM | 11.3 nM | This work |
aLDR; linear dynamic range; bLOD; limit of detection.
4. Conclusions
AuNPs conjugated with GC were prepared and used for the selective and highly sensitive colorimetric detection of Fe3+. The sensing mechanism of this colorimetric probe is based on the aggregation of GC-AuNPs in the presence of Fe3+ ions, which were found to be coordinated to the ethylene glycol oxygen atoms of GC conjugated to the nanoparticles.
This method offers a simple, highly sensitive, highly selective, and inexpensive on-site monitoring of Fe3+ ions, allowing detection of concentrations as low as 11.3 nM to be achieved within 40 min.
Supplementary Material
Fig. S1: (A) Absorption ratios (A700/A510) of GC-AuNPs with 90 μM Fe3+ and 900 μM anions. (B) Absorption ratios (A700/A510) of GC-AuNPs with 90 μM Fe3+ and 900 μM anions in the presence of the masking agent SCN−. Fig. S2: (A) XPS spectra of GC-AuNPs and Fe3+-GC-AuNPs. (B) Fe 2p3/2 signal in Fe3+-GC-AuNPs at 710.6 eV. Fig. S3: Absorbance ratio (A700/A510) as a function of time over 60 min.
Acknowledgments
This research was financially supported by the Korea Institute of Science and Technology (2E27070) and Korea Ministry of Environment (2016000160008) as “Public Technology Program based on Environmental Policy.”
Conflicts of Interest
The authors declare that there are no conflicts of interest regarding the publication of this paper.
Authors' Contributions
Kyungmin Kim and Yun-Sik Nam equally contributed to this work.
References
- 1.Cowan J. A. Inorganic Biochemistry: An Introduction. Weinheim, Germany: Wiley-VCH; 1997. [Google Scholar]
- 2.Haas J. D., Brownlie T. Iron deficiency and reduced work capacity: a critical review of the research to determine a causal relationship. The Journal of Nutrition. 2001;131(2):676S–690S. doi: 10.1093/jn/131.2.676S. [DOI] [PubMed] [Google Scholar]
- 3.Burdo J. R., Connor J. R. Brain iron uptake and homeostatic mechanisms: an overview. BioMetals. 2003;16(1):63–75. doi: 10.1023/A:1020718718550. [DOI] [PubMed] [Google Scholar]
- 4.Ghaedi M., Shokrollahi A., Kianfar A. H., Mirsadeghi A. S., Pourfarokhi A., Soylak M. The determination of some heavy metals in food samples by flame atomic absorption spectrometry after their separation-preconcentration on bis salicyl aldehyde, 1,3 propan diimine (BSPDI) loaded on activated carbon. Journal of Hazardous Materials. 2008;154(1–3):128–134. doi: 10.1016/j.jhazmat.2007.10.003. [DOI] [PubMed] [Google Scholar]
- 5.Wełna M., Lasowska J., Zyrnicki W. Determination of some inorganic species of Fe, Mn and Cr by chemical vapor generation hyphenated with inductively coupled plasma atomic emission spectrometry. Journal of the Brazilian Chemical Society. 2011;22(6):1164–1169. doi: 10.1590/s0103-50532011000600023. [DOI] [Google Scholar]
- 6.Hu Q. Simultaneous separation and quantification of iron and transition species using LC-ICP-MS. American Journal of Analytical Chemistry. 2011;2(6):675–682. [Google Scholar]
- 7.Lin W., Long L., Yuan L., Cao Z., Feng J. A novel ratiometric fluorescent Fe3+ sensor based on a phenanthroimidazole chromophore. Analytica Chimica Acta. 2009;634(2):262–266. doi: 10.1016/j.aca.2008.12.049. [DOI] [PubMed] [Google Scholar]
- 8.Ma B., Wu S., Zeng F. Reusable polymer film chemosensor for ratiometric fluorescence sensing in aqueous media. Sensors and Actuators B: Chemical. 2010;145(1):451–456. doi: 10.1016/j.snb.2009.12.054. [DOI] [Google Scholar]
- 9.Lohani C. R., Kim J. M., Lee K. H. Facile synthesis of anthracene-appended amino acids as highly selective and sensitive fluorescent Fe3+ ion sensors”. Bioorganic & Medicinal Chemistry Letters. 2009;19:6069–6073. doi: 10.1016/j.bmcl.2009.09.036. [DOI] [PubMed] [Google Scholar]
- 10.Weerasinghe A. J., Schmiesing C., Varaganti S., Ramakrishna G., Sinn E. Single- and multiphoton turn-on fluorescent Fe3+ sensors based on Bis(rhodamine) Journal of Physical Chemistry B. 2010;114(29):9413–9419. doi: 10.1021/jp1034568. [DOI] [PubMed] [Google Scholar]
- 11.Goswami S., Das S., Aich K., et al. CHEF induced highly selective and sensitive turn-on fluorogenic and colorimetric sensor for Fe3+ Dalton Transactions. 2013;42(42):15113–15119. doi: 10.1039/c3dt51974k. [DOI] [PubMed] [Google Scholar]
- 12.You G. R., Park G. J., Lee S. A., Ryu K. Y., Kim C. Chelate-type Schiff base acting as a colorimetric sensor for iron in aqueous solution. Sensors and Actuators B: Chemical. 2015;215:188–195. doi: 10.1016/j.snb.2015.03.064. [DOI] [Google Scholar]
- 13.Ma B., Wu S., Zeng F., Luo Y., Zhao J., Tong Z. Nanosized diblock copolymer micelles as a scaffold for constructing a ratiometric fluorescent sensor for metal ion detection in aqueous media. Nanotechnology. 2010;21(19) doi: 10.1088/0957-4484/21/19/195501.195501 [DOI] [PubMed] [Google Scholar]
- 14.Park G. J., You G. R., Choi Y. W., Kim C. A naked-eye chemosensor for simultaneous detection of iron and copper ions and its copper complex for colorimetric/fluorescent sensing of cyanide. Sensors and Actuators B: Chemical. 2016;229:257–271. doi: 10.1016/j.snb.2016.01.133. [DOI] [Google Scholar]
- 15.Kim Y. S., Lee J. J., Y Lee S., Jo T. G., Kim C. A highly sensitive benzimidazole-based chemosensor for the colorimetric detection of Fe(II) and Fe(III) and the fluorometric detection of Zn(II) in aqueous media. RSC Advances. 2016;6:61505–61515. [Google Scholar]
- 16.Jo T. G., Bok K. H., Han J., Lim M. H., Kim C. Colorimetric detection of Fe3+ and Fe2+ and sequential fluorescent detection of Al3+ and pyrophosphate by an imidazole-based chemosensor in a near-perfect aqueous solution. Dyes and Pigments. 2017;139:136–147. [Google Scholar]
- 17.Noh K. C., Nam Y. S., Lee H. J., Lee K. B. A colorimetric probe to determine Pb2+ using functionalized silver nanoparticles. Analyst. 2015;140:8209–8216. doi: 10.1039/c5an01601k. [DOI] [PubMed] [Google Scholar]
- 18.Lee S., Nam Y.-S., Lee H.-J., Lee Y., Lee K.-B. Highly selective colorimetric detection of Zn(II) ions using label-free silver nanoparticles. Sensors and Actuators B: Chemical. 2016;237:643–651. doi: 10.1016/j.snb.2016.06.141. [DOI] [Google Scholar]
- 19.Feng J., Ju Y., Liu J., Zhang H., Chen X. Polyethyleneimine-templated copper nanoclusters via ascorbic acid reduction approach as ferric ion sensor. Analytica Chimica Acta. 2015;854:153–160. doi: 10.1016/j.aca.2014.11.024. [DOI] [PubMed] [Google Scholar]
- 20.Annie Ho J. A., Chang H. C., Su W. T. DOPA-mediated reduction allows the facile synthesis of fluorescent gold nanoclusters for use as sensing probes for ferric ions. Analytical Chemistry. 2012;84(7):3246–3253. doi: 10.1021/ac203362g. [DOI] [PubMed] [Google Scholar]
- 21.Gao X., Lu Y., He S., Li X., Chen W. Colorimetric detection of iron ions (III) based on the highly sensitive plasmonic response of the N-acetyl-l-cysteine-stabilized silver nanoparticles. Analytica Chimica Acta. 2015;879:118–125. doi: 10.1016/j.aca.2015.04.002. [DOI] [PubMed] [Google Scholar]
- 22.Thatai S., Khurana P., Prasad S., Kumar D. A new way in nanosensors: gold nanorods for sensing of Fe(III) ions in aqueous media. Microchemical Journal. 2014;113:77–82. doi: 10.1016/j.microc.2013.11.004. [DOI] [Google Scholar]
- 23.Ananthanarayanan A., Wang X., Routh P., et al. Facile synthesis of graphene quantum dots from 3D graphene and their application for Fe3+sensing. Advanced Functional Materials. 2014;24(20):3021–3026. doi: 10.1002/adfm.201303441. [DOI] [Google Scholar]
- 24.Qu K., Wang J., Ren J., Qu X. Carbon dots prepared by hydrothermal treatment of dopamine as an effective fluorescent sensing platform for the label-free detection of iron(III) ions and dopamine. Chemistry. 2013;19(22):7243–7249. doi: 10.1002/chem.201300042. [DOI] [PubMed] [Google Scholar]
- 25.Zhan J., Wen L., Miao F., Tian D., Zhu X., Li H. Synthesis of a pyridyl-appended calix[4]arene and its application to the modification of silver nanoparticles as an Fe3+ colorimetric sensor. New Journal of Chemistry. 2012;36:656–661. [Google Scholar]
- 26.Wu S.-P., Chen Y.-P., Sung Y.-M. Colorimetric detection of Fe3+ ions using pyrophosphate functionalized gold nanoparticles. Analyst. 2011;136(9):1887–1891. doi: 10.1039/c1an15028f. [DOI] [PubMed] [Google Scholar]
- 27.Guan J., Jiang L., Li J., Yang W. PH-dependent aggregation of histidine-functionalized Au nanoparticles induced by Fe3+ ions. Journal of Physical Chemistry C. 2008;112(9):3267–3271. doi: 10.1021/jp7097763. [DOI] [Google Scholar]
- 28.Mehta V. N., Kailasa S. K., Wu H.-F. Sensitive and selective colorimetric sensing of Fe3+ ion by using p-amino salicylic acid dithiocarbamate functionalized gold nanoparticles. New Journal of Chemistry. 2014;38(4):1503–1511. doi: 10.1039/c3nj01468a. [DOI] [Google Scholar]
- 29.Lee S. J., Koo H., Jeong H., et al. Comparative study of photosensitizer loaded and conjugated glycol chitosan nanoparticles for cancer therapy. Journal of Controlled Release. 2011;152(1):21–29. doi: 10.1016/j.jconrel.2011.03.027. [DOI] [PubMed] [Google Scholar]
- 30.Kim K., Kwon S., Park J. H., et al. Physicochemical characterizations of self-assembled nanoparticles of glycol chitosan-deoxycholic acid conjugates. Biomacromolecules. 2005;6(2):1154–1158. doi: 10.1021/bm049305m. [DOI] [PubMed] [Google Scholar]
- 31.Ji X., Song X., Li J., Bai Y., Yang W., Peng X. Size control of gold nanocrystals in citrate reduction: the third role of citrate. Journal of the American Chemical Society. 2007;129(45):13939–13948. doi: 10.1021/ja074447k. [DOI] [PubMed] [Google Scholar]
- 32.Pong B.-K., Elim H. I., Chong J.-X., Ji W., Trout B. L., Lee J.-Y. New insights on the nanoparticle growth mechanism in the citrate reduction of gold(III) salt: formation of the Au nanowire intermediate and its nonlinear optical properties. Journal of Physical Chemistry C. 2007;111(17):6281–6287. doi: 10.1021/jp068666o. [DOI] [Google Scholar]
- 33.Wagner J., Tshikhudo T. R., Köhler J. M. Microfluidic generation of metal nanoparticles by borohydride reduction. Chemical Engineering Journal. 2008;135(1):S104–S109. doi: 10.1016/j.cej.2007.07.046. [DOI] [Google Scholar]
- 34.Grzelczak M., Pérez-Juste J., Mulvaney P., Liz-Marzán L. M. Shape control in gold nanoparticle synthesis. Chemical Society Reviews. 2008;37(9):1783–1791. doi: 10.1039/b711490g. [DOI] [PubMed] [Google Scholar]
- 35.Briñas R. P., Hu M., Qian L., Lymar E. S., Hainfeld J. F. Gold nanoparticle size controlled by polymeric Au(I) thiolate precursor size. Journal of the American Chemical Society. 2008;130(3):975–982. doi: 10.1021/ja076333e. [DOI] [PMC free article] [PubMed] [Google Scholar]
- 36.Long C., Skoog D. A. A thiocyanate complex of iodine(I) Inorganic Chemistry. 1966;5(2):206–210. doi: 10.1021/ic50036a011. [DOI] [Google Scholar]
- 37.Yu J.-M., Li Y.-J., Qiu L.-Y., Jin Y. Self-aggregated nanoparticles of cholesterol-modified glycol chitosan conjugate: preparation, characterization, and preliminary assessment as a new drug delivery carrier. European Polymer Journal. 2008;44(3):555–565. doi: 10.1016/j.eurpolymj.2008.01.013. [DOI] [Google Scholar]
- 38.López-Pérez P. M., da Silva R. M. P., Serra C., Pashkuleva I., Reis R. L. Surface phosphorylation of chitosan significantly improves osteoblast cell viability, attachment and proliferation. Journal of Materials Chemistry. 2010;20:483–491. [Google Scholar]
- 39.Wei J., Ravn D. B., Gram L., Kingshott P. Stainless steel modified with poly(ethylene glycol) can prevent protein adsorption but not bacterial adhesion. Colloids and Surfaces B: Biointerfaces. 2003;32(4):275–291. doi: 10.1016/S0927-7765(03)00180-2. [DOI] [Google Scholar]
- 40.Yamashita T., Hayes P. Analysis of XPS spectra of Fe2+ and Fe3+ ions in oxide materials. Applied Surface Science. 2008;254(8):2441–2449. doi: 10.1016/j.apsusc.2007.09.063. [DOI] [Google Scholar]
Associated Data
This section collects any data citations, data availability statements, or supplementary materials included in this article.
Supplementary Materials
Fig. S1: (A) Absorption ratios (A700/A510) of GC-AuNPs with 90 μM Fe3+ and 900 μM anions. (B) Absorption ratios (A700/A510) of GC-AuNPs with 90 μM Fe3+ and 900 μM anions in the presence of the masking agent SCN−. Fig. S2: (A) XPS spectra of GC-AuNPs and Fe3+-GC-AuNPs. (B) Fe 2p3/2 signal in Fe3+-GC-AuNPs at 710.6 eV. Fig. S3: Absorbance ratio (A700/A510) as a function of time over 60 min.


