

Abstract
Advanced glycation end-products (AGEs), measured by skin autofluorescence (AF), are a factor in the development or worsening of many degenerative diseases, such as diabetes and atherosclerosis. Irisin levels have been associated with diabetes, endothelial dysfunction and atherosclerosis. The objective of the present study was to investigate whether circulating irisin levels are correlated with skin AF values in type 2 diabetes patients. A total of 362 Chinese type 2 diabetic patients and 100 age- and sex-matched healthy controls were recruited in the present study. Clinical characteristics, blood biochemistry and circulating irisin levels were measured. Skin AF was measured using an AGE reader. Circulating irisin levels were significantly lower, while skin AF values were increased in type 2 diabetes compared with controls (P<0.05 respectively). By dividing the distribution of skin AF values into tertiles, serum irisin levels gradually lowered with increasing skin AF values (P<0.05). After adjusting for covariates, multivariate stepwise regression analysis demonstrated that serum lower irisin levels were independently associated with skin AF (P=0.009). Circulating irisin levels were lower in type 2 diabetes patients compared with healthy controls. Lower levels of irisin are independently associated with elevated skin AF values, indicating that circulating irisin levels could be associated with AGEs accumulation, which is one of the reasons causing vascular complications in diabetic patients.
Keywords: advanced glycation end products, endothelial dysfunction, irisin
Introduction
Advanced glycation end-products (AGEs) are generated via non-enzymatic reactions involving the ketone or aldehyde groups of sugars with the free amino groups of proteins, lipids or nucleic acids. AGEs might be important factors in the development or worsening of many degenerative diseases, such as diabetes, atherosclerosis, chronic renal failure and Alzheimer’s disease [1,2]. Furthermore, the exacerbated production of AGEs is one of the mechanisms of endothelial dysfunction, considered as an early marker of cardiovascular disease and type 2 diabetes [3]. AGEs promote cellular stress responses through the engagement of receptor of AGEs (RAGE). Meerwaldt et al. [4,5] developed and validated a non-invasive technique to quantify tissue AGEs through the measurement of skin autofluorescence (AF). Measuring tissue AGES based on the skin AF might be preferable over plasma measurement, as long-lived proteins accumulate in the tissues in which chronic complications develop [6]. Skin AF, associated with cardiovascular mortality and the degree of atherosclerosis, is elevated in end-stage renal disease, and correlates with carotid intima media thickness (IMT) [7,8].
Irisin, a novel myokine, is proteolytically processed from the product of the fibronectin type III domain containing 5 (FNDC5) gene prior to release into circulation. This protein is regulated through peroxisome proliferator-activated receptor γ (PPAR-γ) coactivator-1(PGC1)-α [9]. Irisin has also been regarded as an anti-inflammatory factor, correlated with diabetes and the severity of insulin resistance [10–12]. It has been reported that circulating irisin levels are positively associated with endothelium-dependent vasodilation (EDV) in newly diagnosed type 2 diabetic patients without clinical angiopathy, indicating that circulating lower irisin levels are tightly associated with endothelial dysfunction and could be a marker for early stage atherosclerosis in type 2 diabetes [13]. Hou et al. [14] reported that circulating lower irisin was independently associated with endothelial dysfunction. Recently, Wang et al. reported that lower irisin levels were associated with urine albumin and flow-mediated arterial dilation. The present study also indicated that lower irisin is associated with endothelial dysfunction and atherosclerosis [15].
In summary, irisin is considered a protective factor for endothelial dysfunction and atherosclerosis, although the reasons for these considerations remain unclear. The exacerbated production of AGEs is one of the mechanisms underlying endothelial dysfunction. In type 2 diabetes, endothelial dysfunction is an important factor in the development of type 2 diabetic vascular complications. We hypothesized that circulating irisin levels are reduced in diabetes patients and this could partly increase the production of AGEs, leading to the development of endothelial dysfunction. The relationship between circulating irisin levels and AGE accumulation in diabetic subjects is currently unknown. Therefore, in the present study, we investigated the relationship between circulating irisin levels and skin AF values in type 2 diabetic patients.
Materials and methods
Study subjects
From March 2013 to December 2014, a total of 362 Chinese type 2 diabetic patients (179 men and 183 women, aged 37–64 years, mean age 50.5 ± 8.3 years), were recruited from the Tianjin Metabolic Diseases Hospital (Tianjin, China). Diabetes was diagnosed according to the World Health Organization (WHO) criteria (1999). Subjects with fasting plasma glucose (FPG) levels ≥ 7.0 mmol/l and 2 h post-load plasma glucose (2 h PG) levels ≥ 11.1 mmol/l were diagnosed with diabetes mellitus. Patients with T1DM, defined by the abrupt onset of symptoms, such as polyuria, polydipsia or unexplained weight loss, ketonuria or a past history of diabetic ketoacidosis, lack of insulin reserve, based on the results of C-peptide assay (fasting: <0.3 pmol/ml; stimulated: <0.6 pmol/ml), and requirement of insulin from the time of diagnosis for the control of hyperglycaemia, were excluded. T2DM was defined as absence of ketosis, good β-cell reserve as shown by C-peptide assay (fasting: ≥0.6 pmol/ml; stimulated: ≥1.6 pmol/ml). The research protocol was approved through the local ethics committee and informed written consent was obtained from each subject. Information, such as age, sex, weight, height, body mass index (BMI), age of onset of diabetes mellitus, fasting glucose levels, physical exercise, other diabetes-associated anomalies and blood pressure, were collected from them on a predesigned questionnaire. During the same period, 100 healthy subjects (all from medical staff in our hospital) were selected as control subjects. Physical exercise was defined as subjects who walked at least 25–30 min a day and at least 3–4 days a week for at least half a year. Subjects who were obese (BMI >30 kg/m2) and those with malignant neoplasms, renal or liver diseases or endocrinological disease other than diabetes were excluded from the study. Also, no patient was taking any drugs, such as antihypertensive drugs (including b-blockers), diabetes medications, oestrogen supplements, thyroxine, diuretics, hypolipidaemic drugs. All subjects enrolled in the study gave informed consents.
Biochemical analysis
The blood samples were obtained after an overnight fast. The concentrations of triglyceride (TG) (Vitros TRIG DTD, Johnson & Johnson, New Brunswick, NJ, U.S.A.), total cholesterol (TC), low-density lipoprotein cholesterol (LDL-C), high-density lipoprotein cholesterol (HDL-C) (Vitros CHOL DTD, Johnson & Johnson) and glucose (Vitros GLU DTD, Johnson & Johnson) were analysed using the Vitros Chemistry DT60 II System (Johnson & Johnson). The serum fasting insulin (Fins) concentration was measured through electrochemiluminescence immunoassay (Roche Elecsys Insulin Assay, Roche Diagnostics, Mannheim, Germany). HOMA-insulin resistance (HOMA-IR) was calculated based on fasting serum insulin (Flns, mU/ml) × fasting blood glucose (FPG, mmol/l)/22.5. Serum irisin concentrations were measured in duplicate using ELISA kits (Aviscera Biosciences, Santa Clara, CA), in accordance with the manufacturer’s instructions. The sensitivity of the assay was 0.2 ng/ml and the linear range of the standard was 5–500 ng/ml. Haemoglobin A1c (HbA1c) was measured through high-performance chromatography. C-reactive protein (CRP) was measured using a particle enhanced immunoturbidimetric assay.
Measurement of skin AF
Skin AF was assessed using an AGE Reader (DiagnOptics Technologies BV, Groningen, the Netherlands). The AGE Reader is a non-invasive desktop device that uses the characteristic fluorescent properties of certain AGEs to estimate the levels of AGE accumulation in the skin. This method has been extensively validated and strongly correlates with individual AGE compounds measured in skin biopsy dermal tissue homogenates obtained from the same site as the skin AF measurement. The AGE Reader illuminates a skin surface of 4 cm2 through an excitation light source with a peak excitation of 370 nm. Emission light (fluorescence in the wavelength of 420–600 nm) and reflected excitation light (with a wavelength of 300–420 nm) from the skin is measured using a spectrometer. The skin AF is calculated as the ratio between the emission light and reflected excitation light, which is multiplied by 100 and expressed in arbitrary units. A series of three consecutive measurements were obtained per minute. The mean skin AF was calculated using these measurements, and this value was used in subsequent analyses. This method is observer-independent and has a 5% intrapatient coefficient of variation.
Statistical analysis
The data are presented as the means ± S.D. or the means ± S.E.M. or median (interquartile range). Unpaired Student’s ttest was used to examine differences in numerical variables between the two groups. The chi-square test was used to compare categorical and nominal variables. Datasets of more than two groups were compared using ANOVA or the Mann–Whitney U test with Tukey’s post hoc analysis. For the univariate analysis of the effects of each potential risk factor on AF, linear regression for continuous variables was performed. The independent association between AF and other independent variables was assessed through multiple stepwise regression analysis. Fins and HOMA-IR concentrations were log transformed prior to analysis. The differences were considered significant for a P value <0.05. All data were analysed using the Statistical Package for Social Sciences (SPSS 18.0 for windows, SPSS Inc., Chicago, IL, U.S.A.).
Results
Clinical characteristics and biochemical parameters of the subjects
The clinical characteristics and biochemical data for the control subjects and diabetic patients are summarized in Table 1. Compared with the control subjects, the values of BMI, HbA1C, TC, TG, LDL-C, CRP, Fins, HOMA-IR and skin AF were significantly increased (P<0.05), whereas the levels of irisin and HDL-C were significantly lowered (P<0.05) in type 2 diabetic patients. As shown, circulating levels of irisin and skin AF have the opposite performance in type 2 diabetic patients.
Table 1. Clinical and biochemical characteristics in control and type 2 diabetes subjects.
| Variables | Controls | Type 2 diabetic patients | P-values |
|---|---|---|---|
| Males/females | 51/49 | 179/183 | |
| Age (years) | 50.8 ± 9.5 | 50.5 ± 8.3 | 0.221 |
| BMI (kg/m2) | 23.9 ± 3.4 | 25.7 ± 3.0 | 0.009 |
| SBP (mmHg) | 120.6 ± 8.1 | 122.3 ± 7.9 | 0.318 |
| DBP (mmHg) | 71.5 ± 5.1 | 72.6 ± 5.8 | 0.231 |
| Physical exercise (n(%)) | 10 (25%) | 37 (22.8%) | 0.311 |
| HbA1c (%) | 5.3 ± 0.5 | 7.7 ± 1.2 | <0.001 |
| TC (mmol/l) | 4.25 ± 0.53 | 5.78 ± 0.67 | <0.001 |
| TG (mmol/l) | 1.38 ± 0.51 | 2.41 ± 0.78 | <0.001 |
| LDL-C (mmol/l) | 2.01 ± 0.36 | 3.57 ± 0.61 | <0.001 |
| HDL-C (mmol/l) | 1.23 ± 0.32 | 1.11±0.31 | 0.038 |
| CRP (mg/l) | 1.21 ± 0.61 | 2.93 ± 0.78 | <0.001 |
| Fins (mU/l) | 9.3 ± 2.4 | 13.4 ± 4.7 | <0.001 |
| HOMA-IR | 2.57 ± 1.36 | 4.47 ± 2.33 | <0.001 |
| Irisin (ng/ml) | 24.35 ± 2.76 | 16.24 ± 5.16 | <0.001 |
| Skin AF (AU) | 1.97 (1.77 – 2.18) | 2.72 (1.74 – 3.71) | <0.001 |
SBP, systolic blood pressure; DBP, diastolic blood pressure.
Circulating irisin concentrations and AF values in type 2 diabetes
The subjects were divided into three groups according to tertiles of AF values (median (interquartile range): 2.06 (1.74–2.38), 2.71 (2.41–3.01), 3.39 (3.08–3.71) respectively). There were no differences in age, gender, BMI, blood pressure, Fins (mU/l) and HOMA-IR among the three different tertile subgroups. Compared with the subjects in the lowest tertile of AF values, the patients in the highest tertile had significantly higher levels of HbA1c, TC, TG, LDL-C and CRP and lower levels of irisin and HDL-C (P for trend <0.05) (Table 2). Moreover, the irisin levels in tertiles 2 and 3 were significantly lower compared with those in tertile 1 after adjustment for age, gender and BMI (Figure 1).
Table 2. Clinical and biochemical characteristics in type 2 diabetic subjects according to the quartiles of skin AF values.
| Variables | Tertiles of skin AF values | P-value | ||
|---|---|---|---|---|
| Tertile 1 | Tertile 2 | Tertile 3 | ||
| n | 120 | 120 | 122 | |
| Age (years) | 50.2 ± 8.5 | 50.7 ± 7.9 | 50.5 ± 8.1 | 0.899 |
| Sex (M/F) | 54/66 | 59/61 | 66/56 | 0.334 |
| Duration of diabetes (years) | 10.3 ± 2.2 | 10.8 ± 2.4 | 10.5 ± 2.3 | 0.879 |
| BMI (kg/m2) | 24.9 ± 3.2 | 25.3 ± 3.1 | 26.2 ± 2.8 | 0.123 |
| SBP (mmHg) | 121.3 ± 7.8 | 123.1 ± 8.1 | 122.1 ± 8.2 | 0.135 |
| DBP (mmHg) | 72.4 ± 5.9 | 73.1 ± 5.4 | 72.3 ± 5.9 | 0.154 |
| HbA1c (%) | 7.1 ± 1.8 | 7.3 ± 1.5 | 8.7 ± 1.1 | 0.031 |
| TC (mmol/l) | 5.47 ± 0.67 | 5.79 ± 0.69 | 6.12 ± 0.71 | <0.001 |
| TG (mmol/l) | 1.68 ± 0.75 | 2.43 ± 0.79 | 3.15 ± 0.74 | <0.001 |
| LDL-C (mmol/l) | 2.97 ± 0.61 | 3.58 ± 0.68 | 4.16 ± 0.59 | <0.001 |
| HDL-C (mmol/l) | 1.12 ± 0.31 | 1.13 ± 0.35 | 1.09 ± 0.34 | 0.059 |
| CRP (mg/l) | 1.76 ± 0.78 | 2.91 ± 0.77 | 4.12 ± 0.74 | <0.001 |
| Fins (mU/l) | 13.7 ± 4.7 | 13.1 ± 4.9 | 13.5 ± 3.9 | 0.326 |
| HOMA-IR | 4.46 ± 2.33 | 4.49 ± 2.38 | 4.50 ± 2.29 | 0.599 |
| Irisin (ng/ml) | 23.59 ± 4.88 | 16.67 ± 5.23 | 8.46 ± 4.16 | <0.001 |
| Skin AF (AU) | 2.06 (1.74 – 2.38) | 2.71 (2.41 – 3.01) | 3.39 (3.08 – 3.71) | <0.001 |
SBP, systolic blood pressure; DBP, diastolic blood pressure.
Figure 1. Correlations of circrlating irisn with skin AF values.
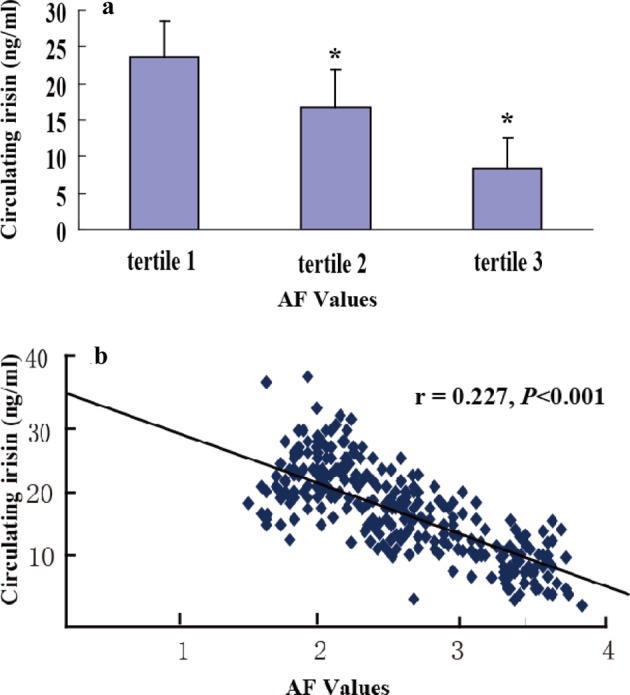
(a) Circulating irisin concentrations in different tertiles of skin AF values in type 2 diabetic patients. Data represent the mean ± S.E.M., *P<0.05 compared with tertile 1. (b) Correlation analysis to evaluate correlation of circulating irisin with AF values in diabetic patients.
Correlation and regression analysis
Univariate analysis showed a negative correlation between AF and circulating irisin (r =0.227, P<0.001), BMI (r = –0.21, P=0.033), systolic blood pressure (SBP) (r = –0.19, P=0.047), TC (r =0.217, P<0.001), LDL-C (r =0.23, P=0.004), TG (r =0.123,P=0.023), CRP (r = –0.31, P<0.001), HbA1c (r =0.251, P<0.001), log-HOMA-IR (r =0.256, P=0.021) and log-Fins (r = –0.260, P<0.001). To evaluate the independent association between AF and other independent variables, a multiple stepwise regression analysis was performed in diabetic patients. In this model, irisin, BMI, SBP, TC, LDL-C, TG, CRP, HbA1C, log-HOMA-IR and log-Fins were entered (forward) at the beginning of the procedure. Of these, irisin, HbA1C, LDL-C, TG and CRP were independently associated with the AF values (all P<0.05) (Table 3).
Table 3. Association of AF values with circulating irisin and biochemical parameters by multivariate stepwise regression analysis.
| Variables | β | S.E.M. | P-values |
|---|---|---|---|
| HbA1C (%) | 0.986 | 0.241 | <0.001 |
| LDL-C (mmol/l) | 0.199 | 0.218 | 0.044 |
| TG (mmol/l) | 0.561 | 0.226 | 0.012 |
| CRP (mg/l) | 0.986 | 0.241 | <0.001 |
| Irisin (ng/ml) | 0.591 | 0.137 | 0.009 |
β, regression coefficient; adjustments for age, sex, BMI, SBP, diastolic blood pressure (DBP), smoking, positive family history and physical activity.
Discussion
The results of the present study showed that circulating irisin levels were lower in type 2 diabetes patients compared with healthy controls. We demonstrated for the first time that lower levels of circulating irisin were independently associated with elevated skin AF, indicating increased AGE accumulation. To our knowledge, this is the first report to show the association of circulating irisin levels with AGE accumulation.
In the present study, we observed that AGE accumulation, based on the skin AF levels in type 2 diabetes patients, was higher than that in healthy controls (P<0.05). After dividing the distribution of skin AF values into tertiles, we observed that HbA1c levels gradually increased with increasing skin AF values (P<0.05), and multiple stepwise regression analysis showed that HbA1c levels were independently associated with AF values (P<0.05). AGEs are a complex and heterogeneous group of compounds implicated in diabetes-related complications. Reducing sugars, such as glucose, react non-enzymatically with amino groups in proteins, lipids and nucleic acids through a series of reactions forming Schiff bases and Amadori products to produce AGE. This process, is also known as the Maillard reaction. The amount of Amadori products is glucose concentration dependent [16]. An increasing number of studies have demonstrated that AGE accumulation leads to the aetiology of diabetic micro- and macrovascular complications [17]. Therefore, the glucose concentrations of blood and tissue contribute to the formation of AGEs and the development of diabetic vascular complications.
Irisin drives the conversion of white adipose tissues into brown fat-like adipose and mediates the beneficial effects of exercise on metabolism [9]. Circulating irisin was significantly reduced in type 2 diabetes patients compared with non-diabetic controls [12,13,18,19]. Here, we showed the same results. The levels of irisin were significantly lower (P<0.05) in type 2 diabetic patients than in control subjects.
Moreover, after dividing the distribution of skin AF values into tertiles, the serum irisin levels were gradually reduced with increasing skin AF values (P<0.05). Multivariate stepwise regression analysis demonstrated that serum reduced irisin levels were independently associated with elevated skin AF after adjusting for covariates (P=0.009). These results suggested that the lower circulating irisin levels might partially contribute to AGE accumulation in type 2 diabetes patients. The pathophysiological significance of the association between irisin and the accumulation of AGEs observed in the present study should be determined in future studies. However, there are some potential mechanisms that might account for this relationship in type 2 diabetes. Firstly, a previous study showed that irisin directly induced glucose and fatty acid uptake in human muscles via the AMPK pathway [20]. The overexpression of this myokine was sufficient to promote energy expenditure and alleviate insulin resistance in a diabetic animal model [9]. Considering the glucose concentrations of blood and tissue contributing to the formation of AGEs, the lower levels of irisin in type 2 diabetes will lead to the accumulation of AGEs. Secondly, Hou et al. [14] reported that circulating irisin was positively correlated with EDV and was independently associated with EDV, potentially reflecting endothelial function and the degree of arteriosclerosis. Similarly, Xiang et al. [13] discovered that circulating irisin levels were positively associated with flow-mediated dilation (FMD), which could detect the degree of EDV. A previous study reported that irisin plays a novel role in sustaining endothelial homoeostasis through the promotion of HUVEC proliferation via the ERK signalling pathway [21]. Therefore, in type 2 diabetes, lower irisin leads to partial endothelial dysfunction and promotes the occurrence of atherosclerosis. Reactive oxygen species (ROS) increased when atherosclerosis occurred. In addition, ROS generates the glycolysis intermediate products, as sources of increased AGE formation,and promote the formation of AGEs [22]. In conclusion, the lower levels of irisin in type 2 diabetes patients lead to AGE accumulation, which aggravates the degree of arteriosclerosis.
There are several limitations of the present study. For example, it would be better to include even larger sample sizes of type 2 diabetes patients. In addition, the correlation between plasma irisin and AGEs accumulation in the present clinical study provides strong evidence concerning the potential role of irisin in metabolic disorders, but does not address the cause–effect relationship in the pathology of angiopathy in type 2 diabetes.
In summary, the results of the present study provide the first clinical evidence supporting the negative correlation between serum irisin concentrations and AGE accumulation based on the levels of skin AF in type 2 diabetes patients. AGE accumulation is one of mechanisms of diabetic vascular complications. Illustration of this mechanism through in vitro and in vivo studies is needed to clarify whether irisin is a protective factor for the development of diabetic complications.
Abbreviations
- AGE
advanced glycation end-product
- AF
skin autofluorescence
- AMPK
AMP-activated protein kinase
- BMI
body mass index
- CRP
C-reactive protein
- EDV
endothelium-dependent vasodilation
- ERK
Extracellar signal regulated kinases
- Fins
fasting insulin
- FPG
fasting plasma glucose
- HbA1c
haemoglobin A1c
- HDL-C
high-density lipoprotein cholesterol
- HOMA-IR
HOMA-insulin resistance
- HOMA
The homeostasis Model Assessment
- HUVEC
Human Umbilical vein endothelial cells
- LDL-C
low-density lipoprotein cholesterol
- ROS
reactive oxygen
- SBP
systolic blood pressure
- T1DM
type 1 diabetes mellitus
- T2DM
type 2 diabetes mellitus
- TC
total cholesterol
- TG
triglyceride
Funding
This work was supported by the National Natural Science Foundation of China [grant number 81670731]; and Tianjin Natural Science Foundation [grant number 14JCYBJC26200].
Competing interests
The authors declare that there are no competing interests associated with the manuscript.
Author contribution
L.-m.C., W.-y.N. and Z.L. conceived and designed the experiments. Z.L., G.W., Y.-j.Z., C.-g.L., Y.-z.T., Z.-h.J., C.-l.N. and M.Y. performed the experiments. Z.L., G.W., Y.-j.Z., C.-l.N. and C.-g.L. analysed the data. Z.L., G.W., Y.-z.T., Z.-h.J. and M.Y. contributed reagents/materials/analysis tools. Z.L., L.-m.C. and W.-y.N. drafted the manuscript.
References
- 1.Vistoli G., De Maddis D., Cipak A., Zarkovic N., Carini M. and Aldini G. (2013) Advanced glycoxidation and lipoxidation end products (AGEs and ALEs): an overview of their mechanisms of formation. Free Radic. Res. 47, 3–27 [DOI] [PubMed] [Google Scholar]
- 2.Bierhaus A., Hofmann M.A., Ziegler R. and Nawroth P.P. (1998) AGEs and their interaction with AGE-receptors in vascular disease and diabetes mellitus. I. theAGE concept. Cardiovasc. Res. 37, 586–600 [DOI] [PubMed] [Google Scholar]
- 3.Nishikawa T., Edelstein D., Du X.L., Yamagishi S., Matsumura T., Kaneda Y. et al. (2000) Normalizing mitochondrial superoxide production blocks three pathways of hyperglycaemic damage. Nature 404, 787–790 [DOI] [PubMed] [Google Scholar]
- 4.Meerwaldt R., Graaff R., Oomen P.H.N., Links T.P., Jager J.J., Alderson N.L. et al. (2004) Simple non-invasive assessment of advanced glycation endproduct accumulation. Diabetologia 47, 1324–1330 [DOI] [PubMed] [Google Scholar]
- 5.Meerwaldt R., Hartog J.W., Graaff R., Huisman R.J., Links T.P., den Hollander N.C. et al. (2005) Skin autofluorescence, a measure of cumulative metabolic stress and advanced glycation end products, predicts mortality in hemodialysis patients. J. Am. Soc. Nephrol. 16, 3687–3693 [DOI] [PubMed] [Google Scholar]
- 6.Meerwaldt R., Links T., Zeebregts C., Tio R., Hillebrands J.L., Smit A. et al. (2008) The clinical relevance of assessing advanced glycation endproducts accumulation in diabetes. Cardiovasc. Diabetol. 7, 29–33 [DOI] [PMC free article] [PubMed] [Google Scholar]
- 7.Lutgers H.L., Graaff R., de Vries R., Smit A.J. and Dullaart R.P. (2010) Carotid artery intima media thickness associates with skin autofluoresence in non-diabetic subjects without clinically manifest cardiovascular disease. Eur. J. Clin. Invest. 40, 812–817 [DOI] [PubMed] [Google Scholar]
- 8.den Dekker M.A., Zwiers M., van den Heuvel E.R., de Vos L.C., Smit A.J., Zeebreqts C.J. et al. (2013) Skin autofluorescence, a non-invasive marker for AGE accumulation, is associated with the degree of atherosclerosis. PLoS ONE 8, e83084. [DOI] [PMC free article] [PubMed] [Google Scholar]
- 9. Boström P., Wu J., Jedrychowski M.P., Korde A., Ye L., Lo J.C. et al. (2012) A PGC1-adependent myokine that drives brown-fat-like development of white fat and thermogenesis. Nature 481, 463–468 [DOI] [PMC free article] [PubMed] [Google Scholar]
- 10.Sanchis-Gomar F. and Perez-Quilis C. (2013) Irisinemia: a novel concept to coin in clinical medicine? Ann. Nutr. Metab. 63, 60–61 [DOI] [PubMed] [Google Scholar]
- 11.Sanchis-Gomar F., Lippi G., Mayero S., Perez-Quilis C. and Garcia-Gimenez J.L. (2012) Irisin: a new potential hormonal target for the treatment of obesity and type 2 diabetes. J. Diabetes 4, 196–201 [DOI] [PubMed] [Google Scholar]
- 12.Liu J.J., Wong M.D., Toy W.C., Tan C.S., Liu S., Ng X.W. et al. (2013) Lower circulating irisin is associated with type 2 diabetes mellitus. J. Diabetes. Complications 27, 365–369 [DOI] [PubMed] [Google Scholar]
- 13.Xiang L., Xiang G., Yue L., Zhang J. and Zhao L. (2014) Circulating irisin levels are positively associated with endothelium-dependent vasodilation in newly diagnosed type 2 diabetic patients without clinical angiopathy. Atherosclerosis 235, 328–333 [DOI] [PubMed] [Google Scholar]
- 14.Hou N., Han F. and Sun X. (2014) The relationship between circulating irisin levels and endothelial function in lean and obese subjects. Clin. Endocrinol. (Oxf.) 83, 339–343 [DOI] [PubMed] [Google Scholar]
- 15.Wang H.H., Zhang X.W., Chen W.K., Huang Q.X. and Chen Q.Q. (2015) Relationship between serum irisin levels and urinary albumin excretion in patients with type 2 diabetes. J. Diabetes Complications 29, 384–389 [DOI] [PubMed] [Google Scholar]
- 16.Furth A.J. (1997) Glycated proteins in diabetes. Br. J. Biomed. Sci. 54, 192–2000 [PubMed] [Google Scholar]
- 17.Chiarelli F., de Martino M., Mezzetti A., Catino M., Morgese G., Cucurullo F. et al. (1999) Advanced glycation end-products in children and adolescents with diabetes mellitus: relation to glycaemic control and early microvascular complications. J. Pediatr. 34, 486–491 [DOI] [PubMed] [Google Scholar]
- 18.Hojlund K. and Bostrom P. (2013) Irisin in obesity and type 2 diabetes. J. Diabetes Complications 27, 303–304 [DOI] [PubMed] [Google Scholar]
- 19.Choi Y.K., Kim M.K., Bae K.H., Seo H.A., Jeong J.Y., Lee W.K. et al. (2013) Serum irisin levels in new-onset type 2 diabetes. Diabetes Res. Clin. Pract. 100, 96–101 [DOI] [PubMed] [Google Scholar]
- 20.Huh J.Y., Mouqios V., Kabasakalis A., Fatouros I., Siopi A., Douroudos I.I. et al. (2014) Exercise-induced irisin secretion is independent of age or fitness level and increased irisin may directly modulate muscle metabolism through AMPK activation. J. Clin. Endocrinol. Metab. 99, E2154–E2161 [DOI] [PubMed] [Google Scholar]
- 21.Song H., Wu F., Zhang Y., Zhang Y., Wang F., Jiang M. et al. (2014) Irisin promotes human umbilical vein endothelial cell proliferation through the ERK signaling pathway and partly suppresses high glucose-induced apoptosis. PLoS ONE 9, e110273. [DOI] [PMC free article] [PubMed] [Google Scholar]
- 22.Renard C., Chappey O., Wautier M.P., Nagashima M., Lundh E., Morser J. et al. (1997) Recombinant advanced glycation end product receptor pharmacokinetics in normal and diabetic rats. Mol. Phannacol. 52, 54–62 [DOI] [PubMed] [Google Scholar]