SUMMARY
OBJECTIVE
To examine whether a lipoarabinomannan (LAM) enzyme-linked immunosorbent assay (ELISA) that offers diagnostic utility using urine in patients with tuberculosis (TB) and human immunodeficiency virus (HIV) co-infection can be used in induced sputum to diagnose sputum-scarce patients with suspected TB.
DESIGN
LAM was measured in induced sputum samples obtained from 61 consecutively recruited sputum-scarce TB suspects in a tertiary hospital respiratory clinic in South Africa. Liquid culture positivity for Mycobacterium tuberculosis was used as the reference standard. Receiver operating characteristic analysis was used to assess alternative LAM concentration cut-offs.
RESULTS
A total of 87% (53/61) of study patients had a valid M. tuberculosis culture result; 49% (23/53) were HIV-infected and 17% (9/53) were culture-positive for M. tuberculosis. Induced sputum smear microscopy and LAM ELISA had an overall sensitivity of 56% (95%CI 27–81); however, the specificity of LAM ELISA was 48% (95%CI 34–62), while the positive and negative predictive values were respectively 18% (95%CI 8–36) and 84% (95%CI 65–94). An optimal rule-in cut-off selected by receiver operating characteristic (LAM concentration > 5.73 ng/ml) increased test specificity to 98% and reduced sensitivity to 22%. Normalisation of the assay for sample total protein or cell count did not improve diagnostic accuracy.
CONCLUSIONS
In this proof-of-concept study, the ELISA was not clinically useful for TB diagnosis using induced sputum.
Keywords: ELISA, detection, infectious disease
TUBERCULOSIS (TB) kills 1.8 million people annually and is the leading cause of human immunodeficiency virus (HIV) related deaths in sub-Saharan Africa.1 TB diagnosis is challenging, and current diagnostic tools are inadequate. Clinical disease presentation and radiological manifestations can be atypical, particularly in HIV-co-infected patients. Available TB diagnostic tools perform suboptimally in high HIV prevalent settings, with sensitivity of smear microscopy as low as 20%.2 Newer molecular diagnostic technologies, such as the Xpert® MTB/RIF assay (Cepheid, Sunnyvale, CA, USA), appear promising, but are untested in sputum-scarce individuals and remain expensive and unavailable in most high-burden settings.3 There is an urgent need, therefore, particularly among HIV-co-infected patients, for a rapid and less expensive TB test suited to resource-poor settings.
Lipoarabinomannan (LAM) is a 17.5 kDa lipopolysaccharide and immunogenic mycobacterial cell wall antigen.4 It is a heat-stable antigen released from active and degrading Mycobacterium tuberculosis.5 A commercially available LAM enzyme-linked immunosorbent assay (ELISA; TB LAM ELISA, Alere, Waltham, MA, USA) was designed for the detection of LAM using urine as the target biological sample. Its low cost and recent availability as a point-of-care lateral flow strip test make it particularly appealing for use in high-burden, resource-limited settings.6 It has been shown to be a useful rule-in diagnostic test for TB using urine from HIV-infected patients with advanced immunosuppression.7
The performance of the TB LAM ELISA has been evaluated in a number of non-urine biological samples such as serum samples,8,9 pleural fluid10 and cerebrospinal fluid,11 and found to offer limited clinical utility. We have recently studied the utility of the TB LAM ELISA using expectorated sputum and found good sensitivity (86%) but poor specificity (15%). We demonstrated that the poor test specificity was likely due to cross-reactivity with LAM or LAM-like molecules found in oral mouth flora of TB suspects.12 We therefore hypothesised that improving sputum quality by sampling the lower respiratory tract using induced sputum after mouth rinsing could potentially reduce oropharyngeal contamination, thereby improving assay specificity and offering potential clinical utility for the diagnostically challenging sputum-scarce patient with suspected TB.
PATIENTS AND METHODS
Study participants and induced sputum sampling
Between March 2008 and April 2009, 61 study participants aged > 18 years were consecutively recruited from the respiratory clinic at Groote Schuur Hospital (GSH) in Cape Town, South Africa. Patients presenting to the respiratory clinic with symptoms suggestive of pulmonary TB and an inability to expectorate sputum were eligible for enrolment. Figure 1 shows the study outline.
Figure 1.
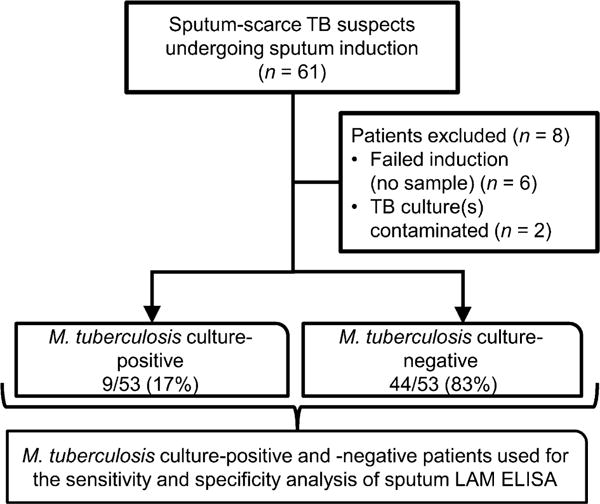
Study flow diagram outlining patient groups used for assessment of diagnostic accuracy. TB = tuberculosis; LAM = lipoarabinomannan; ELISA = enzyme-linked immunosorbent assay.
Induced sputum samples were collected from patients for LAM detection using a standardised induction protocol described previously.13 Patients were required to rinse their mouths with water before nebulisation. An aliquot of the induced sputum was sent for simultaneous microbiological smear and liquid culture. A laboratory technician assessed the quality of every fifth induced sputum sample using the Bartlett scoring system.14
Ethical approval was obtained from the Health Science Faculty Research Ethics Committee of the University of Cape Town (REC number 421/2006). Each patient gave written informed consent prior to participation in the study.
LAM measurement in induced sputum
All induced sputum samples were processed within 2 h of collection. Induced sputum samples were liquefied by adding 2 × volume of 0.1% dithiothreitol and rolling for 20 min at room temperature to homogenise. An aliquot was removed for smear microscopy and liquid culture before filtering the sample through 2-ply sterile 50 μm gauze and centrifugal washing with phosphate buffered saline (PBS) at 1200 rpm; 15 ml of the non-cellular fraction was collected. It was then heated at 95°C for 30 min, and centrifuged at 12 500 rpm for 30 min. Two × 1.5 ml aliquots of supernatant were frozen at −20°C prior to batched LAM ELISA testing.
The induced sputum supernatants were thawed and processed using the TB LAM ELISA kit according to the manufacturer’s instructions. The plates were read immediately at 450 nm on an ELISA plate reader (Anthos Labtec HT3, Wals/Salzburg, Austria). Positive and negative controls were run in duplicate. Average optical density (OD) readings from duplicate samples normalised to the negative control OD were generated.
Normalisation experiments
Given the variable nature of induced sputum samples and the fact that the LAM ELISA has been standardised only for use in urine, we explored the impact of normalisation to sputum sample total protein and cellular content. The BioRad Protein Assay Kit II, 500-0002 (Bio-Rad Laboratories, Hercules, CA, USA) was used according to the manufacturer’s instructions for the calculation of protein content.
Data analyses
Liquid TB culture on induced sputum samples was used as the reference standard. In addition, an alternative analysis using a composite reference standard was performed (see Appendix*). Test sensitivity, specificity, and positive (PPV) and negative predictive values (NPV) were calculated with 95%CI. Receiver operating characteristic (ROC) curve analysis was used to assess alternative cut-off points for optimising ‘rulein’ test utility. Stata version 10 (Stata Corp, College Station, TX, USA) was used for all statistical analyses. GraphPad Prism (version 4, San Diego, CA, USA, http://www.graphpad.com) was used for graphs and figures.
RESULTS
Patient demographic and sample characteristics
Figure 1 provides an outline of the enrolled patients: 13% (8/61) of the patients did not have a valid/available liquid TB culture result and were excluded from the analysis. Of the 53 patients with valid M. tuberculosis culture results, respectively 17% (9/53) and 83% (44/53) were M. tuberculosis culture-positive and -negative. The demographic characteristics are shown in Table 1. A total of 44% (23/53) of the individuals were HIV-infected. In the M. tuberculosis culture-positive group, 33% (3/9) were HIV-infected compared to 45% (20/44) in the M. tuberculosis c ulture-negative group (P = 0.5). Of all induced sputum samples assessed by an independent laboratory technician of the National Health Laboratory Service, 68% were found to be adequate (Bartlett score ≥ 0).
Table 1.
Demographics of study participants stratified by M. tuberculosis culture status
| Patient characteristic |
All (N = 53) n/N (%) |
M. tuberculosis culture-positive* (n = 9) n/N (%) |
M. tuberculosis culture-negative* (n = 44) n/N (%) |
|---|---|---|---|
| Age, years, mean [SD] | 42 [27–57] | 43 [25–61] | 42 [28–56] |
| Female sex | 30 (57) | 3 (33) | 27 (61) |
| Race | |||
| Black African | 26 (49) | 5 (56) | 21 (48) |
| Mixed ancestry | 27 (51) | 4 (44) | 23 (52) |
| HIV status | |||
| Positive | 23 (44) | 3 (33) | 20 (45) |
| Unknown | 1 (2) | 0 | 1 (3) |
| Previous TB† | 17/35 (49) | 3/6 (50) | 14/29 (48) |
| AFB smear positivity | 5 (9) | 5 (56) | 0 |
No significant differences were found for any of the demographic details between M. tuberculosis culture-positive vs. -negative patients.
Data unavailable for 18 patients.
SD = standard deviation; HIV = human immunodeficiency virus; TB = tuberculosis; AFB = acid-fast bacilli.
Performance of smear microscopy and sputum LAM ELISA
Table 2 shows the diagnostic accuracy measures of induced sputum smear microscopy and LAM ELISA alone or in combination. The manufacturer’s predefined cut-off for LAM positivity (a positive test result corresponding to a LAM concentration > 0 ng/ml) was used. The sensitivity of both induced sputum smear microscopy and LAM ELISA was 56% (95%CI 27–81). However, the specificity of smear microscopy was 100% (95%CI 92–100) compared to only 48% (95%CI 34–62) for induced sputum LAM ELISA (P < 0.001). At the study TB prevalence of 17%, the PPV and NPV of the LAM ELISA were respectively 18% (95%CI 8–36) and 84% (95%CI 21–25). Combining induced sputum smear with LAM, improved sensitivity (smear and LAM 78% [95%CI 45–94] vs. smear or LAM alone 56% [95%CI 27–81], P = 0.3). In a secondary analysis (Appendix) where clinical (probable) TB patients were excluded from the M. tuberculosis culture-negative group, the specificity of induced sputum LAM ELISA did not improve.
Table 2.
Diagnostic accuracy of sputum smear microscopy and LAM ELISA alone and in combination for sputum-scarce patients undergoing sputum induction
|
M. tuberculosis culture-positive vs. -negative (n = 53)
|
||||
|---|---|---|---|---|
| Diagnostic test(s) | Sensitivity n/N, % (95%CI) |
Specificity n/N, % (95%CI) |
PPV n/N, % (95%CI) |
NPV n/N, % (95%CI) |
| Sputum smear microscopy | 5/9, 56 (27–81) | 44/44, 100 (92–100) | 5/5, 100 (57–100) | 44/48, 92 (81–97) |
| Sputum LAM ELISA | 5/9, 56 (27–81) | 21/44, 48 (34–62) | 5/28, 18 (8–36) | 21/25, 84 (65–94) |
| Sputum LAM ELISA in smear-negative patients | 2/4, 50 (15–85) | NA | NA | NA |
| Combined sputum smear microscopy and LAM ELISA | 7/9, 78 (45–94) | 21/44, 48 (34–62) | 7/30, 23 (12–41) | 21/23, 91 (73–98) |
LAM = lipoarabinomannan; ELISA = enzyme-linked immunosorbent assay; CI = confidence interval; PPV = positive predictive value; NPV = negative predictive value; NA = not available.
ROC analysis and effects of different LAM concentration cut-points
Figure 2 illustrates LAM concentration (ng/ml) for M. tuberculosis culture-positive and -negative patients. Median LAM concentration was respectively 0.352 ng/ml (interquartile range [IQR] 0.0–3.34) and 0.14 ng/ml (IQR 0.0–1.31) in the M. tuberculosis culture-positive and -negative groups (P = 0.68). Figure 3 shows the ROC for induced sputum LAM ELISA (area under the curve = 0.5442) and illustrates test sensitivity and specificity values for a rule-out, Youden’s index and rule-in LAM concentration cut-off.
Figure 2.
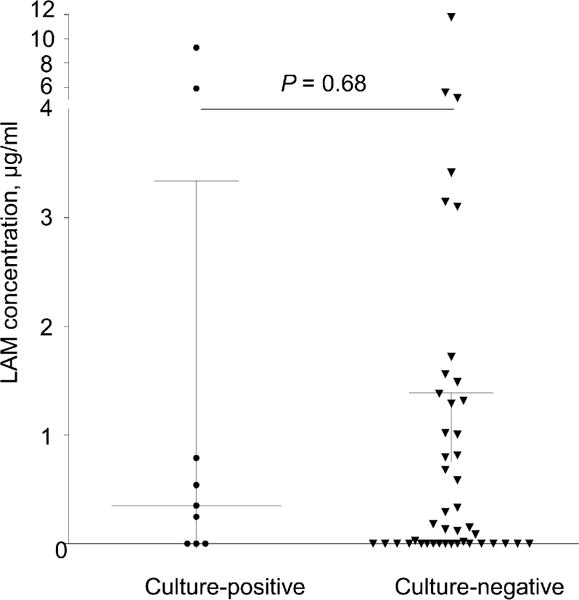
Two-way scatter plot of induced sputum LAM concentrations (ng/ml) in M. tuberculosis culture-positive vs. negative sputum-scarce patients. Median (IQR) LAM concentrations are illustrated. According to the manufacturer, any LAM concentration > 0 ng/ml is considered to be a positive test. LAM = lipoarabinomannan; IQR = interquartile range.
Figure 3.
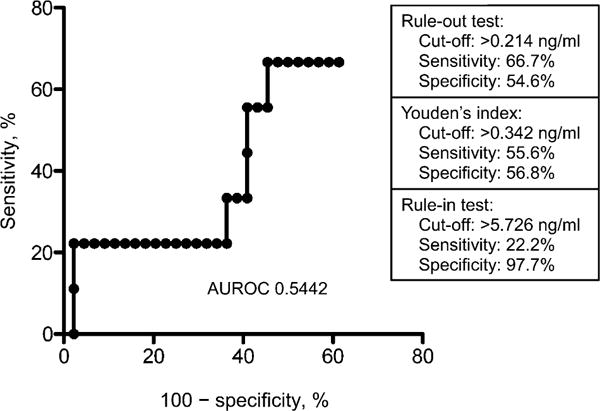
ROC for sputum LAM ELISA and diagnostic accuracy measures (sensitivity and specificity) for different LAM concentration cut-points. AUROC = area under ROC; ROC = receiver operating characteristic; LAM = lipoarabinomannan; ELISA = enzyme-linked immunosorbent assay.
Normalisation of LAM for protein concentration and total cell count
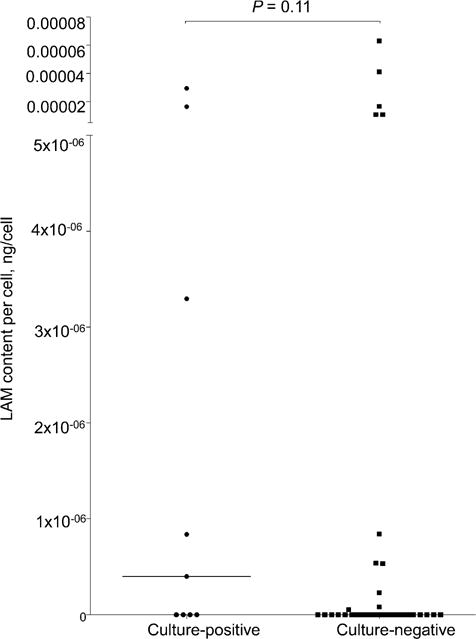
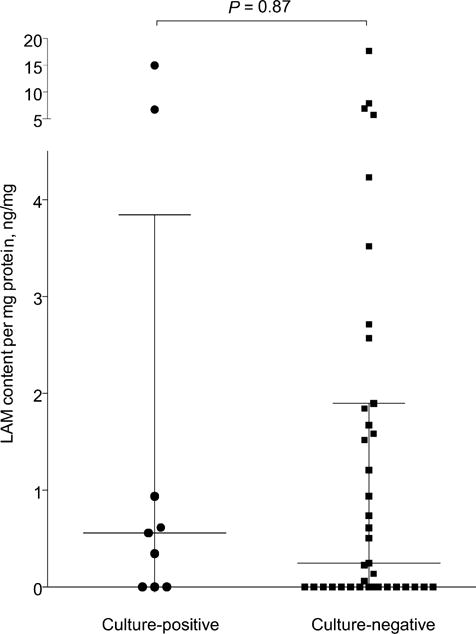
When normalised for total protein content, the median value of LAM concentration per mg sample protein was respectively 0.558 ng/mg (IQR 0.0–3.845) and 0.245 ng/mg (IQR 0.0–1.90) in the M. tuberculosis culture-positive and -negative groups (P = 0.87). Similarly, when the LAM concentration was normalised for the total number of cells, the median value of LAM concentration per cell was respectively 4.0 × 10⁷ ng/cell (IQR 0.0–9.84 × 10⁶) and 0.0 ng/cell (IQR 0.0–8.11 × 10⁸) in the M. tuberculosis culture-positive and -negative groups (P = 0.11). Detailed two-way scatter plots for normalisation experiments can be found in the Appendix.
DISCUSSION
In this proof-of-concept study, we have evaluated the performance of induced sputum LAM to potentially enhance the rapid identification of TB in the diagnostically challenging sputum-scarce patients with suspected TB. The key findings of our study were the following: 1) using the manufacturer’s suggested cut-off, induced sputum LAM ELISA had suboptimal sensitivity and specificity and offers limited potential clinical utility in its current format; and 2) using ROC-selected alternative cut-offs and/or normalisation for total sample protein or cell count was unable to improve test performance sufficiently to improve clinical utility.
We have previously shown that several organisms, such as Candida, Nocardia and Actinomycetes species (all isolated from oral flora) show cross-reactivity with the polyclonal LAM antibodies used in the currently available TB LAM ELISA.15 Nevertheless, sputum LAM ELISA showed excellent overall sensitivity when used on expectorated sputum samples, and identifying methods to improve specificity and target diagnostically challenging patient subgroups, such as sputum-scarce patients, warranted further evaluation. Given the superior quality of induced sputum samples with possible reduced oral floral contamination, as well as the need for sputum acquisition methods for sputum-scarce TB suspects, we hypothesised that induced sputum LAM ELISA may offer clinical utility, and in particular improved specificity. Indeed, the specificity of induced sputum LAM ELISA did improve in induced sputum samples compared to expectorated sputum (48% vs. 15%);15 however, the improvement was unfortunately modest. Bartlett score evaluation of the induced sputum samples found only a 68% sputum adequacy, and it is therefore likely that a number of induced sputum samples still contained significant cross-reacting upper airway microorganisms. It is also plausible that simple passage through the oral cavity may be sufficient for substantial oral flora cross-contamination to occur, thereby limiting the specificity of sputum LAM, irrespective of sputum sample type or quality. Despite this modest improvement in test specificity, the sensitivity of LAM ELISA was only 56% when using induced sputum samples in sputum-scarce patients with suspected TB. This sensitivity was equivalent to sputum smear microscopy.
Why was the sensitivity of induced sputum LAM decreased compared to previous study findings using expectorated sputum samples? The reduced sensitivity may be attributed to a number of factors: 1) patients recruited to this study were sputum-scarce and thus more likely to have paucibacillary pulmonary disease, although 56% of M. tuberculosis culture-positive patients were smear-positive; 2) induced sputum samples differ in their physical and chemical properties compared to expectorated samples, although normalisation for protein content and total cell count failed to improve test performance; and 3) sample processing methods differed between studies. The effect of homogenisation and digestion of mucins and debris on the target antigen as well as the impact of filtration is unknown. In this study, the induced sputum was centrifuged and filtered through 2-ply sterile gauze and the non-cellular fraction drawn off before heating, whereas our previous protocol placed the sputum sample directly into the heated water bath. Mucin in the lungs contain charged and glycosylated proteins which could potentially bind mycobacterial LAM within mucus plugs, making them unavailable for binding on the ELISA plate.16 Glycosylated proteins may thus remove LAM caught in mucus globules during filtration, thereby reducing assay sensitivity. Sensitivity may be further reduced by LAM-anti-LAM complexes forming between LAM and immunoglobulins.7 It is possible that the polyclonal antibodies fail to recognise the LAM molecules in sputum when it is already complexed with human anti-LAM antibodies. The efficacy of the heating step in dissociating the LAM from antibody in these complexes is unknown. Finally, it should be borne in mind that the kit is optimised for urine and not other biological samples.
Our study had a number of important limitations. This proof-of-concept study had a small sample size, with only nine M. tuberculosis culture-positive patients. Statistical power was thus lower (e.g., when comparing combinations of tests), and CIs around sensitivity estimates were wide. Given the limitations of liquid TB culture as the reference standard, particularly in sputum-scarce TB patients, misclassification bias in our primary analysis may have led to an underestimation of test specificity. However, we have presented a secondary analysis in the Appendix, where probable TB patients are excluded from the culture-negative group, and the conclusions remain the same. Finally, the use of induced vs. expectorated sputum samples, together with differences in sputum processing methodology, means that comparisons with previous studies should be interpreted with caution.
In conclusion, the diagnostic accuracy of the TB LAM ELISA assay in its current format using induced sputum samples for the diagnosis of sputum-scarce TB offers little potential clinical utility. Studies are now required to optimise sputum processing methods for TB antigen detection and to develop monoclonal antibodies and other detection technologies more specific for M. tuberculosis LAM.
Acknowledgments
The authors are grateful to Sister Cooper and the Groote Schuur Hospital Respiratory clinic nursing staff, H Chordnum and D Siganga, for their assistance with subject recruitment. This study was supported by the National Research Foundation and a TBSusgent grant from the European Commission (EU-FP7). JP is supported by a SATBAT award, a Discovery Foundation Fellowship, a Fogarty International Clinical Research Scholars/Fellows Support Centre National Institutes of Health grant (R24TW007988) and the European and Developing Countries Clinical Trials Partnership (EDCTP). K Dheda is supported by a TBSusgent grant from the European Commission (EU-FP7), the EDCTP, a South African Medical Research Council Career Development award, a Canadian Institutes of Health Research award, and a National Research Foundation/ SARChI (South African Research Chairs Initiative) award. The funders had no role in study design, data collection and analysis, decision to publish, or preparation of the manuscript.
APPENDIX
Alternative analytical approach using composite reference standard
Given the known limitations of liquid tuberculosis (TB) as a reference standard, a composite reference standard was used to categorise patients for a secondary analysis. Patients were categorised into the following diagnostic groups based on a combination of smear and culture results, clinic radiographic findings and the initiation of anti-tuberculosis treatment. Essentially, in this analysis, the clinical (probable TB) patients are excluded from the culture-negative group.
Tuberculosis case definitions
Patients were categorised according to microbiological, clinical and radiological criteria as previously outlined.9 The categories were as follows:
Definite TB: a clinical presentation compatible with TB with at least one positive culture (from any recent specimen) for M. tuberculosis.
Probable TB: a clinical-radiological picture highly suggestive of TB and/or anti-tuberculosis treatment initiated by the attending clinician based on clinical suspension, but not meeting the abovementioned criteria for definite TB.
Non-TB: no evidence of TB based on smear microscopy and culture, and no radiological evidence to support the diagnosis of active TB, with or without an alternative diagnosis being established on patient follow-up.
Indeterminate TB: either the culture or chest X-ray results (or both) were unavailable, and the patient was lost to follow-up or transferred to another centre, thus making it impossible to confidently rule-out or rule-in TB. These patients were excluded from the analysis.
Figure A1.
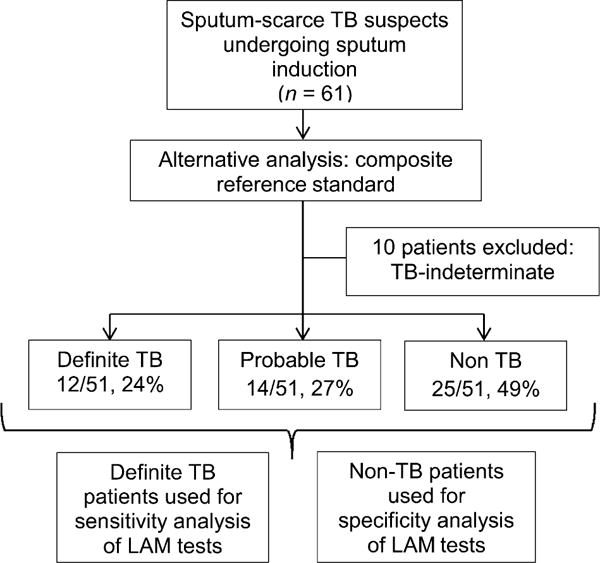
Alternative analysis study flow diagram. Patients classified according to composite reference standard outlined in Appendix text. TB = tuberculosis.
Figure A1 outlines patient groups used for the secondary analysis, and diagnostic accuracy measures are presented in Table A. In addition, Figures A2 and A3 show details of LAM normalisation for total protein and cell counts.
Table A.
Diagnostic accuracy of sputum smear microscopy and LAM ELISA alone and in combination for sputum-scarce patients undergoing induced sputum using composite reference standard*
| Composite reference standard (n = 37)
|
||||
|---|---|---|---|---|
| Diagnostic test(s) | Sensitivity n/N, % (95%CI) |
Specificity n/N, % (95%CI) |
PPV n/N, % (95%CI) |
NPV n/N, % (95%CI) |
| Sputum smear microscopy | 5/12, 42† (19–68) | 25/25, 100 (87–100) | 5/5, 100 (57–100) | 25/32, 78 (61–89) |
| Sputum LAM ELISA | 8/12, 67 (39–86) | 11/25, 44 (27–63) | 8/22, 36 (20–57) | 11/15, 73 (48–89) |
| Sputum LAM ELISA in smear-negative patients | 5/7, 71 (36–92) | NA | NA | NA |
| Combined sputum smear microscopy and LAM ELISA | 10/12, 83† (55–95) | 11/25, 44 (27–63) | 10/24, 42 (25–61) | 11/13, 85 (58–96) |
Only definite and non-TB patients included in the analysis (excludes 10 indeterminate and 14 probable TB patients).
Indicates P < 0.05 for a comparison of the specific measures of diagnostic accuracy between different tests, e.g., LAM ELISA or combinations thereof (smear and LAM); specific P value: P = 0.04; non-significant P values not shown.
LAM = lipoarabinomannan; ELISA = enzyme-linked immunosorbent assay; PPV = positive predictive value; NPV = negative predictive value; CI = confidence interval; TB = tuberculosis.
Figure A2.
Normalisation experiments for sputum LAM to attempt to improve discriminatory performance. Induced sputum LAM concentrations (ng/ml) normalised for sample protein concentration (mg/ml). LAM content per mg protein (ng/mg) in M. tuberculosis culture-positive vs. -negative patients with medians and interquartile range indicated. LAM = lipoarabinomannan.
Figure A3.
Induced sputum LAM concentrations (ng/ml) normalised for total number of mononuclear cells in sample. LAM content in ng per cell in M. tuberculosis culture positive vs. negative patients (medians only indicated). LAM = lipoarabinomannan.
Footnotes
The Appendix is available in the online version of this article at http://www.ingentaconnect.com/content/iuatld/ijtld/2012/00000016/00000008/art00022
References
- 1.World Health Organization. Global tuberculosis control: surveillance, planning, financing. Geneva, Switzerland: WHO; 2008. (WHO report 2008). WHO/HTM/TB/2008.393. [Google Scholar]
- 2.Getahun H, Harrington M, O’Brien R, Nunn P. Diagnosis of smear-negative pulmonary tuberculosis in people with HIV infection or AIDS in resource-constrained settings: informing urgent policy changes. Lancet. 2007;369:2042–2049. doi: 10.1016/S0140-6736(07)60284-0. [DOI] [PubMed] [Google Scholar]
- 3.Boehme CC, Nabeta P, Hillemann D, et al. Rapid molecular detection of tuberculosis and rifampin resistance. N Engl J Med. 2010;363:1005–1015. doi: 10.1056/NEJMoa0907847. [DOI] [PMC free article] [PubMed] [Google Scholar]
- 4.Mishra AK, Driessen NN, Appelmelk BJ, Besra GS. Lipoarabinomannan and related glycoconjugates: structure, biogenesis and role in Mycobacterium tuberculosis physiology and host-pathogen interaction. FEMS Microbiol Rev. 2011;35:1126–1157. doi: 10.1111/j.1574-6976.2011.00276.x. [DOI] [PMC free article] [PubMed] [Google Scholar]
- 5.Tessema TA, Hamasur B, Bjun G, Svenson S, Bjorvatn B. Diagnostic evaluation of urinary lipoarabinomannan at an Ethiopian tuberculosis centre. Scand J Infect Dis. 2001;33:279–284. doi: 10.1080/003655401300077306. [DOI] [PubMed] [Google Scholar]
- 6.Peter J, Green C, Hoelscher M, Mwaba P, Zumla A, Dheda K. Urine for the diagnosis of tuberculosis: current approaches, clinical applicability, and new developments. Curr Opin Pulm Med. 2010;16:262–270. doi: 10.1097/MCP.0b013e328337f23a. [DOI] [PMC free article] [PubMed] [Google Scholar]
- 7.Peter JG, Theron G, van Zyl-Smit R, et al. Diagnostic accuracy of a urine LAM strip-test for TB detection in HIV-infected hospitalized patients. Eur Respir J. 2012 Feb 23; doi: 10.1183/09031936.00201711. [epub ahead of print] [DOI] [PMC free article] [PubMed] [Google Scholar]
- 8.Tessema TA, Bjune G, Hamasur B, Svenson S, Syre H, Bjorvatn B. Circulating antibodies to lipoarabinomannan in relation to sputum microscopy, clinical features and urinary antilipoarabinomannan detection in pulmonary tuberculosis. Scand J Infect Dis. 2002;34:97–103. doi: 10.1080/00365540110077263. [DOI] [PubMed] [Google Scholar]
- 9.Sada E, Brennan PJ, Herrera T, Torres M. Evaluation of lipoarabinomannan for the serological diagnosis of tuberculosis. J Clin Microbiol. 1990;28:2587–2590. doi: 10.1128/jcm.28.12.2587-2590.1990. [DOI] [PMC free article] [PubMed] [Google Scholar]
- 10.Dheda K, van-Zyl Smit RN, Sechi LA, et al. Clinical diagnostic utility of IP-10 and LAM antigen levels for the diagnosis of tuberculous pleural effusions in a high burden setting. PLoS One. 2009;4:e4689. doi: 10.1371/journal.pone.0004689. [DOI] [PMC free article] [PubMed] [Google Scholar]
- 11.Patel VB, Bhigjee AI, Paruk HF, et al. Utility of a novel lipoarabinomannan assay for the diagnosis of tuberculous meningitis in a resource-poor high-HIV prevalence setting. Cerebrospinal Fluid Res. 2009;6:13. doi: 10.1186/1743-8454-6-13. [DOI] [PMC free article] [PubMed] [Google Scholar]
- 12.Theron G, Peter J, van Zyl-Smit R, et al. Evaluation of the Xpert® MTB/RIF assay for the diagnosis of pulmonary tuberculosis in a high HIV prevalence setting. Am J Respir Crit Care Med. 2011;184:132–140. doi: 10.1164/rccm.201101-0056OC. [DOI] [PubMed] [Google Scholar]
- 13.Cashmore TJ, Peter JG, van Zyl-Smit RN, et al. Feasibility and diagnostic utility of antigen-specific interferon-gamma responses for rapid immunodiagnosis of tuberculosis using induced sputum. PLoS One. 2010;5:e10389. doi: 10.1371/journal.pone.0010389. [DOI] [PMC free article] [PubMed] [Google Scholar]
- 14.Bartlett RC. Medical microbiology: quality, cost, and clinical relevance. New York, NY, USA: John Wiley & Sons; 1974. [Google Scholar]
- 15.Dheda K, Davids V, Lenders L, et al. Clinical utility of a commercial LAM-ELISA assay for TB diagnosis in HIV-infected patients using urine and sputum samples. PLoS One. 2010;5:e9848. doi: 10.1371/journal.pone.0009848. [DOI] [PMC free article] [PubMed] [Google Scholar]
- 16.Mall AS, McLeod HA, Hickman R, Kahn D, Dent DM. Fragmentation pattern of mucins in normal and diseased gastric mucosae: a glycoprotein fractionates with gastric mucins purified from mucosal scrapings of cancer and peptic ulcer patients. Digestion. 1999;60:216–226. doi: 10.1159/000007662. [DOI] [PubMed] [Google Scholar]


