

Abstract
(R)‐ α ‐lipoic acid (ALA), an essential cofactor in mitochondrial respiration and a potential antioxidant, possesses a wide array of metabolic benefits including anti‐obesity, glucose lowering, insulin‐sensitizing, and lipid‐lowering effects. In this study, the curative effects of ALA (100 mg/kg) on a spectrum of conditions related to metabolic syndrome and type 2 diabetes (T2D) were investigated in a high‐fat diet (HFD)‐fed and low‐dose streptozotocin (STZ)‐induced rat model of metabolic syndrome and T2D. The marked rise in the levels of glucose, triglycerides, total‐cholesterol, LDL‐cholesterol, and VLDL‐cholesterol in the blood of HFD‐fed and low‐dose STZ‐injected rats were significantly reduced by ALA treatment. Furthermore, ALA treatment significantly increased the serum HDL‐cholesterol levels and tended to inhibit diabetes‐induced weight reduction. Mathematical computational analysis revealed that ALA also significantly improved insulin sensitivity and reduced the risk of atherosclerotic lesions and coronary atherogenesis. This study provides scientific evidence to substantiate the use of ALA to mitigate the glucose and lipid abnormality in metabolic syndrome and T2D.
Keywords: (R)‐ α ‐lipoic acid, high‐fat diet, hyperglycemia, hyperlipidemia, metabolic syndrome, streptozotocin, type 2 diabetes
Abbreviations
- ACOX
acyl‐CoA oxidase
- AI
atherogenic index
- ALAα
(R)‐ α ‐lipoic acid
- AMPK
adenosine monophosphate activated protein kinase
- ATGL
adipose triacylglycerol lipase
- CRI
coronary risk index
- DHLA
dihydrolipoic acid
- FAS
fatty acid synthase
- GDH
glucose dehydrogenase
- GLUTs
glucose transporters
- GPO
glycerol‐phosphate oxidase
- HDL
high‐density lipoprotein
- HFD
high‐fat diet
- LCAT
lecithin cholesterol acyl transferase
- PPAR
peroxisome proliferator‐activated receptor
- STZ
streptozotocin
Introduction
Metabolic syndrome is described as a multi‐faceted disorder incorporating obesity, impaired fasting glucose and/or impaired glucose tolerance, reduced insulin sensitivity and dyslipidaemia that predisposes type 2 diabetes (T2D) (Alberti et al. 2006). As a major high‐risk factor of T2D, metabolic syndrome poses a significant health burden around the world (Grundy 2012). According to World Health Organisation, 422 million people are affected with T2D by 2014 and this number is expected to rise to 592 million by 2035 (WHO, 2016). The modern lifestyle incorporating a high‐calorie diet and decreased energy expenditure also contributes to the pandemic of metabolic syndrome and T2D (Aude et al. 2004). Epidemiological studies also revealed that 90% of all patients with T2D are or have been overweight, and indicated that obesity is a strong risk factor and cause of T2D and associated metabolic disturbances (Kahn et al. 2006). It is also estimated that up to 58% of T2D cases can be prevented in the high risk (pre‐diabetes) population if proper preventive measures are taken (Ada 2004).
The events of hyperglycemia and hyperlipidemia and their association present a constellation of high‐risk factors in the development of diabetic and cardiovascular complications (Lender and Sysko 2006). To reduce these serious complications, a multi‐targeted approach controlling blood glucose and lipids is needed (Moller 2001). The currently available therapeutic options such as exercise, dietary modification, or a combination of synthetic anti‐diabetic, and hypolipidaemic drugs possess their own limitations and a multitude of undesirable side effects (Lender and Sysko 2006). Therefore, single medicinal agents having dual properties are in great demand. This has led to continued efforts to explore the effectiveness of new therapeutic substances from natural sources for the control of metabolic syndrome and T2D. In particular, supplementation of health‐promoting nutraceuticals such as naturally occurring bioactive compounds that are capable of eliciting therapeutic responses at the targeted cellular level may be an effective and convenient strategy to improve overall health and reduce disease risk. In addition, nutritherapy could prove to be a powerful alternative to pharmacotherapy due to its relative safety, cost‐effectiveness, and ability to modulate specific and sometimes multiple molecular targets (Davi et al. 2010).
Alpha‐lipoic acid (ALA; 1, 2‐dithiolane‐3‐pentanoic acid), also known as thioctic acid, is traditionally recognized as an essential cofactor in mitochondrial respiratory enzymes that catalyze the oxidative decarboxylation reactions in the body (Packer et al. 1995). Chemically, ALA is a short‐chain fatty acid with a disulphide group in its dithiolane ring and a chiral carbon resulting in R and S enantiomers. Although the majority of the commercially produced ALA consists of a racemic admixture, the R form is the biologically active form that is endogenously produced by the body while the S form is produced from chemical manufacture and is not biologically active (Shay et al. 2009). At the cellular level, ALA is reduced to dihydrolipoic acid (DHLA), which has a number of cellular actions including free radical scavenging and modulating oxidative stress and inflammatory pathways (Shay et al. 2009). ALA when exogenously administered is readily absorbed from the gut and has been clinically used in Europe for the treatment of diabetic polyneuropathy (Biewenga et al. 1997). ALA has been shown to possess anti‐oxidant, cardiovascular, cognitive, anti‐ageing, detoxifying, anti‐inflammatory, anti‐cancer, and neuroprotective pharmacological properties (Goraca et al. 2011).
In laboratory experiments, the effect of ALA on glucose and lipid levels has been investigated both in vitro and in vivo. Daily administration of ALA has been shown to protect the development of diabetes in cyclophosphamide‐induced diabetic mice (Faust et al. 1994). In addition, chronic supplementation of ALA has been shown to lower blood glucose in normal (Nagamatsu et al. 1995), streptozotocin‐ (Khamaisi et al. 1999; Salama 2011; Arambasic et al. 2013; Dinic et al. 2013), and alloxan‐induced diabetic‐ (Anuradha and Varalakshmi 1999; Sudheesh et al. 2011), and in fructose‐fed rats (Castro et al. 2013) with conflicting results on blood insulin levels and insulin sensitivity. Conversely, others reported that ALA elicited no effect on blood glucose and glucose tolerance in normal (Khamaisi et al. 1995), fructose‐fed (Black et al. 1998), streptozotocin‐induced diabetic rats (Nagamatsu et al. 1995; Black et al. 1998; Maritim et al. 2003; Wang et al. 2013; Jin et al. 2014) as well as in high‐fat diet (HFD)‐fed rabbits (Chen et al. 2009) and in genetically induced diabetic rats (Feng et al. 2013; Midaoui et al. 2015).
The lipid‐lowering response of ALA has also been studied in various animal models. The supplementation of ALA has been shown to lower weight gain and plasma total and LDL cholesterol and/or triglyceride levels in normal (Huong and Ide 2008) and in genetically induced diabetic rats (Sena et al. 2008; Butler et al. 2009; Carrier et al. 2014) as well as in HFD‐fed rats (Sena et al. 2008; Yang et al. 2008; Timmers et al. 2010; Seo et al. 2012; Miao et al. 2013), mice (Yi and Maeda 2006; Jang et al. 2014), rabbits (Chen et al. 2009), and in streptozotocin‐induced diabetic rats (Budin et al. 2007). In addition, ALA has been shown to protect arterial lesion formation in vitro (Lee et al. 2012). Conversely, no changes in serum total cholesterol and/or triglyceride levels were observed in streptozotocin‐induced diabetic rats (Salama 2011) and in HFD‐fed obese Zucker rats (Carrier et al. 2014; Rideout et al. 2016). ALA has also been shown to increase high‐density lipoprotein (HDL) cholesterol levels in high‐fat diet‐fed rats (Miao et al. 2013).
One of the rationales for this study is stemmed from the observed discrepancies in the previously reported in vitro and in vivo studies of ALA. Indeed, a majority of these studies either did not provide information on which type of ALA (whether a racemic admixture or a particular ALA enantiomer) was used or varied in a wide sub‐therapeutic doses of ALA. Secondly, although a large body of the above reported work on ALA has been carried out in numerous available animal models (spontaneous/chemical‐/dietary‐induced), the pattern of disease establishment and progress in most of them is not similar to the clinical situation of metabolic syndrome and T2D in humans. The recommended human dose of ALA in metabolic syndrome is approximately 14 mg/kg which is equivalent to a rat dose of approximately 100 mg/kg based on body surface area (McNeilly et al. 2011; Nair and Jacob 2016). Therefore, in this study, we investigated the in vivo effects of R‐ALA (a bioactive enantiomer) at a dose of 100 mg/kg for its glucose and lipid regulating activities in HFD‐fed and low‐dose streptozotocin (STZ)‐treated rat model which replicates the natural history and metabolic characteristics of human metabolic syndrome and T2D.
Materials and Methods
Chemicals used
(R)‐ α ‐Lipoic acid and streptozotocin were purchased from Sigma (St. Louis, MO, USA). The Accuchek ® Active blood glucose meter with glucose test strips and Accutrend Plus ® Instrument (for blood cholesterol and triglycerides) with cholesterol and triglycerides test strips were purchased from Roche Diagnostics, Mannheim, Germany. The HDL cholesterol assay kit was purchased from Wako Diagnostics, Japan. All other chemicals used were of analytical grade.
Animals and diets
Twenty‐nine (29) adult male Sprague‐Dawley (SD) rats (350–450 g) obtained from the Animal Resources Centre (Canning Vale, WA, Australia) were used in the studies. Upon arrival, the rats were randomly housed in polypropylene cages (3 per cage) to minimize isolation stress. The animal facility was well‐ventilated and maintained at an ambient temperature of 24 ± 2°C, relative humidity of 50–60% with 12‐h light and dark cycle. The rats were acclimatized to the laboratory conditions for 1 week prior to experimentation and provided with standard diet and water ad libitum. Both the standard (AIN93G) and high‐fat (SF02‐006) rat pellet diets were supplied by Speciality Feeds (Glen Forrest, WA, Australia). The standard diet contained (in weight percentage) approximately: 69% carbohydrate, 19.6% protein, 4.6% fat, 4.8% crude fiber; and the high‐fat diet contained 10.6% carbohydrate, 19.4% protein, 60% fat, and 4.7% crude fiber. The use and care of the animals in this experimental protocol was approved by the Institutional Animal Care and Ethics Committee (Approval Numbers: A10296 and A11259) of the Western Sydney University following the NHMRC guidelines on Australian code of practice for the care and use of animals for scientific purposes.
Experimental design and treatments
The rats were weight‐matched and divided into three groups (non‐diabetic control, diabetic control and ALA‐treated). The non‐diabetic control rats (n = 5) were fed with standard diet throughout the experiment, while the diabetic control (n = 12) and ALA‐treated rats (n = 12) were fed with HFD for 3 weeks. After 3 weeks of dietary intervention, the diabetic control and the ALA‐treated rats were fasted overnight and injected with a single intraperitoneal low‐dose of freshly prepared STZ (35 mg/kg dissolved in 0.1 mol/L citrate buffer; pH 4.5), while the non‐diabetic control rats received 1 mL/kg of 0.1 mol/L citrate buffer. The diabetic control and the ALA‐treated rats were then switched to the standard diet for the rest of the study and allowed to drink 5% glucose solution to counteract hypoglycemia due to sudden outbursts of insulin from the pancreatic β cells during the first 24 h after the STZ injection. All the animals were observed after the STZ or placebo injections. After 1 week, when the diabetic condition was stabilized, the STZ‐treated diabetic control and ALA‐treated rats with random blood glucose above 250 mg/dL were considered as diabetic and used in the study. The rats in the ALA‐treated (n = 9) group were administered with 100 mg/kg of ALA by oral gavage once daily for 4 weeks, while the diabetic control (n = 10) and non‐diabetic control (n = 5) groups received the vehicle (1% sodium CMC) by oral gavage once daily for 4 weeks as schematically depicted in Figure 1.
Figure 1.
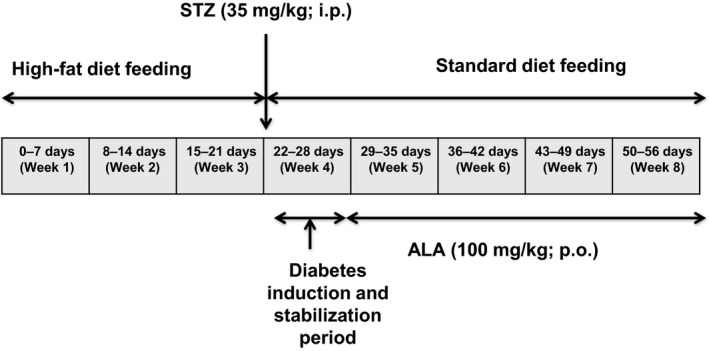
Schematic representation of experimental protocol. ALA, Alpha lipoic acid; STZ, Streptozotocin; i.p, intraperitoneal; p.o., per oral.
Blood collection and experimental parameters
After 4 weeks of ALA treatment, the rats were fasted overnight for 12 h and blood sampling was done from the lateral saphenous vein under a conscious condition in all groups of rats. The blood samples were either immediately subjected to biochemical analysis or were allowed to clot for 30 minutes before being centrifuged at 850g for 15 min. The serum was separated and stored at −20°C until biochemical analysis.
Body weight data
The weekly body weights were recorded in all the groups of rats between 9 am and 10 am and continued throughout the study.
Determination of serum glucose
Serum glucose was measured with an Accuchek ® Active blood glucose meter and test strips using an enzymatic reflectance photometric assay based on the glucose dehydrogenase (GDH) method following manufacturer's instructions. Briefly, one drop of fresh venous blood was applied to the reagent area of a test strip and, when prompted, the strip was inserted into the glucose meter test chamber that directs light onto the test area. The glucose in the sample reacts with the reagents in the strip pad causing a color change. The amount of light reflected from the colored test area is proportional to the concentration of glucose measured by the photometer and is converted into a digital readout.
Determination of serum triglycerides and total cholesterol
Serum triglycerides and total cholesterol were measured using an Accutrend Plus ® Instrument and test strips using an enzymatic reflectance photometric assay based on the glycerol‐phosphate oxidase (GPO) and cholesterol oxidase methods respectively following manufacturer's instructions. Briefly, one drop of fresh venous blood was applied to the reagent area of a test strip and, when prompted, inserted into the test chamber of the instrument that directs light onto the test area. The triglycerides/total cholesterol in the sample reacts with the reagents in the strip pad causing a color change. The amount of light reflected from the colored test area is proportional to the concentration of triglycerides/total cholesterol measured by the photometer and is converted into a digital readout.
Determination of TyG‐index
Triglyceride‐glucose (TyG)‐index levels, as a measure of insulin sensitivity (Guerrero‐Romero et al. 2010) was calculated from the real‐time fasting serum glucose and triglyceride concentrations of different groups of rats using the mathematical TyG formula:
Determination of serum HDL‐cholesterol
Serum HDL‐cholesterol was estimated using an enzymatic colorimetric assay based on the cholesterol oxidase method after removal of the other lipoproteins by precipitation with phosphotungstate‐magnesium, following the manufacturer's instructions. The absorbance was measured at 600 nm using an Ultrospec 2000 UV/VIS spectrophotometer (Biochrom Ltd, Cambridge, UK).
Determination of serum VLDL‐ and LDL‐cholesterol
Serum VLDL‐ and LDL‐cholesterol were calculated indirectly by the Friedewald's equations (Friedewald et al. 1972).
Determination of atherogenic and coronary risk indices
Atherogenic index (AI) and coronary risk index (CRI) as measures of the extent of atherosclerotic lesions and coronary atherosclerosis development, respectively, were calculated using serum lipids of different groups of rats using the mathematical formulae (Subramaniam et al. 2011)
Data and statistical analysis
All the results are expressed as means ± SEM. To examine the quantitative differences among the experimental groups, the respective data were subjected to analysis of variance (ANOVA) using the GraphPad Prism‐ 5.03 (GraphPad Software Inc., California, CA) statistical programme. Post hoc comparisons were made using Tukey's multiple comparisons. In all tests, P < 0.05 value was used as the criterion for statistical significance.
Results
Body weight data
The changes in the mean body weight of the different groups of rats over the 8‐weeks study period are shown in Figure 2A. There was no significant difference in the initial body weights (from 401.3 ± 7.6 g to 417.9 ± 15.2 g; n = 5–10) and body weights after 3 weeks between different groups. However, 1 week post‐STZ injection (week 4), diabetic control rats displayed a significant (P < 0.01) reduction in body weight by 8.13% compared with the non‐diabetic control rats. After 8 weeks, however, this difference was more pronounced by 21.55% and gained higher significance (P < 0.001). On the other hand, ALA‐treated rats showed a tendency to reverse the STZ‐induced body weight reduction, although this change was not significant (454.9 ± 11.3 g vs. 444.7 ± 7.9 g; P = 0.687) when compared with the diabetic control after 8 weeks (Fig. 2B).
Figure 2.
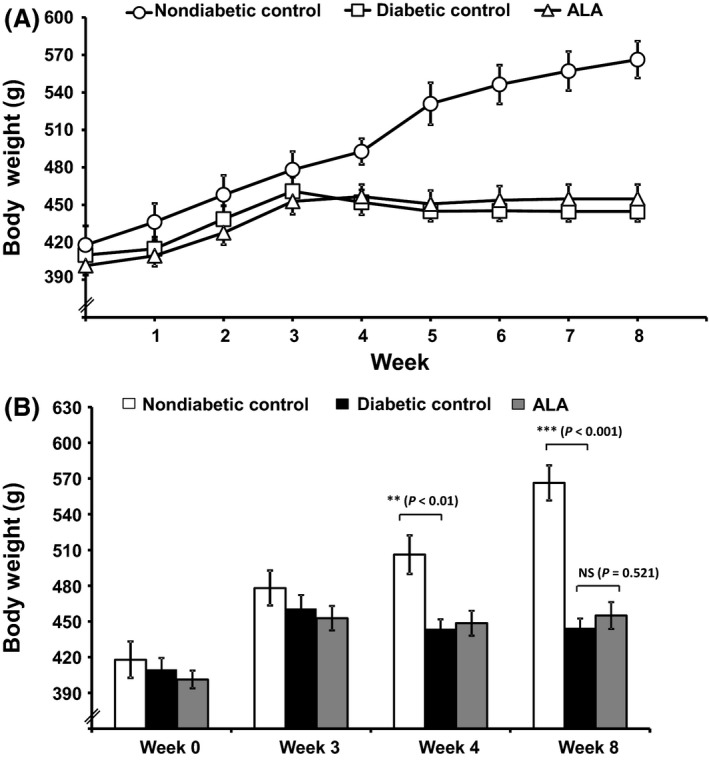
Effect of ALA on HFD and STZ‐induced body weight change in rats. Daily recordings of the mean body weight changes of the experimental groups of rats (A) and comparison of the mean body weights of rats at weeks 0, 3, 4, and 8 among the different groups of rats (B). Treatment with ALA for 4 weeks (from week 4 to week 8) protected the diabetes‐induced weight loss (nonsignificant) as compared to diabetic control rats. Each bar represents the mean ± SEM of 5–10 rats. **P < 0.01 and ***P < 0.001 when compared with diabetic control group. NS, No significant difference between the groups in comparison.
Serum glucose
As shown in Table 1, diabetic control rats that received HFD and low‐dose STZ showed a significant (P < 0.001; n = 10) 3.1‐fold elevation of fasting blood glucose after 8 weeks compared with the non‐diabetic control rats (n = 5). However, ALA treatment (100 mg/kg body weight) for 4 weeks produced a significant (P < 0.001; n = 9) 2.4‐fold decrease in blood glucose compared with the diabetic control rats (Table 1).
Table 1.
Effect of alpha‐lipoic acid on high‐fat diet (HFD) and streptozotocin (STZ)‐induced metabolic derangements of glucose, triglycerides, and insulin sensitivity in rats
| Group | Serum parameters | ||
|---|---|---|---|
| Glucose (mg/dL) | Triglycerides (mg/dL) | TyG Index | |
| Non‐diabetic control | 115.8 ± 7.88 | 68.5 ± 5.39 | 8.2 ± 0.06 |
| Diabetic control | 479.9 ± 14.03### | 107.8 ± 2.50### | 10.1 ± 0.03### |
| ALA (100 mg/kg) | 195.7 ± 11.00*** | 86.8 ± 2.01*** | 9.0 ± 0.05*** |
ALA: alpha‐lipoic acid; HFD: high‐fat diet; STZ: streptozotocin.
Values represent the mean ± SEM of 6–12 rats (n = 5–10). Significant difference from diabetic control: ***P < 0.001.
Significant difference from non‐diabetic control: ### P < 0.001.
Serum triglycerides
The levels of serum triglycerides in the different groups of rats are shown in Table 1. The diabetic control rats exhibited a significant (P < 0.001; n = 10) increase in serum triglycerides levels after 8 weeks compared with the non‐diabetic control rats (n = 5). However, the rats treated with ALA (100 mg/kg) for 4 weeks significantly (P < 0.001; n = 9)) reduced the serum triglyceride level (86.8 ± 2.0 mg/dL vs. 107.9 ± 2.5 mg/dL) by 1.2‐fold compared with the diabetic control rats (n = 10).
TyG‐index
The effect of ALA on insulin sensitivity as assessed from the TyG‐index in the different groups of rats is shown in Table 1. Diabetic control rats that received HFD and low‐dose STZ showed a significant (P < 0.001; n = 10) reduction of insulin sensitivity when compared with the non‐diabetic control rats (n = 5) after 8 weeks. On the other hand, the rats treated with ALA (100 mg/kg) showed a significant (P < 0.001; n = 9) increase in insulin sensitivity (9.0 ± 0.05 vs. 10.1 ± 0.03) as measured from TyG‐index compared with the diabetic control rats (n = 10).
Serum total‐cholesterol
Figure 3A shows the total cholesterol levels among the various experimental groups. Diabetic rats (n = 10) that received HFD and low‐dose STZ showed a significant (P < 0.001) 2.8‐fold elevation of total‐cholesterol levels after 8 weeks compared with the non‐diabetic control rats (n = 5). However, ALA treatment (100 mg/kg) for 4 weeks produced a significant (P < 0.001; n = 9) 1.5‐fold decrease in serum total‐cholesterol (88.4 ± 3.1 mg/dL vs. 130.6 ± 3.8 mg/dL) compared with the diabetic control rats (n = 10).
Figure 3.
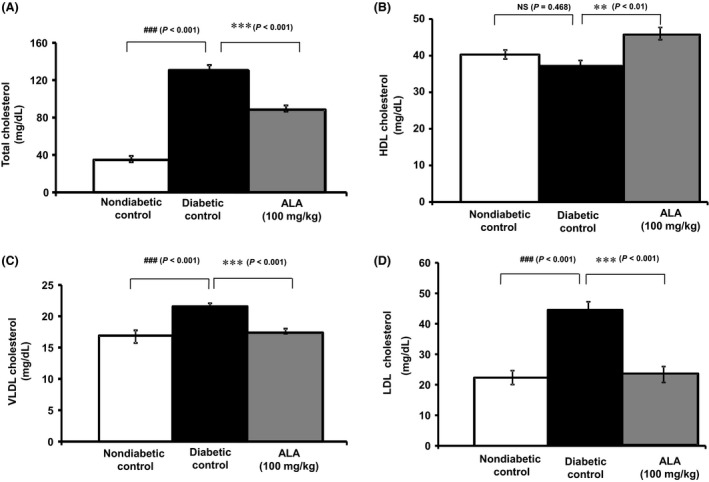
Effect of ALA on high‐fat diet and STZ‐induced metabolic derangements of lipid profiles. Each bar represents the mean ± SEM of 5–10 rats. **P < 0.01 and ***P < 0.001 when compared with diabetic control group. ###P < 0.001 when compared with non‐diabetic control group. NS, No significant difference between the groups in comparison.
Serum HDL‐cholesterol
As depicted in Figure 3B, diabetic rats (n = 10) that received HFD and low‐dose STZ tended to show a decrease in the levels of HDL‐cholesterol although not significant (P = 0.468) when compared with the non‐diabetic control rats (n = 5). Interestingly, ALA treatment (100 mg/kg) for four weeks showed a significant (P < 0.01, n = 9) 1.2‐fold increase in HDL‐cholesterol levels (45.8 ± 1.7 mg/dL vs. 37.2 ± 1.7 mg/dL) compared with the non‐diabetic control rats (n = 10).
Serum VLDL‐ and LDL‐cholesterol
The levels of VLDL‐ and LDL‐cholesterol as calculated by Friedewald's equation in the various groups of experimental rats are shown in Figure 3C and D respectively. Diabetic control rats (n = 10) showed a significant elevation of serum VLDL‐cholesterol (0.2 fold; P < 0.001) and LDL‐cholesterol (0.9 fold; P < 0.001) after 8 weeks compared with the non‐diabetic control rats (n = 5). A 0.19‐fold decrease in VLDL‐cholesterol levels was observed in rats treated with ALA (100 mg/kg) which reached statistical significance (P < 0.001, n = 9) when compared with the diabetic control rats after 4 weeks of treatment. In parallel, a 0.9‐fold decrease in LDL‐cholesterol levels was observed in rats treated with ALA (100 mg/kg) which reached statistical significance (P < 0.001, n = 9) when compared with the diabetic control rats after 4 weeks of treatment.
Atherogenic index and coronary risk index
The effect of ALA on reducing the risk of developing atherosclerotic lesions and coronary atherogenesis as assessed from AI and CRI in the different groups of rats is shown in Figure 4. Diabetic control rats that received HFD and low‐dose STZ showed a significant (P < 0.001, n = 10) elevation of AI and CRI after 8 weeks compared with non‐diabetic control rats (n = 5). The rats treated with ALA (100 mg/kg) displayed a significant (P < 0.001) reduction in the risk of developing atherosclerotic lesions (Fig. 4A) and coronary atherogenesis (Fig. 34B) as measured from the AI (2.51 ± 0.21 vs. 0.93 ± 0.61) and CRI (3.51 ± 0.21 vs. 1.93 ± 0.11) when compared with the non‐diabetic control rats.
Figure 4.

Effect of ALA on high‐fat diet and STZ‐induced atherogenic (A) and coronary risk indices (B). All bars represent Mean ± SEM of 5–10 rats (n = 5–10). ***P < 0.001 when compared with diabetic control group. ###P < 0.001 when compared with non‐diabetic control group. NS, No significant difference between the groups in comparison.
Discussion
Metabolic syndrome, a concurrence of disorders including obesity, impaired fasting glucose and/or impaired glucose tolerance, reduced insulin sensitivity, hyperinsulinemia, dyslipidemia, and hypertension has gained importance because of its association with the subsequent development of T2D and its complications (Fujimoto 2000). The development of metabolic syndrome is influenced by a combination of genetic and environmental factors. Among the environmental factors, long‐term high‐fat intake (which reflects the current day living style) is most intensively studied because of its contribution to the development of metabolic syndrome in humans and rodents (Buettner et al. 2006). When carbohydrates are in low supply, or their breakdown is incomplete, fats become the preferred source of energy (Edelman 1998). As a result, fatty acids are mobilized into the general circulation, leading to secondary triglyceridemia whereby the total serum lipids, including triglycerides and cholesterol are increased. Consequently, this will result in abnormal blood lipid profiles that lead to life‐threatening disorders (Buettner et al. 2007; Fernandez 2007).
In this study, we examined the curative effects of ALA in HFD‐fed plus low‐dose STZ injected rats, a metabolic model of dyslipidemia, insulin resistance and T2D that is similar to human metabolic syndrome (Skovsø 2014). Since rats have similar metabolic patterns as that of human beings, it is rational to use this disease model to examine the curative effects of chronic treatment of ALA. Although there are a variety of animal models (spontaneous as well as disease‐induced) available for the study of metabolic syndrome and T2D, the pattern of disease initiation and development in most of the models do not appear to be closely analogous to the clinical situation in humans (Srinivasan and Ramarao 2007). Models such as the Zucker diabetic fatty rat, ob/ob mouse, and db/db mouse develop diabetes genetically, unlike in humans (Fröde and Medeiros 2008). In HFD‐fed animal models, the development of obesity, dyslipidemia, hyperinsulinemia, and insulin resistance are observed but not hyperglycemia or T2D, thus limiting the screening of agents that control blood glucose in T2D (Reuter 2007). In contrast, the chemical‐induced (STZ or alloxan) animal models require relatively high doses of STZ or alloxan and the development of hyperglycemia in these models is primarily due to direct pancreatic beta cell destruction, resulting in insulin deficiency rather than as a consequence of insulin resistance (Lenzen 2008). Thus, the chemical‐induced models represent the symptoms and characteristics typical of human T1D than T2D and consequently, are not very responsive to insulinotropic and insulin‐sensitizing compounds. On the other hand, the HFD‐fed and low‐dose STZ‐induced rat model initially developed by Reed et al. (2000) and modified by Srinivasan et al. (2005) closely mimics the natural history of human metabolic syndrome and T2D. This model offers many advantages over the afore‐mentioned stand‐alone disease induction with either HFD or STZ in that short‐term feeding (3 weeks) with HFD develops dyslipiemia and insulin resistance as seen in metabolic syndrome, and injection of low‐dose STZ (35 mg/kg, i.p.) induces partial destruction of beta cells to suppress insulin secretion with a net result of persistent hyperglycaemia as seen in T2D. To the best of our knowledge, this is the first study to use HFD‐fed and low‐dose STZ‐induced rat model in investigating the curative effects of ALA on in vivo glucose and lipid homeostasis.
In this study, the TyG index was evaluated as a surrogate method for estimation of insulin sensitivity (Simental‐Mendia et al. 2008). The combination of HFD‐feeding and low‐dose STZ injection significantly decreased the body weight and insulin sensitivity and increased serum glucose in rats. The study revealed that ALA (100 mg/kg) effectively lowered blood glucose and increased insulin sensitivity in the rat model, and this was found to be consistent with previous in vivo reports (Khamaisi et al. 1999; Budin et al. 2007; Chen et al. 2009; Salama 2011; Sudheesh et al. 2011; Arambasic et al. 2013; Dinic et al. 2013). Nagamatsu et al. (1995) reported that normal rats chronically treated with 100 mg/kg ALA showed a marked reduction in blood glucose which also supports an earlier observation by Obrosova et al. (1998) in STZ‐induced diabetic rats. Clearly, the results of these earlier observations substantiate our findings in the HFD‐fed and low‐dose STZ‐induced rats.
It has been demonstrated that the molecular actions of ALA either directly or indirectly (through cellular redox status) on the insulin signaling pathway are responsible for its glucose lowering and insulin‐sensitizing properties (Gomes and Negrato 2014; Rochette et al. 2015). Earlier studies have shown that ALA increases glucose uptake in insulin‐sensitive (Khanna et al. 1999) and insulin‐resistant tissues (Streeper et al. 1997). Later studies by Yaworsky et al. (2000) and Konrad et al. (2001) observed that ALA stimulates tyrosine phosphorylation of insulin receptor substrate (IRS‐1) and stimulates expression, translocation and intrinsic activity of glucose transporters (GLUTs) leading to increased cellular glucose uptake Further studies have revealed that ALA ameliorates impaired glucose metabolism and insulin resistance and increases energy expenditure in peripheral tissues by activating 5′‐adenosine monophosphate‐activated protein kinase (AMPK) directly (Lee et al. 2005) or indirectly (Shen et al. 2007) through Ca/calmodulin‐dependent protein kinase (CaMKK). This leads to increased activity of peroxisome proliferator‐activated receptor‐gamma coactivator‐1alpha (PGC‐1 α) (Wang et al. 2010). Thus, the constellation of these findings strongly support the results of our present study by suggesting that glucose‐regulating and insulin‐sensitizing effects of ALA could be at least, in part, be attributed to a direct stimulatory effect on glucose transporters and/or indirect stimulation of tyrosine and serine/threonine kinases phosphorylation and/or increased AMPK activation.
Dyslipidemia is the most important modifiable risk factor contributing to the development of atherosclerosis in T2D (Niemeijer‐Kanters et al. 2001). Thus the importance of blood levels of triglycerides and cholesterol in the pathogenesis of lipid disorders has been extensively reviewed (Raal 2009). In this study, the combination of HFD‐feeding and low‐dose STZ injection markedly increased the serum triglycerides, total‐, VLDL‐ and LDL‐cholesterol with a tendency to decrease HDL‐cholesterol. Presumably, these changes may have occurred, in part, by enhanced cholesterol biosynthesis resulting from the high fat diet (Jones 1997). The high levels of LDL‐cholesterol may have been due to reduced expression or activity of the LDL‐receptor sites in response to the high‐fat diet treatment (Brown and Goldstein 1986). Therefore, interventions aimed at lowering the triglycerides and LDL‐cholesterol and/or raising the HDL‐cholesterol may be an important strategy in lowering the serum triglycerides and total cholesterol in rats fed a high‐fat diet. Consistent with earlier reports, ALA administration along with the high‐fat diet significantly reduced the serum total cholesterol, LDL‐cholesterol, VLDL‐cholesterol and serum triglycerides in addition to marked improvement of HDL‐cholesterol in vivo (Butler et al. 2009; Seo et al. 2012).
An earlier study demonstrated that ALA reduces the activity of HMG‐CoA reductase (involved in cholesterol biosynthesis), and increases the activities of lipoprotein lipase (involved in triglyceride turnover) and lecithin cholesterol acyl transferase (LCAT; involved in HDL maturation) (Thirunavukkarasu et al. 2004). Furthermore, ALA has been shown to increase the expression of apolipoprotein‐A (involved in reverse cholesterol transport) LDL receptor (involved in liver uptake of LDL‐cholesterol) in the liver (Marangon et al. 1999). These observations were substantiated by a recent study by Carrier et al. (2014) demonstrating that the increased expression of the LDL receptor in the liver upon chronic ALA supplementation in HFD‐fed Zucker obese rats is associated with a reduced gene expression and serum levels of proprotein convertase subtilisin/kexin type 9 (PCSK9; involved in LDL receptor degradation). In addition, recent observations from in vitro and in vivo studies have demonstrated that ALA activates both SIRT1 and AMPK which regulate acetyl‐CoA carboxylase (ACC), adipose triacylglycerol lipase (ATGL) and fatty acid synthase (FAS) (Chen et al. 2012). Moreover, it has also been demonstrated that ALA decreases hepatic lipogenesis by suppressing the expression of lipogenic genes carbohydrate‐responsive element‐binding protein (ChREBP) and sterol‐responsive element‐binding protein‐1c (SREBP‐1c) in the liver (Castro et al. 2013). Yang et al. (2008) also reported that lipid reduction in response to ALA treatment is associated with an increase in the expression of lipolytic genes carnitine palmitoyltransferase‐1 (CPT‐1), peroxisome proliferator‐activated receptor‐alpha (PPAR‐ α), and acyl‐CoA oxidase (ACOX). Thus, the molecular mechanisms responsible for the observed lipid‐lowering effects of ALA could be due to multiple effects on potential sites of action, leading to decreased intestinal fat absorption and/or decreased lipid biosynthesis and/or enhanced lipid metabolism.
Long‐term dyslipidemia associated with T2D increases the risk of development of atherosclerosis (Susanti et al. 2010). In particular, the oxidative modification of LDL cholesterol is implicated in the formation of atherosclerotic plaque in the blood vessels. The atherogenic index (AI), which indicates the deposition of foam cells or fatty plaque deposition in blood vessels, is positively correlated to the development of cardiovascular disease (Kwiterovich 2000). Thus, AI is an important predictor of coronary risk potential as it gives an indirect measure of LDL and HDL lipoprotein particle size. Consistent with earlier reports, ALA treatment significant reduced AI in the HFD‐fed and STZ‐induced T2D rats which corresponds to decreased LDL‐cholesterol and increased HDL‐cholesterol (Amom et al. 2008; Seo et al. 2012). There is strong evidence suggesting a direct correlation between high circulating total cholesterol levels and low HDL‐cholesterol levels, with the increased risk of coronary artery disease (Stratton et al. 2000). Upon ALA treatment, the total‐cholesterol: HDL‐cholesterol ratio, as a measure of Framingham's coronary risk index (CRI), is markedly reduced in the present study. This directly corresponds to decreased total‐cholesterol and increased HDL‐cholesterol (D'Agostino et al. 2008). Thus, the significant reduction of the AI and CRI scores clearly demonstrate the potential of ALA supplementation on reducing the risk of cardiovascular complications of T2D.
In summary, the present investigation suggests that ALA has a protective effect on the high‐fat diet and low‐dose STZ‐induced metabolic disturbances by strongly suppressing the hyperglycemic and hyperlipidemic conditions. Thus, the present findings emphasize that ALA supplementation is beneficial in the prevention of metabolic disorders caused by a high‐fat diet. Further clinical studies are warranted to explain the mechanism(s) of the glucose and lipid metabolism‐regulating activities of ALA.
Disclosure
The authors declare that there are no known conflicts of interest associated with this publication and there has been no direct or indirect financial support or no non‐financial support for the subject matter or materials discussed in this work that could influence its outcome.
Acknowledgement
This research study was supported under the Higher Degree Research Training Scheme funds provided to HG by the Western Sydney University, Australia.
Ghelani H., Razmovski‐Naumovski V., Nammi S.. Chronic treatment of (R)‐α ‐lipoic acid reduces blood glucose and lipid levels in high‐fat diet and low‐dose streptozotocin‐induced metabolic syndrome and type 2 diabetes in Sprague‐Dawley rats, Pharma Res Per, 5(3), 2017, e00306, doi: 10.1002/prp2.306
References
- Ada N (2004). Prevention or delay of type 2 diabetes. Diabetes Care 27: S47–S54. [DOI] [PubMed] [Google Scholar]
- Alberti KG, Zimmet P, Shaw J (2006). Metabolic syndrome–a new world‐wide definition. A Consensus Statement from the International Diabetes Federation. Diabet Med 23: 469–480. [DOI] [PubMed] [Google Scholar]
- Amom Z, Zakaria Z, Mohamed J, Azlan A, Bahari H, Taufik Hidayat Baharuldin M, et al. (2008). Lipid lowering effect of antioxidant alpha‐lipoic Acid in experimental atherosclerosis. J Clin Biochem Nutr 43: 88–94. [DOI] [PMC free article] [PubMed] [Google Scholar]
- Anuradha B, Varalakshmi P (1999). Protective role of DL‐alpha‐lipoic acid against mercury‐induced neural lipid peroxidation. Pharmacol Res 39: 67–80. [DOI] [PubMed] [Google Scholar]
- Arambasic J, Mihailovic M, Uskokovic A, Dinic S, Grdovic N, Markovic J, et al. (2013). Alpha‐lipoic acid upregulates antioxidant enzyme gene expression and enzymatic activity in diabetic rat kidneys through an O‐GlcNAc‐dependent mechanism. Eur J Nutr 52: 1461–1473. [DOI] [PubMed] [Google Scholar]
- Aude YW, Mego P, Mehta JL (2004). Metabolic syndrome: dietary interventions. Curr Opin Cardiol 19: 473–479. [DOI] [PubMed] [Google Scholar]
- Biewenga GP, Haenen GR, Bast A (1997). The pharmacology of the antioxidant lipoic acid. Gen Pharmacol 29: 315–331. [DOI] [PubMed] [Google Scholar]
- Black K, Qu X, Seale JP, Donnelly R (1998). Metabolic effects of thioctic acid in rodent models of insulin resistance and diabetes. Clin Exp Pharmacol Physiol 25: 712–714. [DOI] [PubMed] [Google Scholar]
- Brown MS, Goldstein JL (1986). A receptor‐mediated pathway for cholesterol homeostasis. Science 232: 34–47. [DOI] [PubMed] [Google Scholar]
- Budin SB, Kee KP, Eng MYS, Osman K, Bakar MA, Mohamed J (2007). Alpha lipoic acid prevents pancreatic islet cells damage and dyslipidemia in streptozotocin‐induced diabetic rats. MJMS 14: 47–53. [PMC free article] [PubMed] [Google Scholar]
- Buettner R, Parhofer KG, Woenckhaus M, Wrede CE, Kunz‐Schughart LA, Scholmerich J, et al. (2006). Defining high‐fat‐diet rat models: metabolic and molecular effects of different fat types. J Mol Endocrinol 36: 485–501. [DOI] [PubMed] [Google Scholar]
- Buettner R, Scholmerich J, Bollheimer LC (2007). High‐fat diets: modeling the metabolic disorders of human obesity in rodents. Obesity (Silver Spring) 15: 798–808. [DOI] [PubMed] [Google Scholar]
- Butler JA, Hagen TM, Moreau R (2009). Lipoic acid improves hypertriglyceridemia by stimulating triacylglycerol clearance and downregulating liver triacylglycerol secretion. Arch Biochem Biophys 485: 63–71. [DOI] [PMC free article] [PubMed] [Google Scholar]
- Carrier B, Wen S, Zigouras S, Browne RW, Li Z, Patel MS, et al. (2014). Alpha‐lipoic acid reduces ldl‐particle number and PCSK9 concentrations in high‐fat fed obese zucker rats. PLoS ONE 9: e90863. [DOI] [PMC free article] [PubMed] [Google Scholar]
- Castro MC, Massa ML, Schinella G, Gagliardino JJ, Francini F (2013). Lipoic acid prevents liver metabolic changes induced by administration of a fructose‐rich diet. Biochim Biophys Acta 1830: 2226–2232. [DOI] [PubMed] [Google Scholar]
- Chen XS, Liu H, Ji AM, Yang YL, Yao YF, Sun L, et al. (2009). Effects of sustained‐release alpha‐lipoic acid tablet on blood lipid, blood sugar and insulin in hyperlipidemic New Zealand rabbits. Nan Fang Yi Ke Da Xue Xue Bao 29: 704–706. [PubMed] [Google Scholar]
- Chen WL, Kang CH, Wang SG, Lee HM (2012). α‐Lipoic acid regulates lipid metabolism through induction of sirtuin 1 (SIRT1) and activation of AMP‐activated protein kinase. Diabetologia 55: 1824–1835. [DOI] [PubMed] [Google Scholar]
- D'Agostino RB Sr, Vasan RS, Pencina MJ, Wolf PA, Cobain M, Massaro JM, et al. (2008). General cardiovascular risk profile for use in primary care: the Framingham Heart Study. Circulation 117: 743–753. [DOI] [PubMed] [Google Scholar]
- Davi G, Santilli F, Patrono C (2010). Nutraceuticals in diabetes and metabolic syndrome. Cardiovasc Ther 28: 216–226. [DOI] [PubMed] [Google Scholar]
- Dinic S, Arambasic J, Mihailovic M, Uskokovic A, Grdovic N, Markovic J, et al. (2013). Decreased O‐GlcNAcylation of the key proteins in kinase and redox signalling pathways is a novel mechanism of the beneficial effect of alpha‐lipoic acid in diabetic liver. Br J Nutr 110: 401–412. [DOI] [PubMed] [Google Scholar]
- Edelman SV (1998). Type II diabetes mellitus. Adv Intern Med 43: 449–500. [PubMed] [Google Scholar]
- Faust A, Burkart V, Ulrich H, Weischer CH, Kolb H (1994). Effect of lipoic acid on cyclophosphamide‐induced diabetes and insulitis in non‐obese diabetic mice. Int J Immunopharmacol 16: 61–66. [DOI] [PubMed] [Google Scholar]
- Feng B, Yan X‐F, Xue J‐L, Xu L, Wang H (2013). The protective effects of α‐lipoic acid on kidneys in type 2 diabetic goto‐kakisaki rats via reducing oxidative stress. Int J Mol Sci 14: 6746–6756. [DOI] [PMC free article] [PubMed] [Google Scholar]
- Fernandez ML (2007). The metabolic syndrome. Nutr Rev 65: S30–34. [DOI] [PubMed] [Google Scholar]
- Friedewald WT, Levy RI, Fredrickson DS (1972). Estimation of the concentration of low‐density lipoprotein cholesterol in plasma, without use of the preparative ultracentrifuge. Clin Chem 18: 499–502. [PubMed] [Google Scholar]
- Fröde TS, Medeiros YS (2008). Animal models to test drugs with potential antidiabetic activity. J Ethnopharmacol 115: 173–183. [DOI] [PubMed] [Google Scholar]
- Fujimoto WY (2000). The importance of insulin resistance in the pathogenesis of type 2 diabetes mellitus. Am J Med 108: 9s–14s. [DOI] [PubMed] [Google Scholar]
- Gomes MB, Negrato CA (2014). Alpha‐lipoic acid as a pleiotropic compound with potential therapeutic use in diabetes and other chronic diseases. Diabetol Metab Syndr 6: 80. [DOI] [PMC free article] [PubMed] [Google Scholar]
- Goraca A, Huk‐Kolega H, Piechota A, Kleniewska P, Ciejka E, Skibska B (2011). Lipoic acid ‐ biological activity and therapeutic potential. Pharmacol Rep 63: 849–858. [DOI] [PubMed] [Google Scholar]
- Grundy SM (2012). Pre‐diabetes, metabolic syndrome and cardiovascular risk. Am Coll Cardiol 59: 635–643. [DOI] [PubMed] [Google Scholar]
- Guerrero‐Romero F, Simental‐Mendia LE, Gonzalez‐Ortiz M, Martinez‐Abundis E, Ramos‐Zavala MG, Hernandez‐Gonzalez SO, et al. (2010). The product of triglycerides and glucose, a simple measure of insulin sensitivity. Comparison with the euglycemic‐hyperinsulinemic clamp. J Clin Endocrinol Metab 95: 3347–3351. [DOI] [PubMed] [Google Scholar]
- Huong DT, Ide T (2008). Dietary lipoic acid‐dependent changes in the activity and mRNA levels of hepatic lipogenic enzymes in rats. Br J Nutr 100: 79–87. [DOI] [PubMed] [Google Scholar]
- Jang A, Kim D, Sung KS, Jung S, Kim HJ, Jo C (2014). The effect of dietary alpha‐lipoic acid, betaine, l‐carnitine, and swimming on the obesity of mice induced by a high‐fat diet. Food Funct 5: 1966–1974. [DOI] [PubMed] [Google Scholar]
- Jin HY, Lee KA, Wu JZ, Baek HS, Park TS (2014). The neuroprotective benefit from pioglitazone (PIO) addition on the alpha lipoic acid (ALA)‐based treatment in experimental diabetic rats. Endocrine 47: 772–782. [DOI] [PubMed] [Google Scholar]
- Jones PJ (1997). Regulation of cholesterol biosynthesis by diet in humans. Am J Clin Nutr 66: 438–446. [DOI] [PubMed] [Google Scholar]
- Kahn SE, Hull RL, Utzschneider KM (2006). Mechanisms linking obesity to insulin resistance and type 2 diabetes. Nature 444: 840–846. [DOI] [PubMed] [Google Scholar]
- Khamaisi M, Potashnik R, Barnea E, Peleg N, Tritschler H, Wessel K, et al. (1995). Effect of lipoic acid on glucose homeostasis and muscle glucose transporters in diabetic rats. Pharmacol Res 31: 85. [Google Scholar]
- Khamaisi M, Rudich A, Potashnik R, Tritschler HJ, Gutman A, Bashan N (1999). Lipoic acid acutely induces hypoglycemia in fasting nondiabetic and diabetic rats. Metabolism 48: 504–510. [DOI] [PubMed] [Google Scholar]
- Khanna S, Roy S, Packer L, Sen CK (1999). Cytokine‐induced glucose uptake in skeletal muscle: redox regulation and the role of alpha‐lipoic acid. Am J Physiol 276: R1327–1333. [DOI] [PubMed] [Google Scholar]
- Konrad D, Somwar R, Sweeney G, Yaworsky K, Hayashi M, Ramlal T, et al. (2001). The antihyperglycemic drug alpha‐lipoic acid stimulates glucose uptake via both GLUT4 translocation and GLUT4 activation: potential role of p38 mitogen‐activated protein kinase in GLUT4 activation. Diabetes 50: 1464–1471. [DOI] [PubMed] [Google Scholar]
- Kwiterovich PO Jr (2000). The metabolic pathways of high‐density lipoprotein, low‐density lipoprotein, and triglycerides: a current review. Am J Cardiol 86: 51–101. [DOI] [PubMed] [Google Scholar]
- Lee WJ, Song KH, Koh EH, Won JC, Kim HS, Park HS, et al. (2005). Alpha‐lipoic acid increases insulin sensitivity by activating AMPK in skeletal muscle. Biochem Biophys Res Commun 332: 885–891. [DOI] [PubMed] [Google Scholar]
- Lee JE, C‐o Yi, Jeon BT, Shin HJ, Kim SK, Jung TS, et al. (2012). Alpha‐lipoic acid attenuates cardiac fibrosis in Otsuka Long‐Evans Tokushima Fatty rats. Cardiovasc Diabetol 11: 111. [DOI] [PMC free article] [PubMed] [Google Scholar]
- Lender D, Sysko SK (2006). The metabolic syndrome and cardiometabolic risk: scope of the problem and current standard of care. Pharmacotherapy 26: 3s–12s. [DOI] [PubMed] [Google Scholar]
- Lenzen S (2008). The mechanisms of alloxan‐ and streptozotocin‐induced diabetes. Diabetologia 51: 216–226. [DOI] [PubMed] [Google Scholar]
- Marangon K, Devaraj S, Tirosh O, Packer L, Jialal I (1999). Comparison of the effect of alpha‐lipoic acid and alpha‐tocopherol supplementation on measures of oxidative stress. Free Radic Biol Med 27: 1114–1121. [DOI] [PubMed] [Google Scholar]
- Maritim AC, Sanders RA, Watkins JB 3rd (2003). Effects of alpha‐lipoic acid on biomarkers of oxidative stress in streptozotocin‐induced diabetic rats. J Nutr Biochem 14: 288–294. [DOI] [PubMed] [Google Scholar]
- McNeilly AM, Davison GW, Murphy MH, Nadeem N, Trinick T, Duly E, et al. (2011). Effect of alpha‐lipoic acid and exercise training on cardiovascular disease risk in obesity with impaired glucose tolerance. Lipids Health Dis 10: 217. [DOI] [PMC free article] [PubMed] [Google Scholar]
- Miao Y, Ren J, Jiang L, Liu J, Jiang B, Zhang X (2013). Alpha‐Lipoic acid attenuates obesity‐associated hippocampal neuroinflammation and increases the levels of brain‐derived neurotrophic factor in ovariectomized rats fed a high‐fat diet. Int J Mol Med 32: 1179–1186. [DOI] [PubMed] [Google Scholar]
- Midaoui AE, Talbot S, Lahjouji K, Dias JP, Fantus IG, Couture R (2015). Effects of alpha‐lipoic acid on oxidative stress and kinin receptor expression in obese zucker diabetic fatty rats. J Diabetes Metab 6: 1–7. [DOI] [PMC free article] [PubMed] [Google Scholar]
- Moller DE (2001). New drug targets for type 2 diabetes and the metabolic syndrome. Nature 414: 821–827. [DOI] [PubMed] [Google Scholar]
- Nagamatsu M, Nickander KK, Schmelzer JD, Raya A, Wittrock DA, Tritschler H, et al. (1995). Lipoic acid improves nerve blood flow, reduces oxidative stress, and improves distal nerve conduction in experimental diabetic neuropathy. Diabetes Care 18: 1160–1167. [DOI] [PubMed] [Google Scholar]
- Nair AB, Jacob S (2016). A simple practice guide for dose conversion between animals and human. J Basic Clin Pharm 7: 27–31. [DOI] [PMC free article] [PubMed] [Google Scholar]
- Niemeijer‐Kanters SD, Banga JD, Erkelens DW (2001). Lipid‐lowering therapy in diabetes mellitus. Neth J Med 58: 214–222. [DOI] [PubMed] [Google Scholar]
- Obrosova I, Cao X, Greene DA, Stevens MJ (1998). Diabetes‐induced changes in lens antioxidant status, glucose utilization and energy metabolism: effect of DL‐alpha‐lipoic acid. Diabetologia 41: 1442–1450. [DOI] [PubMed] [Google Scholar]
- Packer L, Witt EH, Tritschler HJ (1995). alpha‐Lipoic acid as a biological antioxidant. Free Radic Biol Med 19: 227–250. [DOI] [PubMed] [Google Scholar]
- Raal FJ (2009). Pathogenesis and management of the dyslipidemia of the metabolic syndrome. Metab Syndr Relat Disord 7: 83–88. [DOI] [PubMed] [Google Scholar]
- Reed MJ, Meszaros K, Entes LJ, Claypool MD, Pinkett JG, Gadbois TM, et al. (2000). A new rat model of type 2 diabetes: the fat‐fed, streptozotocin‐treated rat. Metabolism 49: 1390–1394. [DOI] [PubMed] [Google Scholar]
- Reuter TY (2007). Diet‐induced models for obesity and type 2 diabetes. Drug Discovery Today: Disease Models 4: 3–8. [Google Scholar]
- Rideout TC, Carrier B, Wen S, Raslawsky A, Browne RW, Harding SV (2016). Complementary Cholesterol‐Lowering Response of a Phytosterol/alpha‐Lipoic Acid Combination in Obese Zucker Rats. J Diet Suppl 13: 283–299. [DOI] [PMC free article] [PubMed] [Google Scholar]
- Rochette L, Ghibu S, Muresan A, Vergely C (2015). Alpha‐lipoic acid: molecular mechanisms and therapeutic potential in diabetes. Can J Physiol Pharmacol 93: 1021–1027. [DOI] [PubMed] [Google Scholar]
- Salama RH (2011). Hypoglycemic effect of lipoic acid, carnitine and Nigella sativa in diabetic rat model. Int J Health Sci (Qassim) 5: 126–134. [PMC free article] [PubMed] [Google Scholar]
- Sena CM, Nunes E, Louro T, Proenca T, Fernandes R, Boarder MR, et al. (2008). Effects of alpha‐lipoic acid on endothelial function in aged diabetic and high‐fat fed rats. Br J Pharmacol 153: 894–906. [DOI] [PMC free article] [PubMed] [Google Scholar]
- Seo EY, Ha AW, Kim WK (2012). Alpha‐Lipoic acid reduced weight gain and improved the lipid profile in rats fed with high fat diet. Nutr Res Pract 6: 195–200. [DOI] [PMC free article] [PubMed] [Google Scholar]
- Shay KP, Moreau RF, Smith EJ, Smith AR, Hagen TM (2009). Alpha‐lipoic acid as a dietary supplement: molecular mechanisms and therapeutic potential. Biochim Biophys Acta 1790: 1149–1160. [DOI] [PMC free article] [PubMed] [Google Scholar]
- Shen QW, Zhu MJ, Tong J, Ren J, Du M (2007). Ca2+/calmodulin‐dependent protein kinase kinase is involved in AMP‐activated protein kinase activation by alpha‐lipoic acid in C2C12 myotubes. Am J Physiol Cell Physiol 293: C1395–1403. [DOI] [PubMed] [Google Scholar]
- Simental‐Mendia LE, Rodriguez‐Moran M, Guerrero‐Romero F (2008). The product of fasting glucose and triglycerides as surrogate for identifying insulin resistance in apparently healthy subjects. Metab Syndr Relat Disord 6: 299–304. [DOI] [PubMed] [Google Scholar]
- Skovsø S (2014). Modeling type 2 diabetes in rats using high fat diet and streptozotocin. J Diabetes Investig 5: 349–358. [DOI] [PMC free article] [PubMed] [Google Scholar]
- Srinivasan K, Ramarao P (2007). Animal models in type 2 diabetes research: an overview. Indian J Med Res 125: 451–472. [PubMed] [Google Scholar]
- Srinivasan K, Viswanad B, Asrat L, Kaul CL, Ramarao P (2005). Combination of high‐fat diet‐fed and low‐dose streptozotocin‐treated rat: A model for type 2 diabetes and pharmacological screening. Pharmacol Res 52: 313–320. [DOI] [PubMed] [Google Scholar]
- Stratton IM, Adler AI, Neil HAW, Matthews DR, Manley SE, Cull CA, et al. (2000). Association of glycaemia with macrovascular and microvascular complications of type 2 diabetes (UKPDS 35): prospective observational study. BMJ 321: 405–412. [DOI] [PMC free article] [PubMed] [Google Scholar]
- Streeper RS, Henriksen EJ, Jacob S, Hokama JY, Fogt DL, Tritschler HJ (1997). Differential effects of lipoic acid stereoisomers on glucose metabolism in insulin‐resistant skeletal muscle. Am J Physiol 273: E185–191. [DOI] [PubMed] [Google Scholar]
- Subramaniam S, Subramaniam R, Rajapandian S, Uthrapathi S, Gnanamanickam VR, Dubey GP (2011). Anti‐Atherogenic Activity of Ethanolic Fraction of Terminalia arjuna Bark on Hypercholesterolemic Rabbits. Evid Based Complement Alternat Med 2011: 487916. [DOI] [PMC free article] [PubMed] [Google Scholar]
- Sudheesh NP, Ajith TA, Janardhanan KK, Krishnan CV (2011). Palladium‐alpha‐lipoic acid complex attenuates alloxan‐induced hyperglycemia and enhances the declined blood antioxidant status in diabetic rats. J Diabetes 3: 293–300. [DOI] [PubMed] [Google Scholar]
- Susanti E, Donosepoetro M, Patellongi I, Arif M (2010). Differences between several atherogenic parameters in patients with Controlled and Uncontrolled Type 2 Diabetes Mellitus. Med J Indones 19: 103–108. [Google Scholar]
- Thirunavukkarasu V, Anitha Nandhini AT, Anuradha CV (2004). Effect of alpha‐lipoic acid on lipid profile in rats fed a high‐fructose diet. Exp Diabesity Res 5:195–200. [DOI] [PMC free article] [PubMed] [Google Scholar]
- Timmers S, de van Vogel‐ den Bosch J, Towler MC, Schaart G, Moonen‐Kornips E, Mensink RP, et al. (2010). Prevention of high‐fat diet‐induced muscular lipid accumulation in rats by alpha lipoic acid is not mediated by AMPK activation. J Lipid Res 51:352–359. [DOI] [PMC free article] [PubMed] [Google Scholar]
- Wang Y, Li X, Guo Y, Chan L, Guan X (2010). alpha‐Lipoic acid increases energy expenditure by enhancing adenosine monophosphate‐activated protein kinase‐peroxisome proliferator‐activated receptor‐gamma coactivator‐1alpha signaling in the skeletal muscle of aged mice. Metabolism 59: 967–976. [DOI] [PMC free article] [PubMed] [Google Scholar]
- Wang L, Wu CG, Fang CQ, Gao J, Liu YZ, Chen Y, et al. (2013). The protective effect of alpha‐Lipoic acid on mitochondria in the kidney of diabetic rats. Int J Clin Exp Med 6: 90–97. [PMC free article] [PubMed] [Google Scholar]
- WHO (2016). Global report on diabete 2016.
- Yang RL, Li W, Shi YH, Le GW (2008). Lipoic acid prevents high‐fat diet‐induced dyslipidemia and oxidative stress: a microarray analysis. Nutrition 24: 582–588. [DOI] [PubMed] [Google Scholar]
- Yaworsky K, Somwar R, Ramlal T, Tritschler HJ, Klip A (2000). Engagement of the insulin‐sensitive pathway in the stimulation of glucose transport by alpha‐lipoic acid in 3T3‐L1 adipocytes. Diabetologia 43: 294–303. [DOI] [PubMed] [Google Scholar]
- Yi X, Maeda N (2006). Alpha‐Lipoic acid prevents the increase in atherosclerosis induced by diabetes in apolipoprotein E‐deficient mice fed high‐fat/low‐cholesterol diet. Diabetes 55: 2238–2244. [DOI] [PubMed] [Google Scholar]