Abstract
Prostaglandin (PG) E2 is the key driver of inflammation associated with arthritic conditions. Inhibitors of PGE 2 production (NSAIDs and Coxibs) are used to treat these conditions, but carry significant side effect risks due to the inhibition of all prostanoids that play important physiological function. The activities of PGE 2 are transduced through various receptor sub‐types. Prostaglandin E2 type 4 receptor (EP4) is associated with the development of inflammation and autoimmunity. We therefore are interested in identifying novel EP4 antagonists to treat the signs and symptoms of arthritis without the potential side effects of PGE 2 modulators such as NSAIDs and Coxibs. Novel EP4 antagonists representing distinct chemical scaffolds were identified using a variety of in vitro functional assays and were shown to be selective and potent. The compounds were shown to be efficacious in animal models of analgesia, inflammation, and arthritis.
Keywords: Anti‐inflammatory drugs, arthritis, EP4 antagonist, inflammation, pain, prostaglandin
Abbreviation
- AIA
adjuvant induced arthritis
- CIA
collagen induced arthritis
- coxibs
cyclooxygenase inhibitors
- cPGES
cytosolic prostaglandin E synthase
- EP1, EP2, EP3, EP4
prostaglandin E receptor types 1, 2, 3, and 4 respectively
- HWB
human whole blood
- MIA
monoiodoacetate
- mPGES‐1 and mPGES‐2
microsomal prostaglandin E synthase 1 and 2
- NSAID
non‐steroidal anti‐inflammatory drug
- OA
osteoarthritis
- RA
rheumatoid arthritis
Introduction
Chronic inflammation of the synovial joint is a common feature of both osteoarthritis (OA) and rheumatoid arthritis (RA) and is associated with pain, swelling, synovial hyperplasia, destruction of cartilage and bone, leading to reduced mobility (Gardner 1994; Sokolove and Lepus 2013). While the pathophysiology of the disease processes and the mediators involved in OA and RA are not fully understood, cyclooxygenase‐2 derived prostaglandins play a key role in initiating inflammation and perpetuating the signs and symptoms of the diseases by activating multiple inflammatory cells (Smith 1989, Funk 2001; Smyth et al. 2009). Prostaglandins (PGs) represent a family of bioactive lipid mediators that are produced from arachidonic acid via a multistep enzymatic sequence. Although multiple prostaglandins are produced, PGE2 is the most prominent prostanoid responsible for the inflammation and pain in both OA and RA. In animal models of arthritis, a neutralizing antibody to PGE2 is as effective as nonsteroidal anti‐inflammatory drugs (NSAIDs) treatment (Portanova et al. 1996) in reducing inflammation and hyperalagesia. PGE2 synthesis is catalyzed by a specific terminal synthase called microsomal prostaglandin E synthase 1 (mPGES‐1) (Jakobsson et al. 1999). Gene deletion and pharmacological studies indicate that the inhibition of mPGES‐1 is effective in reducing signs and symptoms of arthritis in several animal models (Trebino et al. 2003; Xu et al. 2008; Chandrasekhar et al. 2016). NSAIDs and selective cyclooxygenase inhibitors (coxibs) provide symptomatic relief in human arthritis by blocking the production of PGE2 through the inhibition of cyclooxygenase‐1and/or cyclooxygenase‐2 (FitzGerald 2003; Rainsford 2007). While each of these approaches of PGE2 modulation provide clinical efficacy, serious side effects have been associated with these drugs since they also interfere with the physiological roles of PGE2 in the kidney, gastrointestinal tract, cardiovascular, and immune system (Fitzgerald 2004; FitzGerald and Patrono 2001; Flavahan 2007).
The biological actions of PGE2 are mediated through four different membrane bound G‐protein‐coupled receptors (GPCRs), EP1‐4 (Clark et al. 1989; Coleman et al. 1994; Narumiya et al. 1999; Breyer et al. 2001 Sugimoto and Narumiya 2007). PGE2 binds with high affinity to each of the structurally distinct gene products. Upon ligand binding, the cytoplasmic C‐terminal regions of the receptors become associated with distinct G‐protein subunits that produce a variety of signal transducers. EP2 and EP4 couple to Gs proteins to stimulate cAMP induction. EP1 couples to Gq proteins leading to an increase in intracellular Ca2 + accumulation and the EP3 receptor couples to Gi protein and serves to inhibit cAMP (Bos et al. 2004; Narumiya et al. 1999). EP4 is widely expressed in a variety of cells (monocytes/macrophages, platelets, and neuronal cells) and tissues. Gene deletion studies suggest that deletion of the EP4 receptor (but not EP1, EP2, or EP3 deletion) protected against arthritis generated in mice upon type II collagen monoclonal antibody challenge, while wild‐type mice developed inflammatory arthritis and related changes in histology (McCoy et al. 2002).
Since the EP4 receptor is not known to be associated with direct alteration in other prostanoids, there has been considerable interest in developing EP4 antagonists as potential safer anti‐inflammatory molecules. Recently, several EP4 antagonists have been described and efficacy has been demonstrated in a variety of animal models of arthritis (Nakao et al. 2007; Murase et al. 2008; Clark et al. 2008; Xu et al. 2008). CJ‐023,423, a selective EP4 antagonist has been shown to be efficacious in a prospective placebo controlled study for signs and symptoms of OA in dogs (Rausch‐Derra et al. 2016). Recently, we have described several EP4 antagonists that are highly selective and potent (Blanco et al. 2016a,b,c; Schiffler et al. 2015). In this report, we describe the pharmacological characteristics of the molecules and show that they are highly effective in reducing the signs and symptoms in a variety of animal models of analgesia and inflammation.
Materials and Methods
EP4 antagonists
Compounds 1, 2, and 3 were prepared as described (Blanco et al. 2016a,b,c, Schiffler et al. 2015). Reference EP4 antagonists CJ‐023,423 and CJ‐042,794 were prepared as described (Nakao et al. 2002; (Yamagishi et al. 2005) respectively. The reference EP1 antagonist MF266‐1, EP2 antagonist, and EP3 antagonist MF266‐3 were prepared as described (Ducharme et al. 2005; Skerratt and Dack 2009; Juteau et al. 2001) respectively.
EP4 cAMP antagonist assays
Human EP4 (GenBank Accession # AY429109, Clone ID PER0400000, UMR cDNA Resource Center, Rolla, MO) was stably expressed in HEK293 cells. Rat EP4 cDNA (GenBank Accession# NM_03276) was cloned into pcDNA 3.1 vector and stably transfected into HEK293 cells. The cell lines were maintained in DMEM (invitrogen) supplemented with 10% fetal bovine serum (FBS), 1 mmol/L sodium pyruvate, 10 mmol/L HEPES, 500 μg/mL geneticin and 2 mmol/L l‐glutamine. Confluent cultures were grown at 37°C in an atmosphere containing 5% CO2. Cells were harvested using 0.25% Trypsin‐ EDTA, suspended in freeze media at a density of 107cel1s/mL, and aliquots were stored in liquid nitrogen. Immediately prior to the assay, cells were thawed with DMEM and suspended in cAMP assay buffer (HBSS with 0.1% BSA, 20 mmol/L HEPES and 200 μmol/L IBMX).
The inhibition of PGE2‐stimulated cAMP production by EP4 antagonists was measured using homogeneous time resolved fluorescence technology (HTRF; Cisbio, cat # 62AM4PEB). 4000 cells were incubated with 50 μL cAMP assay buffer containing EC80 of PGE2 (0.188 nmol/L PGE2, Sigma, cat# P5640) and antagonists at room temperature for 20 min. CJ‐023,423 served as the positive control. To measure the cAMP levels, cAMP‐d2 conjugate and anti cAMP‐cryptate conjugate in lysis buffer were incubated with the treated cells at room temperature for 1 h. The HTRF signal was detected using an EnVision plate reader (Perkin‐Elmer, Inc., Waltham, MA, USA.) to calculate the ratio of fluorescence at 665 to 620 nm. The raw data were converted to cAMP (nmol/L) using a cAMP standard curve generated for each experiment. Data were analyzed using a 4‐parameter nonlinear logistic equation. Results are expressed as the geometric mean ± standard deviation or geometric mean ± standard error as noted.
EP1, EP2, EP3, and EP4 binding assays
Receptor binding assays were done using membrane preparations of HEK 293 cells transfected with various prostanoid receptors using previously published procedure (Nakao et al. 2007). EP1 and EP4 membranes were prepared from recombinant HEK293 cells stably expressing human EPl receptor (GenBank Accession # AY275470, Clone ID PER0100000, UMR cDNA Resource Center, Rolla, MO) or human EP4 receptor. EP2 and EP3 membranes were prepared from HEK293 cells transiently transfected with human EP2 receptor (GenBank Accession # AY275471, Clone ID PER0200000, UMR cDNA Resource Center, Rolla, MO) or human EP3 receptor (GenBank Accession # AY429108, Clone ID PER3VI0000, UMR cDNA Resource Center, Rolla, MO) plasmids. Frozen cell pellets were homogenized in homogenization buffer (10 mmol/L Tris‐HCl, pH7.4, 250 mmol/L sucrose, 1 mmol/L EDTA, 0.3 mmol/L indomethacin and protease inhibitor cocktail with EDTA (Roche Molecular Biochemicals, catalog # 1691498)) using a Teflon/glass homogenizer. After a low speed centrifugation (200g for 15 min at 4°C) the supernatant was subjected to high speed centrifugation (30,000g for 60 min at 4°C). Membrane protein preparation was aliquoted and quick frozen on dry ice prior to storage at −80°C. The K d values for [3H]‐PGE2 binding to each receptor were determined by saturation binding studies or homologous competition. Compounds were tested in a 96‐well format using a three‐fold dilution series to generate 10‐point curves. Diluted compound was incubated with 20 μg/well EP1, 10 μg/well EP2, l μg/well EP3 or 10–20 μg/well EP4 membrane for 90 min at 25°C in the presence of 0.3–0.5 nmol/L [3H]‐PGE2 (PerkinElmer, 118–180 Ci/mmol). The binding reaction was performed in 200 μL MES buffer (10 mmol/L MES, pH 6.0, 10 mmol/L MgCl2, and l mmol/L EDTA) using polystyrene 96‐well plates. To determine the effects of EP4 antagonists, membrane preparations were treated with various concentrations of compounds with a constant concentration of (0.3 nmol/L) [3H]‐PGE2. The membranes were harvested by filtration (TomTek harvester), washed four times with cold buffer (10 mmol/L MES, pH 6.0, 10 mmol/L MgCl2), dried in a 60°C oven, and the radioactivity was quantified as counts per min (CPM) using a TopCount detector. Percent specific binding was calculated as the percent of the binding in the absence of any inhibitor, corrected for binding in the presence of 2 μmol/L PGE2. Data were analyzed using a 4‐parameter nonlinear logistic equation. K i Conversion from IC50 Values (K i = IC50 (1 + [L]/K d) where [L] is the ligand concentration). Results are expressed as the geometric mean ± standard deviation or geometric mean ± standard error as noted.
Off‐target activity
The off‐target activity related to prostaglandin pathway (Table 2) were obtained at CEREP (Blanco et al. 2016c).
Table 2.
In vitro pharmacology for off‐target activities
| Compound | Target | Conc, μmol/L | % Inh |
|---|---|---|---|
| Compound 1 | COX2 (h) | 10 | −10 |
| COXl (h) | 10 | −216.00a | |
| TP (TXA2/PGH2) (h); antagonist effect | 10 | −12.00 | |
| TP (TXA2/PGH2) (h); agonist effect | 10 | −4.00 | |
| IP (PGI2) (h), agonist radioligand | 10 | −4.00 | |
| FP(h); agonist radioligand | 10 | −2.00 | |
| DP1(h); agonist radioligand | 10 | 0.00 | |
| Compound 2 | COX2 (h) | 10 | −17 |
| COXl(h) | 10 | −24.00 | |
| TP (TXA2/PGH2) (h); antagonist effect | 10 | −12.00 | |
| TP (TXA2/PGH2) (h); agonist effect | 10 | −2.00 | |
| IP (PGI2) (h), agonist radioligand | 10 | 9.00 | |
| FP(h); agonist radioligand | 10 | −9.00 | |
| DP1(h); agonist radioligand | 10 | −4.00 |
Non‐specific assay interference.
Whole blood assays
The in vitro whole blood assay was conducted using established procedures (Murase et al. 2008). Blood was collected from normal volunteer donors into sodium heparin vacutainer tubes. Donors had not taken glucocorticoids within 2 weeks of the donation. All tubes/donor were pooled into 50 mL Falcon conical centrifuge tubes and 98 μL/well of blood was distributed into 96 well tissue culture plates (Falcon 3072). Compounds were diluted into DMSO to 100 X final and 1 μL/well in triplicate was added to the blood to give 7 point concentration response curves. The blood was pretreated with the compounds at 37°C, 5% CO2 in a humidified atmosphere, for 30 min, after which 1 μL/well of a solution of 1 mg/mL of lipopolysaccharide (LPS) (Sigma, serotype 0111:B4) in 0.2 mg/mL‐ bovine serum albumin (BSA)/PBS ± 1 μmol/L PGE2 (Cayman 14010) was added to give a final concentration of 10 μg/ml LPS ± 10 nmol/L PGE2. The plates were incubated for 20–24 h at 37°C, 5% CO2, in a humidified atmosphere. The plates were centrifuged at 1800g, 10 min at 22°C, in an Eppendorf 5810R centrifuge. Plasma was removed from the cell layer and was transferred to v‐bottom polypropylene plates. TNFα ‐levels in plasma were quantitated by a commercially available enzyme immunoassay (R&D Systems, DY210), using Immulon 4 HBX plates (Thermo 3855) and 3, 3′, 5, 5′ tetramethylbiphenyl‐4, 4′‐diamine substrate (KPL 50‐76‐03). The plates were read at A450‐A650 on a plate reader (Molecular Devices Versamax) using SOFTmaxPRO (v. 4.3.I) software. IC50s were calculated using Graphpad Prism (v. 4) nonlinear regression, sigmoidal dose response curve fitting. Results are expressed as the geometric mean ± SD.
Animal models
Studies were either run at Eli Lilly or at Covance Incorporated, Greenfield, Indiana. All experiments were carried out according to animal care and use protocols approved by the Eli Lilly and Covance Institutional Animal Care and Use Committees.
For the monoiodoacetate (MIA) and adjuvant induced arthritis (AIA) studies, male Lewis rats (Envigo, Indianapolis, IN) of approximately 8 weeks of age at the time of disease induction were used. For collagen induced arthritis studies (CIA) female Lewis rats (Charles River) weighing 150–170 g were used. Rats were housed in groups of 2 or 3 per cage and maintained in a constant temperature, and on a 12 h light/12 h dark cycle. Animals had free access to food and water at all times except during data collection.
Rat MIA model of pain
The right knees of rats were injected with 0.3 mg of MIA (Sigma Aldrich) in 50 μL of saline and the left knees with 50 μL of saline on day zero. These intra‐articular injections are directly into the synovial cavity of the flexed knee joint through the patella ligament. Twelve days later, the rats were randomized into groups of five rats using body weight and the Block Randomized Allocation Tool. For each study rats were dosed with vehicle (10% Acacia plus 0.05% antifoam) and either compound 1 or compound 2 at doses of 0.3, 1, 3, and 10 mg/kg. Reference compound CJ‐042,794 was also tested in the MIA model on day 14 post MIA injection at doses of 1, 3, 10, 30, and 50 mg/kg with the vehicle being 10% Solutol in PEG400 (n = 4 rats per group). The nonsteroidal anti‐inflammatory drug (NSAID) diclofenac was included in all studies at a dose of 5 mg/kg as a positive control. All dosing was once only by oral gavage and dose volume was 5 mL/kg and dosing was staggered by 10 min for each rat. For compound 1 pain was measured 30 min post dose and for compound 2 and CJ‐042,794 pain was measured 1 h post‐dose. These times were chosen as they represented T max for each compound. Pain was measured using incapacitance testing. This test measures the difference in hind paw weight bearing between the MIA and saline injected knees, and for these studies each value represents the average of three separate measurements acquired over a one‐second period per rat.
Results from compound 1 will not be reported as they have been previously published (Blanco et al. 2016b).
AIA model of inflammation
On Day 0, paw widths of both right and left paws were measured between the lateral and dorsal surfaces using calipers, and a mean paw thickness for each rat was calculated by averaging these measurements. Rats were then inoculated intradermally with 0.25 mg of adjuvant (M. Tuberculosis H37 RA from Difco) in 100 μL of mineral oil at the base of the tail to induce adjuvant disease. Eleven days post inoculation paw widths of both right and left paws were measured again, and the percent change from the Day 0 reading was calculated. This measurement, along with the body weight of the rats, was used to randomize the animals into five groups of eight animals. For each study rats were dosed with vehicle (10% Acacia plus 0.05% antifoam) and either compound 1 or compound 2 at doses of 1, 3, and 10 mg/kg. Reference compound CJ‐023,423 was also tested in the AIA model at doses of 30, 60, and 100 mg/kg. The nonsteroidal anti‐inflammatory drug (NSAID) diclofenac was included in all studies at a dose of 10 mg/kg as a positive control. Dosing was once daily (twice daily for CJ‐023,423) by oral gavage for 4 days at a dose volume of 5 mL/kg. On the fifth day after dosing started (day 15 post adjuvant injection) the rats were euthanized without further dosing and paw width measured again. The percent increase in mean paw thickness from day 11 to day 15 was then calculated as a measure of paw swelling which is indicative of the amount of inflammation in the paws measured. Results from compound 1 will not be reported as they have been previously published (Blanco et al. 2016b).
Type‐II CIA model of inflammation and autoimmunity
On day 1 of the study ankle widths are measured across the joint (left side to right side) at the thickest point with calipers and rats immunized intradermally near the base of the tail with 0.4 mL of 1 mg/mL type II collagen (Elastin Products) emulsified with incomplete Freund's adjuvant (Sigma Aldrich). A second booster injection booster of 0.4 mL of the collagen emulsion was given on day 8 of the study. Ankle widths were measured on day 8 before the collagen injection and every 2–3 days thereafter until study end. On day 11 rats were randomized into five groups of eight animals based on inflammation (redness and/or swelling) in their hind paws and body weight. Rats were then dosed with vehicle (10% Acacia plus 0.05% antifoam) and compound 3 at doses of 3, 10, and 30 mg/kg. Prednisolone was included at a dose of 10 mg/kg as a positive control. Dosing was by oral gavage once daily for seventeen days at a dose volume of 5 mL/kg. On day 28 rats were euthanized and hind paws and knee joints collected for histology. Ankles and knees were fixed in neutral buffered formalin, decalcified, embedded in paraffin, and sectioned according to standard histological methodology and the joints were then scored by a pathologist using published scoring criteria (Bendele 2001; Levine et al. 2014).
Statistical analysis
Data are presented as means with standard error of the means (SEM). Data were evaluated by one way analysis of variance (ANOVA). Differences between groups were considered to be significant if the P < 0.05.
Results
Identification of novel human EP4 receptor antagonists
The structures of three optimized EP4 antagonists (Compound 1, Compound 2, and Compound 3) representing different scaffolds, and two reference EP4 inhibitors CJ‐023,423 and CJ‐042,794 are shown in Figure 1. EP4 antagonists were initially identified based on the ability of compounds to antagonize PGE2 stimulated cAMP production by HEK293/EP4 cell line. HEK 293 cells stably transfected with human EP4 cDNA were evaluated for their ability to produce cAMP in response to various concentrations of PGE2. The results (Fig. 2A) show a robust concentration‐dependent response to PGE2 with an EC50 of 0.16 nmol/L and an EC80 0.34 nmol/L. To demonstrate EP4 antagonism, freshly thawed cells were treated first with various concentrations of compounds followed by PGE2 at EC80 concentration. Then the cells were assayed for cAMP production. A representative example of the antagonist activity of the compounds is shown in Figure 2B. Both compounds 1 and 2 completely blocked the PGE2‐generated cAMP in a concentration‐dependent manner with IC50 values of about 6 nmol/L. The activities were comparable to a reference EP4 antagonist, CJ‐023,423 (IC50 = 12 nmol/L). The IC50 of compound 3 was 2.4 nmol/L in a separate assay. All compounds also blocked cAMP production in rat EP4 transfected HEK293 cells with IC50 values comparable to the values against human EP4 receptor (Table 1).
Figure 1.
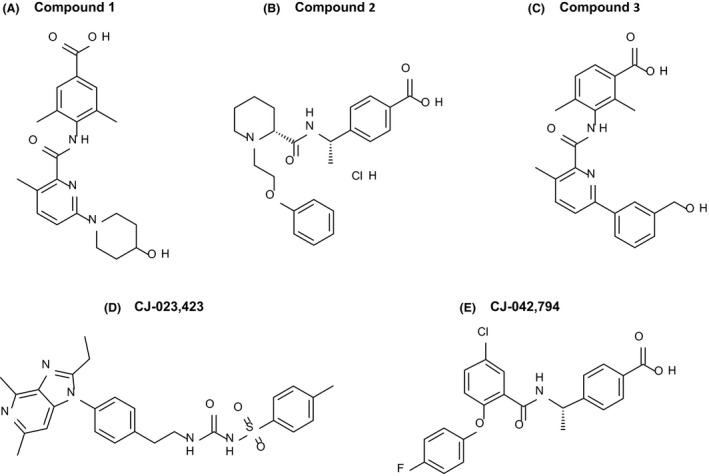
Chemical structure of EP4 antagonists. Compounds 1, 2, and 3 are the newly described EP4 antagonists. CJ‐023,423 and CJ‐042,794 are reference EP4 antagonists.
Figure 2.
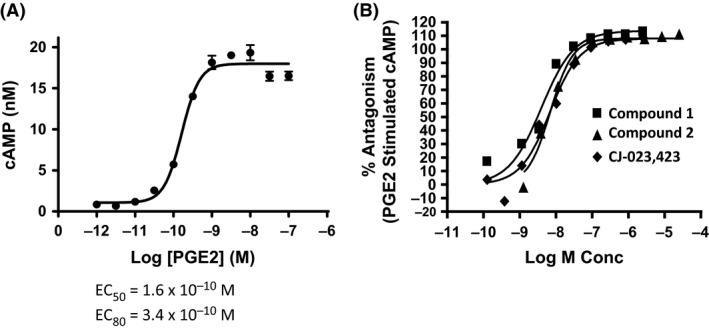
EP4 antagonists block cAMP production in HEK‐EP4 Cells. HEK‐293 cells stably transfected with human EP4 cDNA were treated with various concentrations of PGE2 (Panel A) for 20 min at room temperature and cAMP levels were determined as described in Materials and Methods. To determine the effects of EP4 antagonists, cells were treated with various concentrations of compounds followed by PGE2 at EC80 concentration for 20 min and the cAMP levels were determined. The results are expressed as % inhibition in comparison to cAMP levels obtained at EC80 concentration of PGE2 (Panel B). The figure is a representative of results from experiments of n = 8 for compound‐1, n = 10 for compound‐2 and n = 6 for CJ‐023,423.
Table 1.
Summary of in vitro activities
| Assay | Compound‐1 | Compound‐2 | Compound‐3 | CJ‐023,423 | CJ‐042,794 |
|---|---|---|---|---|---|
| cAMP Antagonism (hEP4) | IC50 (nmol/L) ± SEM | IC50 (nmol/L) ± SEM | IC50 (nmol/L) ± SEM | IC50 (nmol/L) ± SEM | IC50 (nmol/L) ± SEM |
| Human EP4 | 5.6 ± 1.1; n = 8 | 5.6 ± 1.0; n = 10 | 2.4 ± 1.4; n =5 | 11.7 ± 3.0; n = 6 | 4.5 ± 1.85; n = 153 |
| Rat EP4 | 12.3, n = 1 | 15.4; n = 1 | 1.0, n = 1 | 13.1 ± 1.0; n = 5 | 20.6 ± 1.8; n = 20 |
| hEP1‐4 receptor binding | Ki (nmol/L) ± SEM | ||||
| EP1 | >17500; n = 2 | >17500; n = 3 | >17500; n = 1 | >22900; n = 1 | >26700; n = 2 |
| EP2 | >18900; n = 4 | 1210 ± 509; n = 6 | >18900; n = 1 | >21600; n = 2 | 931 ± 457; n = 6 |
| EP3 | >14000; n = 4 | >14000; n = 5 | >14000; n = 1 | >19500; n = 1 | >15500; n = 1 |
| EP4 | 58 ± 12; n = 10 | 41 ± 7; n = 12 | 2.07 ± 1.31; n = 8 | 449 ± 123; n = 8 | 12.6 ± 7.36; n = 6 |
| Human whole blood | IC50 (nmol/L) ± SD | IC50 (nmol/L) ± SD | IC50 (nmol/L) ± SD | IC50 (nmol/L) ± SD | IC50 (nmol/L) ± SD |
| (Reversal of PGE2 Inhibited TNFα) | 123 ± 80; n =8 | 123 ± 88; n =12 | 42 ± 17; n = 9 | 1560 ± 105; n = 79 | 840 ± 630; n = 15 |
Data are expressed as geometric mean ± standard deviation or standard error as noted.
Selectivity of EP4 receptor antagonists
The selectivity of the compounds for EP4 receptor was established by comparing the ability of compounds to block PGE2 binding to various EP receptors (EP1, EP2, EP3, EP4). Membranes were prepared from HEK293 cell lines that express various EP receptors (see materials and methods). Initially, optimal saturation conditions were established for all receptors using various concentrations of 3[H] PGE2. The results shown for EP4 binding indicate the binding was linear and saturable, with minimal non‐specific binding (Figs. 3A and B). We next established homologous competition assay for EP1, EP2, EP3, and EP4 receptors using various concentrations of unlabeled PGE2 and a constant concentration (0.3–0.5 nmol/L) of 3[H] PGE2. The results (Fig. 3D) indicate a close range of Kds for all EP receptors in the over‐expressed cell lines. A representative competition result (Fig. 3C) is shown for EP4 indicating a full inhibition of binding.
Figure 3.
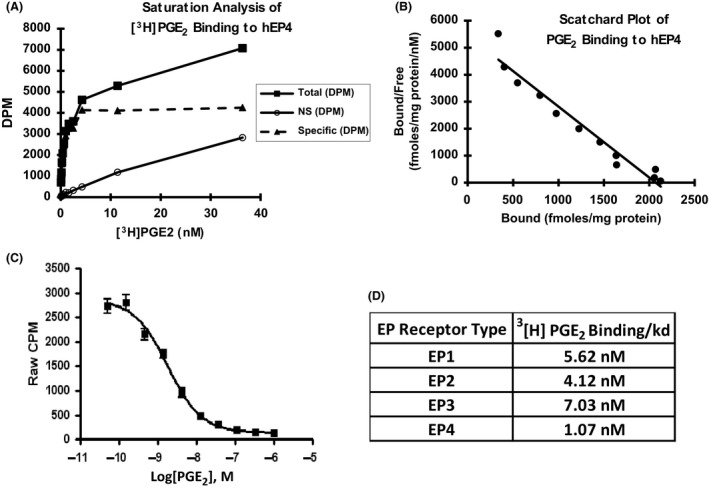
Characterization of EP receptor binding. Membrane preparations from HEK 293 cells transfected either stably (EP1 cDNA or EP4 cDNA) or transiently (EP2 cDNA or EP3 cDNA) were treated with 3[H]PGE2 (0.3–0.5 pM) for 90 min and the radioactive binding was determined (refer to materials and methods). The specific binding was determined by subtracting binding to membrane preparations from HEK 293 cells that contained no EP receptors (Panel A). To further characterize EP4 receptor, HEK293/EP4 cell membrane preparations were treated with various concentrations of unlabeled PGE2 in the presence of constant 3[H]PGE2 and the radioactive binding determined (Panel C). A scatchard analysis of the binding was done as described in materials and methods.(Panel B). Similar studies were conducted with other EP receptors and the results expressed in Panel D.
We next evaluated the ability of Compounds 1, Compound 2 and the reference compound to block 3[H]PGE2 binding to EP4 receptor. The results shown in Figure 4, demonstrate that the compounds are able to fully antagonize 3[H] PGE2 binding. The results of the competitive binding assays using EP receptors are summarized in Table 1. They demonstrate that compounds 1 (Ki = 58 nmol/L), 2 (Ki = 41 nmol/L) are 7–10 times more potent than the reference EP4 inhibitor, CJ‐023,423 (Ki = 449 nmol/L) and that Compound 3 was even more potent with a Ki of 2.05 nmol/L. The results further demonstrate that all the three compounds selectively antagonize PGE2 binding to the EP4 receptor. Compound 2 exhibits a 30 fold weaker affinity for EP2 receptor (K i = 1.2 μmol/L).
Figure 4.
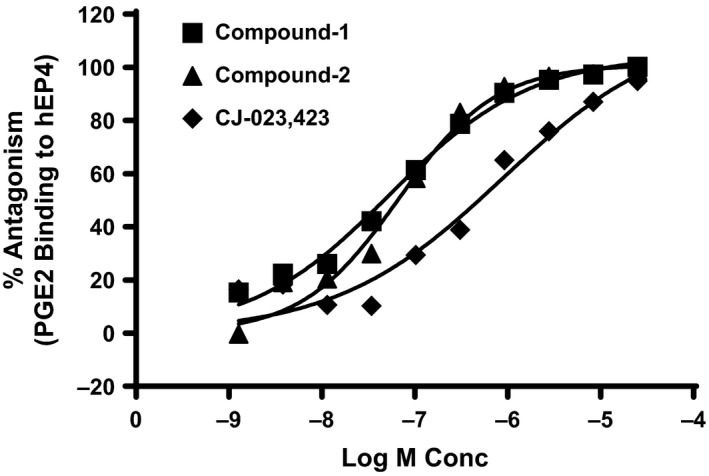
EP4 antagonists block PGE2 Binding to EP4. HEK293/EP4 membrane preparations were treated with a constant concentration (0.3 nmol/L) of [3H]‐PGE2 and various concentrations of indicated compounds for 90 min at room temperature. The results are expressed as % antagonism with membrane preparations that contained no antagonists serving as control (100%). The figure is a representative of results from experiments of n = 10 for compound‐1, n = 12 for compound‐2 and n = 8 for CJ‐023,423.
EP4 antagonists block TNF‐α production in human whole blood
Previous studies have demonstrated that macrophages express EP4 receptors and that PGE2 inhibited LPS stimulated TNF‐α production, which was abolished in EP4‐deficient macrophages (Meha et al. 1997; Nataraj et al. 2001). In addition, EP4 antagonists have been shown to block PGE2 inhibition of TNF‐α in isolated monocytes as well as in whole blood cells (Murase et al. 2008). In order to further validate the activity of EP4 antagonists in a clinically relevant matrix (human whole blood), we evaluated whether compounds 1 and 2 were effective in reversing PGE2 suppression of TNF‐α in the human whole blood assay. Initially, we established optimal conditions demonstrating that LPS stimulated TNF‐α production was suppressed by exogenously added PGE2 and demonstrated that the inhibition was reversed by the reference EP4 antagonist (CJ‐042,794, Fig. 5 A). The results also show that only EP4 antagonist and not other EP receptor antagonists tested (EP1, EP2, and EP3) were effective in blocking PGE2 effects on TNF‐α.production (Fig. 5 B). We next examined the effects of compounds 1 and 2 in the whole blood assay. The results shown in Figure 6 demonstrate that both the compounds blocked PGE2 effects on TNF‐α production in human whole blood. The IC50 values for both compound was 123 nmol/L, and the value for compound 3 was 42 nmol/L (Table 1). The values for the two reference EP4 inhibitors (CJ‐023,423 and CJ‐042,794) were 1560 nmol/L and 840 nmol/L respectively (Table 1).
Figure 5.
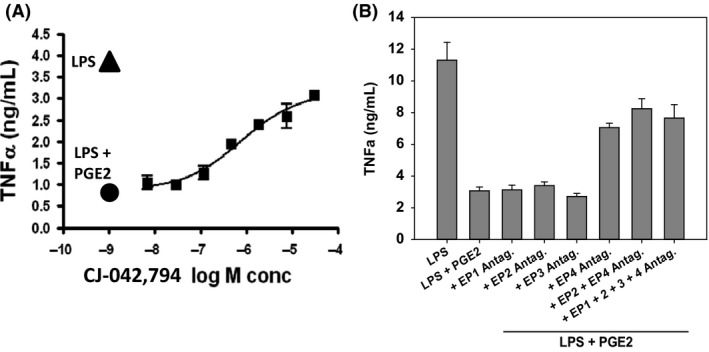
Characterization of EP4 antagonists on PGE 2 inhibition of TNFα production in human whole blood in vitro. The pooled whole blood obtained from normal volunteers was pretreated in triplicate with various concentrations of the reference EP4 antagonist (CJ‐042,794) (Panel A) or 10 μmol/L of EP (1, 2, 3 and 4) antagonists (Panel B) at 37°C, 5% CO2 in a humidified atmosphere, for 30 min, followed by treatment with a final concentration of 10 μg/mL LPS ± 10 nmol/L PGE2 for 24 h 37°C, 5% CO2 in a humidified atmosphere. The plasma was collected by low speed centrifugation of microtiter plates and assayed for TNF‐α levels. Panel A: ▴ LPS control; ●LPS+PGE2; ■ compound + LPS + PGE2; Panel B: TNFα values in the presence of EP (1, 2, 3 and 4) antagonists.
Figure 6.
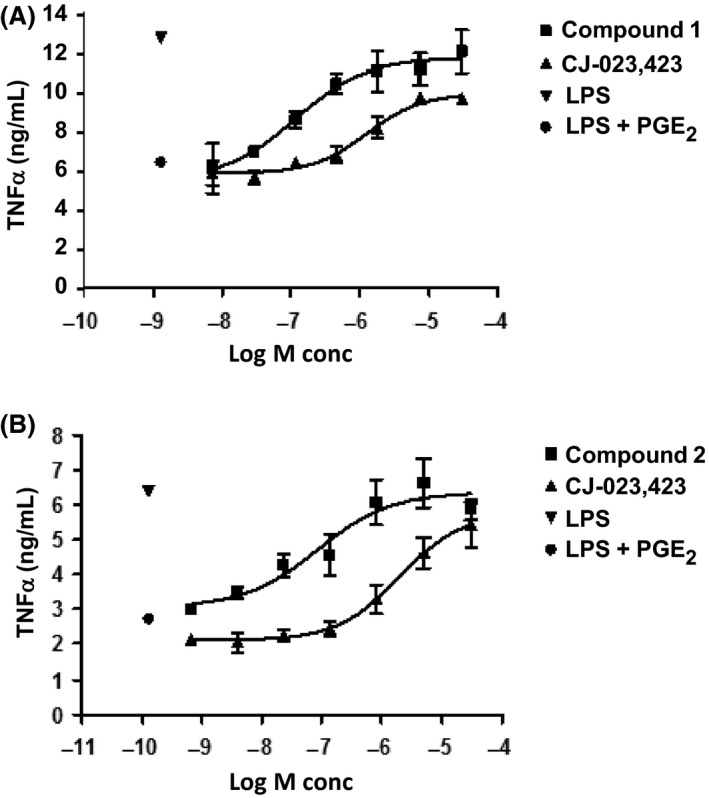
Concentration‐dependent Reversal of PGE2 effects on TNFα production by EP4 antagonists Pooled human whole blood samples (triplicate) from normal volunteers were pre‐treated with various concentrations of compound 1(Panel A), compound 2(Panel B) or reference EP4 inhibitor (CJ‐023,423) for 30 min and TNFα production determined as described in Materials and Methods. The figure is a representative of results from experiments of n = 8 for compound‐1, n = 12 for compound‐2 and n = 79 for CJ‐023,423. Panel A and B: ▾LPS control;● LPS+PGE2;■ compound + LPS + PGE2; ▴ CJ‐023,423 + LPS + PGE2.
EP4 antagonists are efficacious in a rat MIA model of pain
We next evaluated the ability of EP4 inhibitors to block the pain resulting from joint injury caused by the intra‐articular injection of monoiodoacetate. Previous studies have established that the injection of monoiodoacetic acid (MIA) into the knee joint of rats produces an acute inflammatory insult, joint degeneration, and pain (Bove et al. 2003). The pain resulting from the joint injury can be measured via differential weight bearing of the hind legs using an incapacitance tester (Benschop et al., 2014). In order to evaluate the analgesic efficacy, rats were injected with 0.3 mg of MIA on Day 0 and 12 days later were dosed with vehicle, EP4 inhibitors at the indicated doses, or 5 mg/kg of the NSAID diclofenac. The pain was measured using incapacitance testing 30 min (compound 1) or 1 h (compound 2) post dosing. Efficacy was measured by the ability of a compound to partially normalize weight distribution. The results for compound 2 are shown in Figure 7A (compound 1 results have been published previously). Compound 2 was effective at 1, 3, and 10 mg/kg (P < 0.05 by Dunnett's test). with each increasing dose of compound 2 being significantly different from the preceding dose (P < 0.05 by Tukey HSD). Similar results were also achieved with reference EP4 antagonist CJ‐042,794 (Fig. 7B) with the 3, 10, 30, and 50 mg/kg doses being significantly different from vehicle (P < 0.05 by Dunnett's test) and the 30 and 50 mg/kg doses being significantly different from the 1, 3, and 10 doses (P < 0.05 by Tukey HSD).
Figure 7.
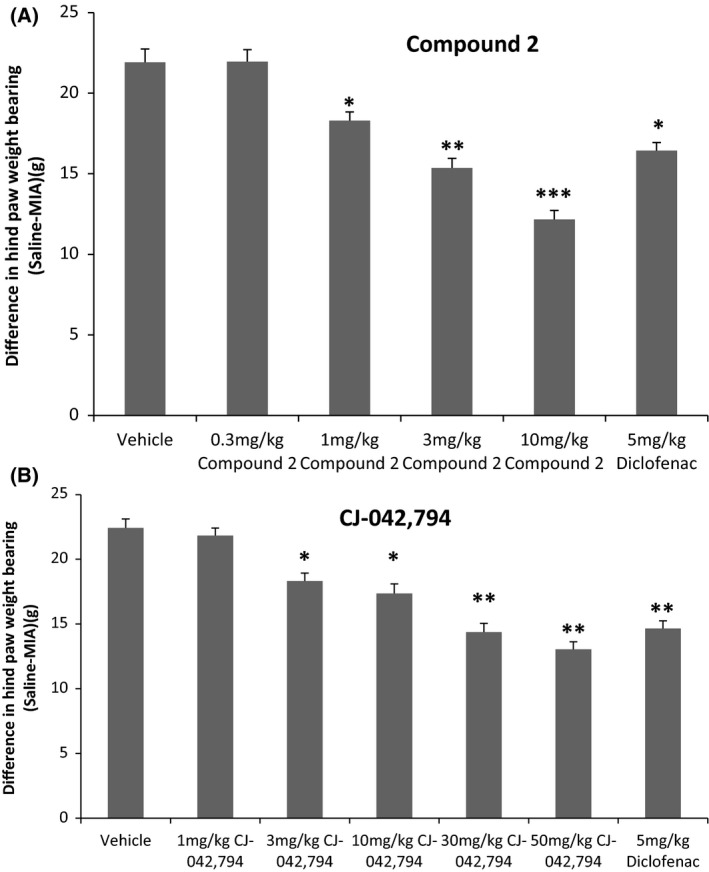
Assessment of pain efficacy in rat MIA model. Rats injected with MIA was treated with various doses of EP4 antagonists (compound 2 or CJ‐042,794) or the NSAID diclofenac (5 mg/kg) and pain was measured 1 h post dosing by an incapacitance test (materials and methods). The data are presented as mean ± SEM where group size n is 4 or 5. Statistical comparison to vehicle: Dunnett's test and between groups Tukey HSD (*/**/***P < 0.05).
Inhibition of Inflammatory response in rat adjuvant AIA by EP4 antagonists
In order to assess the potential anti‐inflammatory effects of EP4 antagonists, the compounds were evaluated in rats injected with complete Freund's adjuvant induced arthritis (AIA) model as described in the methods section. The percent increases in mean paw thickness from Day 11 to Day 15 were calculated as a measure of paw swelling, indicative of the amount of inflammation in the paws measured. Compound‐2 significantly inhibited increases in paw inflammation (swelling) compared to vehicle at all 3 doses tested, as did diclofenac at l0 mg/kg (Fig. 8A; P < 0.05 by Dunnett's test). Results for compound 1 are not shown as they have been published previously (Blanco et al. 2016b). Similar results were also achieved with reference EP4 antagonist CJ‐023,423 (Fig. 8B).
Figure 8.
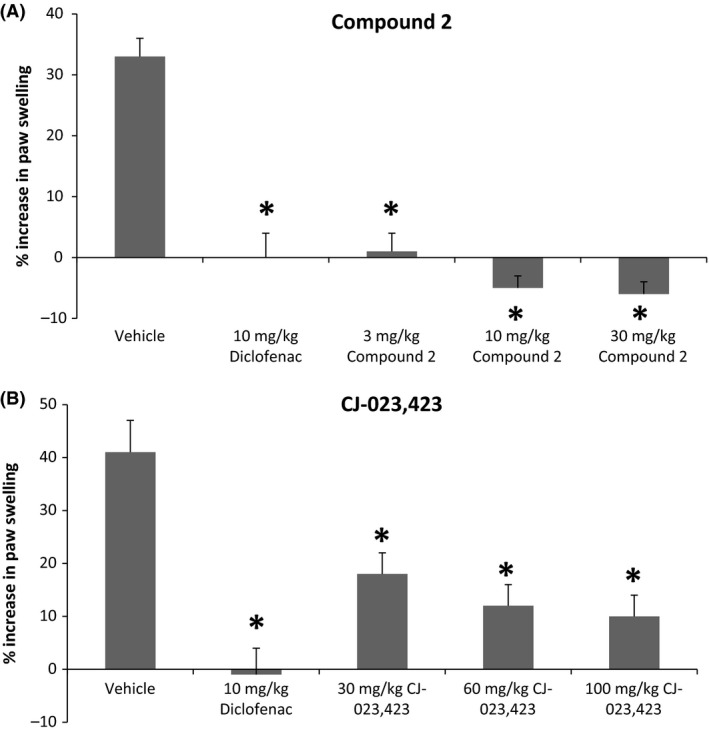
Efficacy in adjuvant induced arthritis model of inflammation. Rats injected with adjuvant for 11 days were treated with various doses of EP4 antagonists (compound 2 or CJ‐023,423) diclofenac, or vehicle for 4 days and the paw width was determined before and after compound treatments. The data are expressed as % increase in paw swelling. The data are presented as mean ± SEM (n = 8). Statistical comparison to vehicle: Dunnett's test (*P < 0.05).
EP4 antagonists are effective in Rat CIA model
Previous studies have shown that PGE2 plays a key role in inflammatory pathway in animal models of autoimmune disease and that the EP4 receptor is critical in mediating the pro‐inflammatory and immune‐modulatory activity leading to the development of arthritis in these models (Smith 1989, Funk 2001; Smyth et al. 2009). We therefore evaluated whether the EP4 antagonists were effective in blocking the disease phenotype in a rat model of type II collagen induced arthritis. Initial evaluation of joints was done by the assessment of ankle thickness which showed significant reduction with all three doses of compound 3 and prednisolone (data not shown). The ankle and knee joints were evaluated histologically for various signs of inflammation and joint destruction (inflammation, pannus, cartilage destruction, and periosteal bone formation) as described before (Levine et al. 2014). As can be seen from figure 9, ankles from animals with CIA and treated with vehicle had overt inflammation, cartilage damage, pannus formation, bone resorption, and periosteal bone formation (Fig. 9). Similar results were seen for the knee joints of vehicle treated animals (data not shown), Animals treated with 10 mg/kg of prednisolone had significant (87–99%) reductions in all ankle scores and a 93% reduction in summed scores (Fig. 9). Similar scores were seen for the knee joint (data not shown). Ankles from animals treated with compound 3 had significant reductions in nearly all parameters and in summed scores at 10 and 30 mg/kg (Fig. 9) Representative photomicrographs of the ankle and knee joints from vehicle, prednisolone, and compound 3 are shown in Figure 10.
Figure 9.
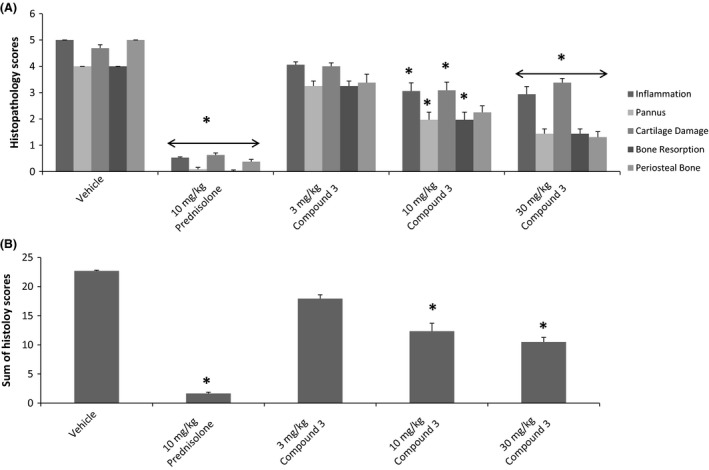
EP4 Antagonists in Collagen II induced arthritis model. Arthritis was induced in rats by intradermal injection of type II collagen as described (Materials and Methods). Treatment with indicated doses of EP4 antagonist (compound 3) or prednisone (10 mg/kg) started on day 11 post collagen injection. After 17 days of treatments, hind paws and knee joints were collected for histology, ankles and knees were assessed for histopathology. Panel A: Individual scores; Panel B: Total histopathological scores; Panel C: Periosteal Bone measure.
Figure 10.
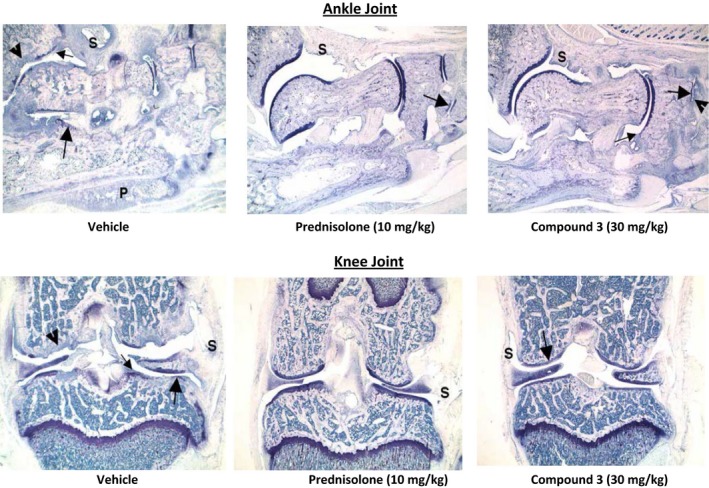
Representative Photomicrographs of Ankle (Top) and Knee (Bottom) joints. Top Panel: Ankle from vehicle control has severe inflammation (s) and cartilage damage (large arrow) with marked pannus (small arrow), bone resorption (arrowhead) and periosteal bone formation (P). Ankle from arthritic animal treated 10 mg/kg prednisolone has minimal inflammation (S) and minimal cartilage damage (large arrow); Ankle from compound 3 treated rats has moderate inflammation (S) and cartilage damage (large arrow), mild pannus (small arrow) and mild periosteal bone formation (P). Bottom Panel: Knee form vehicle control has severe inflammation (S) and cartilage damage (large arrow) with marked pannus (small arrow), bone resorption (arrowhead) and bone resorption (P). Knee from arthritic animal treated 10 mg/kg prednisolone has very minimal inflammation (S) and cartilage damage not visible at this magnification (large arrow); Knee from compound 3 treated rats has minimal inflammation (S) and cartilage damage (large arrow), very minimal pannus (small arrow) and bone formation (P) not visible at this magnification.
Discussion
We report here the identification and pharmacological characterization of novel EP4 antagonists. The molecules representing different chemical scaffolds are highly potent, selective and are effective in (1) blocking PGE2 stimulated cAMP production, (2) radio‐labeled PGE2 binding to EP4 receptors, and in (3) reversing PGE2 mediated modulation of TNF‐α production in human whole blood culture. Furthermore, the molecules were effective in alleviating pain and inflammation associated with rat MIA and AIA models respectively. Finally, an EP4 antagonist also significantly reduced the development of inflammation and tissue destruction in a rat model of collagen type II arthritis.
PGE2 plays a central role in eliciting inflammation associated with arthritic conditions (Ricciotti and Fitzgerald 2011). NSAIDs and coxibs which block PGE2 have been the mainstay in the treatment of the signs and symptoms of arthritis, but have significant safety concerns related to gastro‐intestinal bleeding as well as cardiovascular adverse effects because of the blockage of all prostanoids that play critical roles in normal physiological functions. Therefore, there is a continued interest in developing safer alternatives. Two key approaches have involved by either developing microsomal prostaglandin E synthase inhibitors that selectively block PGE2 or targeting the key PGE2 receptor that is critical in inflammation. In this report, we describe novel agents that block the action of EP4, a PGE2 receptor, which have been implicated as a key driver of inflammation and pain (McCoy et al. 2002).
PGE2 actions are mediated through four distinct G‐protein coupled receptors which are differently distributed in tissues (Coleman et al. 1994;Narumiya et al. 1999; Breyer et al. 2001). The receptors transmit signals via specific G‐proteins that result in the production of distinct mediators (Bos et al. 2004; Narumiya et al. 1999). The EP4 receptor primarily couples to Gs protein resulting in cAMP production. Several lines of evidence suggest that EP4 plays a central role in PGE2 mediated inflammation, pain, and tissue destruction associated with OA and RA. EP4 receptor has been shown to be abundantly expressed in the synovium of a rat adjuvant arthritis model (Kurihara et al. 2001) and in the articular cartilage of human osteoarthritis (Li et al. 2009). Deletion of EP4 but not EP1, EP2, or EP3 resulted in protection against the development of arthritic lesions in a murine autoimmune model of arthritis induced by type II collagen (McCoy et al. 2002). Furthermore, an EP4 antagonist was effective in an auto‐immune model of arthritis by blocking Th1 differentiation and Th 17 expansion (Chen et al. 2010). Selective EP4 receptor antagonists have been shown to be effective in various models of arthritis and pain while EP1 or EP3 antagonists were ineffective (Murase et al. 2008; Nakao et al., 2007, Xu et al. 2008; Chen et al. 2010). More recently, EP4 receptor antagonists have been shown to be effective as an analgesic agent in dogs (Rausch‐Derra et al. 2016). Thus, EP4 receptor antagonists are likely to be effective as anti‐inflammatory and analgesic agents for arthritic patients.
The initial identification of EP4 antagonists was facilitated by a functional assay in which HEK293 cells transfected with human EP4 cDNA produced cAMP upon stimulation with PGE2. EP4 antagonists were effective in blocking cAMP production and demonstrated high potency against EP4 (IC 50 of 2–6 nmol/L). The compounds were also active against rat EP4. Compound 3 exhibited slightly greater potency against both human and rat EP4 receptors in comparison to compounds 1, 2 as well as reference EP4 inhibitors.
The selectivity of the compounds was also established by receptor binding assays using membrane preparations of HEK293 cells transfected with various receptors. The receptors exhibited saturable and reversible binding (Fig. 2). The Ki values for all receptors were comparable under the conditions tested. Compounds demonstrated higher potency for EP4 (K i of 2–40 nmol/L) in comparison to CJ‐023,423 (Ki of 449 nmol/L) and exhibited high selectivity for EP4. Only compound 2 showed activity (approximately 20 fold weaker) for EP2 (Table 1). Compounds showed no discernible activity against several other prostanoid receptors as well as cyclo‐oxygenases 1 and 2 (Table 2).
The activity of EP4 antagonists were also further established using the whole blood assay which provided a more relevant biological matrix (Murase et al. 2008).This assay is based on the following: (1) LPS stimulation of TNF‐α in whole blood is blocked by PGE2 and (2) PGE2 activity is mediated by EP4 as only reference EP4 antagonist, but not other EP receptor (EP1, EP2, EP3) antagonists was effective (Fig. 5). Compounds 1 and 2 demonstrated a dose‐dependent antagonism of PGE2 mediated TNF‐α production with full efficacy (Fig. 6) and were 5–10 times more potent than reference EP4 antagonists (Table 1). Demonstration of activity in a biologically relevant matrix would be helpful to determine biochemical efficacy and to serve as potential biomarker assay to facilitate clinical dose determination.
The analgesic and anti‐inflammatory activities of EP4 antagonists were demonstrated using well‐established rat models that are known to be PGE2 mediated. Coxibs, NSAIDS, and EP4 antagonists have been shown to be effective in reducing rat model of MIA induced pain as well as in adjuvant induced inflammation and arthritic lesions (Burch et al, 2008). Compounds 1 and 2 were effective in both models with compound 2 exhibiting a slightly more efficacy. Type II Collagen induced arthritis model is an auto‐immune model of arthritis in which EP4 receptors have been shown to be critical in the development of polyarthritis (Chen et al. 2010). Furthermore, EP4 receptors have shown to be involved in PGE2 stimulation of Th1 differentiation and Th17 expansion contributing to arthritis and EP4 antagonists were effective in blocking the development of arthritis in a mouse model of type II collagen arthritis (Chen et al. 2010). The EP4 antagonist (compound 3) was highly effective in reducing arthritic lesions in a rat model of type II collagen arthritis as demonstrated by the reduction in quantitative arthritic score for knee joints (Fig. 9) as well as in histopathology of joint (Fig. 10). Collectively these results demonstrate that the EP4 antagonists described here show analgesic, and anti‐inflammatory properties and may be efficacious in treating humans suffering from OA and RA.
In conclusion, we have identified novel EP4 antagonists that are highly selective and potent, and are effective as analgesic and anti‐inflammatory molecules. Traditional NSAIDS and coxibs, while effective, exhibit significant liability because of a variety of side‐effects. EP4 antagonists would be expected to be a safer alternative since it is unlikely to have a direct effect on other prostanoid levels. However, this is speculative and needs to be demonstrated in the clinic. The availability of highly selective and potent molecules should facilitate this possibility.
Author Contribution
Participated in Research Design: Srinivasan Chandrasekhar, Xiao‐Peng Yu, Anita K Harvey, Mark G. Chambers, Matthew J. Fisher. Conducted Experiments: Anita K. Harvey, Xiao‐Peng Yu, Xushan Wang, Jennifer L. Oskins, Chaohua Lin, Alison M. Bendele. Contributed new reagents: Xiao‐Peng Yu, Anita Harvey, Maria‐Jesus Blanco, Tatiana Vetman, Steven L. Kuklish, Jeremy S. York, Matthew A. Schiffler, Matthew J. Fisher, Alan M Warshawsky. Performed data Analysis: Anita K. Harvey, Xiao‐Peng Yu, Xushan Wang, Srinivasan Chandrasekhar, Mark G. Chambers, Alison M. Bendele. Wrote or contributed to the writing: Srinivasan Chandrasekhar, Anita K Harvey, Xiao‐Peng Yu, Mark Chambers. [Correction added on 30 May 2017, after first online publication: The listings of “Conducted Experiments” and “Contributed new reagents” within Author Contribution have been edited to reflect the correct contributors for this paper.]
Disclosure
None declared.
Chandrasekhar S., Yu X.‐P., Harvey A. K., Oskins J. L., Lin C., Wang X., Blanco M.‐J., Fisher M. J., Kuklish S. L., Schiffler M. A., Vetman T., Warshawsky A. M., York J. S., Bendele A. M., Chambers M. G.. Analgesic and anti‐inflammatory properties of novel, selective, and potent EP4 receptor antagonists. Pharma Res Per, 5(3), 2017, e00316, doi: 10.1002/prp2.316
References
- Bendele AM (2001). Animal models of rheumatoid arthritis. J Musculoskel Interact Neuronal Interact 1: 377–385. [PubMed] [Google Scholar]
- Benschop R, Collins EC, Darling RJ, Allan BW, Leung D, Conner EM, et al. (2014). Development of a novel antibody to calcitonin gene‐related peptide for the treatment of osteoarthritis‐related pain. Osteoarthritis and Cartilage 22: 578‐585. [DOI] [PubMed] [Google Scholar]
- Blanco MJ, Vetman T, Chandrasekhar S, Fisher MJ, Harvey A, Mudra D, et al. (2016a). a). Discovery of substituted‐2, 4‐dimethyl‐(naphthalene‐4‐carbonyl) amino‐benzoic acid as potent and selective EP4 antagonists. Bioorg Med Chem Lett 26: 105–109. [DOI] [PubMed] [Google Scholar]
- Blanco MJ, Vetman T, Chandrasekhar S, Fisher MJ, Harvey A, Chambers M, et al. (2016b). b). Discovery of potent aryl‐substituted 3‐[(3‐methylpyridine‐2‐carbonyl) amino]‐2, 4‐dimethyl‐benzoic acid EP4 antagonists with improved pharmacokinetic profile. Bioorg Med Chem Lett 26: 931–935. [DOI] [PubMed] [Google Scholar]
- Blanco MJ, Vetman T, Chandrasekhar S, Fisher MJ, Harvey A, Kuklish SL, et al. (2016c). c). Identification and biological activity of 6‐alkyl‐substituted 3‐methylpyridine‐2‐carbonyl amino dimethyl‐benzoic acid EP4 antagonists. Bioorg Med Chem Lett 26: 2303–2307. [DOI] [PubMed] [Google Scholar]
- Bos CL, Richel DJ, Ritsema T, Peppelenbosch MP, Versteeg HH (2004). Prostanoids and prostanoid receptors in signal transduction. Int J Biochem Cell Biol 36: 1187–1205. [DOI] [PubMed] [Google Scholar]
- Bove SE, Calcaterra SL, Brooker RM, Huber CM, Guzman RE, Juneau PL, et al. (2003). Weight bearing as a measure of disease progression and efficacy of anti‐inflammatory compounds in a model of monosodium iodoacetate‐induced osteoarthritis. Osteoarthritis Cartilage 11: 821–830. [DOI] [PubMed] [Google Scholar]
- Breyer RM, Bagdassarian CK, Myers SA, Breyer MD (2001). Prostanoid receptors: subtypes and signaling. Annu Rev Pharmacol Toxicol 41: 661–690. [DOI] [PubMed] [Google Scholar]
- Burch J, Han Y, Audoly L, Therien AG, Xu D (2008). MF498 [N‐{[4‐(5,9‐Diethoxy‐6‐oxo‐6,8‐dihydro‐7Hpyrrolo[3,4‐g]quinolin‐7‐yl)‐3‐methylbenzyl]sulfonyl}2‐(2‐methoxyphenyl)acetamide], a selective E prostanoid receptor 4 antagonist relieves joint inflammation and pain in rodent models of rheumatoid and osteoarthritis. JPET 325: 425–434. [DOI] [PubMed] [Google Scholar]
- Chandrasekhar S, Harvey AK, Yu X‐P, Chambers MG, Oskins JL, Lin C, et al. (2016). Identification and characterization of novel microsomal prostaglandin E synthase‐1 inhibitors for Analgesia. JPET 356: 635–644. [DOI] [PubMed] [Google Scholar]
- Chen Q, Muramoto K, Masaaki N, Ding Y, Yang H, Mackey M, et al. (2010). A novel antagonist of the prostaglandin E2 EP4 receptor inhibits Th1 differentiation and Th17 expansion and is orally active in arthritis models. British J Pharmacol 160: 292–310. [DOI] [PMC free article] [PubMed] [Google Scholar]
- Clark P, Rowland SE, Denis D, Mathieu M‐C, Stocco R, Poirier H, et al. (2008). MF498 [N‐{[4‐(5,9‐Diethoxy‐6‐oxo‐6,8‐dihydro‐7Hpyrrolo[3,4‐g]quinolin‐7‐yl)‐3‐methylbenzyl]sulfonyl}2‐(2‐methoxyphenyl)acetamide], a selective E prostanoid receptor 4 antagonist, relieves joint inflammation and pain in rodent models of rheumatoid and osteoarthritis. JPET 325: 425–434. [DOI] [PubMed] [Google Scholar]
- Coleman RA, Smith WL, Narumiya S (1994). International Union of Pharmacology classification of prostanoid receptors: properties, distribution, and structure of the receptors and their subtypes. Pharmacol Rev 46: 205–229. [PubMed] [Google Scholar]
- Ducharme Y, Blouin M, Carriere MC, Chateauneuf A, Cote B, Denis D, et al. (2005). 2,3‐Diarylthiophenes as selective EP1 receptor antagonists. Bioorg Med Chem Lett 15: 1155–1160. [DOI] [PubMed] [Google Scholar]
- FitzGerald GA (2003). COX‐2 and beyond: approaches to prostaglandin inhibition in human disease. Nat Rev Drug Discov 2: 879–890. [DOI] [PubMed] [Google Scholar]
- Fitzgerald GA (2004). Coxibs and cardiovascular disease. N Engl J Med 351: 1709–1711. [DOI] [PubMed] [Google Scholar]
- FitzGerald GA, Patrono C (2001). The coxibs, selective inhibitors of cyclooxygenase‐2. N Engl J Med 345: 433–442. [DOI] [PubMed] [Google Scholar]
- Flavahan NA (2007). Balancing prostanoid activity in the human vascular system. Trends Pharmacol Sci 28: 106–110. [DOI] [PubMed] [Google Scholar]
- Funk CD (2001). Prostaglandins and leukotrienes: advances in eicosanoid biology. Science 294: 1871–1875. [DOI] [PubMed] [Google Scholar]
- Gardner DL (1994). Problems and paradigms in joint pathology. J Anat 184: 465–476. [PMC free article] [PubMed] [Google Scholar]
- Jakobsson PJ, Thorén S, Morgenstern R, Samuelsson B (1999). Identification of human prostaglandin E synthase: a microsomal, glutathione‐dependent, inducible enzyme, constituting a potential novel drug target. Proc Natl Acad Sci (USA) 96: 7220–7225. [DOI] [PMC free article] [PubMed] [Google Scholar]
- Juteau H, Gareau Y, Labelle M, Sturino CF, Sawyer N, Tremblay N, et al. (2001). Structure‐activity relationship of cinnamic acylsulfonamide analogues on the human EP3 prostanoid receptor. Bioorg Med Chem 9: 1977–1984. [DOI] [PubMed] [Google Scholar]
- Kurihara Y, Endo H, Akahoshi T, Kondo H (2001). Up‐regulation of prostaglandin E receptor EP2 and EP4 subtypes in rat synovial tissues with adjuvant arthritis. Clin Exp Immunol 123: 323–330. [DOI] [PMC free article] [PubMed] [Google Scholar]
- Levine YA, Koopman FA, Faltys M, Caravaca A, Bendele A, Zitnik R, et al. (2014). Neurostimulation of the cholinergic anti‐inflammatory pathway ameliorates disease in rat collagen‐induced arthritis. PLoS ONE 11(9): e104530. [DOI] [PMC free article] [PubMed] [Google Scholar]
- Li X, Ellman M, Muddasani P, Wang JH‐C, Cs‐Szabo G, van Wijnen AJ, et al. (2009). Prostaglandin E2 and Its Cognate EP receptors control human adult articular cartilage homeostasis and are linked to the pathophysiology of osteoarthritis. Arthritis Rheum 60: 513–523. [DOI] [PMC free article] [PubMed] [Google Scholar]
- McCoy JM, Wicks JR, Audoly LP (2002). The role of prostaglandin E2 receptors in the pathogenesis of rheumatoid arthritis. J Clin Invest 110: 651–658. [DOI] [PMC free article] [PubMed] [Google Scholar]
- Meha KK, Barnes PJ, Giembycg MA (1997). Characterization of the prostanoid receptor(s) on human blood monocytes at which prostaglandin E2 inhibits lipo‐polysaccharide induced tumour‐necrosis factor –α generation. Brit JPharmacol 122: 149–157. [DOI] [PMC free article] [PubMed] [Google Scholar]
- Murase A, Taniguchi Y, Tonai‐Kachi H, Nakao K, Takada J (2008). In vitro pharmacological characterization of CJ‐042,794, a novel, potent, and selective prostaglandin EP4 receptor antagonist. Life Sci 82: 226–232. [DOI] [PubMed] [Google Scholar]
- Nakao K, Okumura Y, Matsumizu M, Uneo N, Hashizume Y, Kato T, et al. (2002). Aryl or Heteroaryl Fused Imidazole Compounds as intermediates for Anti‐Inflammatory and Analgesic Agents. PCT Application WO 200232900 A2, Example 1
- Nakao K, Murase A, Ohshiro H, Okumura T, Taniguchi K, Murata Y, et al. (2007). CJ‐023,423 (N‐[({2‐[4‐(2‐ethyl‐4, 6‐dimethyl‐1H‐imidazo [4, 5–c] pyridin‐1‐yl) phenyl] ethyl} amino) carbonyl]‐4‐methylbenzenesulfonamide), a novel, potent and selective prostaglandin EP4 receptor antagonist with antihyperalgesic properties. JPET 322: 686–694. [DOI] [PubMed] [Google Scholar]
- Narumiya S, Sugimoto Y, Ushikubi F (1999). Prostanoid receptors: structures, properties, and functions. Physiol Rev 79: 1193–1226. [DOI] [PubMed] [Google Scholar]
- Nataraj C, Thomas DW, Tilley SL, Nguyen M, Mannon R, Koller BH, et al. (2001). Receptors for prostaglandin E2 that regulate cellular immune response in the mouse. JPET 108: 1229–1235. [DOI] [PMC free article] [PubMed] [Google Scholar]
- Portanova JP, Zhang Y, Anderson GD, Hauser SD, Masferrer JL, Seibert K, et al. (1996). Selective neutralization of prostaglandin E2 blocks inflammation, hyperalgesia, and interleukin 6 production in vivo. J Exp Med 184: 883–891. [DOI] [PMC free article] [PubMed] [Google Scholar]
- Rainsford KD (2007). Anti‐inflammatory drugs in the 21st century. Subcell Biochem 42: 3‐27. [DOI] [PubMed] [Google Scholar]
- Rausch‐Derra LC, Huebner M, Rhodes L (2016). A prospective, randomized, masked, placebo‐controlled multisite clinical study of grapiprant, an EP4 prostaglandin receptor antagonist (PRA), in dogs with osteoarthritis. J Vet Int Med 30: 756–763. [DOI] [PMC free article] [PubMed] [Google Scholar]
- Ricciotti E, FitzGerald GA (2011). Prostaglandins and inflammation. Arterioscler Thromb Vasc Biol 31: 986–1000. [DOI] [PMC free article] [PubMed] [Google Scholar]
- Schiffler MA, Chandrasekhar S, Fisher MJ, Harvey A, Kuklish SL, Wang XS, et al. (2015). Discovery and characterization of a potent and selective EP 4 receptor antagonist. Bioorg Med Chem Lett 25: 3176–3178. [DOI] [PubMed] [Google Scholar]
- Skerratt SE, Dack KN (2009). Azetidines as EP2 Antagonists. PCT Application WO 2009063365 A1, Example 29.
- Smyth EM, Grosser T, Wang M, Yu Y, FitzGerald GA (2009). Prostanoids in health and disease. J Lipid Res 50(Supplement): S423–S428. [DOI] [PMC free article] [PubMed] [Google Scholar]
- Smith WL (1989). The eicosanoids and their biochemical mechanisms of action. Biochem J 259: 315‐324. [DOI] [PMC free article] [PubMed] [Google Scholar]
- Sokolove J, Lepus CM (2013). Role of inflammation in the pathogenesis of osteoarthritis: latest findings and interpretations. Ther Adv Musculoskelet Dis 5: 77–94. [DOI] [PMC free article] [PubMed] [Google Scholar]
- Sugimoto Yukihiko, Narumiya Shuh (2007). Prostaglandin E receptors. J Biol Chem 282: 11613–11617. [DOI] [PubMed] [Google Scholar]
- Trebino CE, Stock JL, Gibbons CP, Naiman BM, Wachtmann TS, Umland JP, et al. (2003). Impaired inflammatory and pain responses in mice lacking an inducible prostaglandin E synthase. Proc Nat Acad Sci (USA) 100: 9044–9049. [DOI] [PMC free article] [PubMed] [Google Scholar]
- Xu D, Rowland SE, Clark P, Giroux A, Bernard Cote C, Guiral S, et al. (2008). MF‐63 [2‐(6‐Chloro‐1H‐phenanthro[9,10d]imidazol‐2‐yl)‐isophthalonitrile], a selective microsomal prostaglandin E synthase‐1 inhibitor, relieves pyresis and pain in preclinical models of inflammation. JPET 326: 754–763. [DOI] [PubMed] [Google Scholar]
- Yamagishi T, Okumura Y, Nukui S, Nakao K (2005). Phenyl or Pyridyl Amide Compounds as Prostaglandin E2 Antagonists. PCT Application WO 2005021508 A: Example 68.


