

Abstract
Background:
Alpha-smooth muscle actin (α-SMA) is an isoform of actin, positive in myofibroblasts and is an epithelial to mesenchymal transition (EMT) marker. EMT is a process by which tumor cells develop to be more hostile and able to metastasize. Progression of tumor cells is always followed by cell composition and extracellular matrix component alteration. Increased α-SMA expression and collagen alteration may predict the progressivity of ovarian neoplasms.
Objective:
The aim of this research was to analyse the characteristic of α-SMA and collagen in tumor cells and stroma of ovarian neoplasms. In this study, PCNA (proliferating cell nuclear antigen) expression was also investigated.
Methods:
Thirty samples were collected including serous, mucinous, endometrioid, and clear cell subtypes. The expression of α-SMA and PCNA were calculated in cells and stroma of ovarian tumors. Collagen was detected using Sirius Red staining and presented as area fraction.
Results:
The overexpressions of α-SMA in tumor cells were only detected in serous and clear cell ovarian carcinoma. The histoscore of α-SMA was higher in malignant than in benign or borderline ovarian epithelial neoplasms (105.3±129.9 vs. 17.3±17.1, P=0.011; mean±SD). Oppositely, stromal α-SMA and collagen area fractions were higher in benign than in malignant tumors (27.2±6.6 vs 20.5±8.4, P=0.028; 31.0±5.6 vs. 23.7±6.4, P=0.04). The percentages of epithelial and stromal PCNA expressions were not significantly different between benign and malignant tumors.
Conclusion:
Tumor cells of serous and clear cell ovarian carcinoma exhibit mesenchymal characteristic as shown by α-SMA positive expression. This expression might indicate that these subtypes were more aggressive. This research showed that collagen and α-SMA area fractions in stroma were higher in benign than in malignant neoplasms.
Keywords: Ovarian neoplasm, α-SMA, collagen, PCNA, epithelial to mesenchymal transition
Introduction
Alpha-SMA is an actin isoform that plays an important role in fibrogenesis. Alpha-SMA can be found in smooth muscle cells, myofibroblasts, and blood vessels (Cherng et al., 2008; Shinde et al., 2016). Alpha-SMA correlates with activation of fibroblast to myofibroblast. Myofibroblasts differ from fibroblasts because of its contractile ability. The phenotype of myofibroblast in expressing α-SMA and producing extracellular matrix compound is regulated by transforming growth factor-beta (TGF-beta) (Grotendorst et al., 2004; Sun et al., 2016). Contractile properties of myofibroblast are associated with α-SMA expression and are involved in inflammation, wound healing, fibrosis, and carcinogenesis (Rao et al., 2014). Carcinoma cells that transform to mesenchymal cells also express α-SMA (Kalluri and Weinberg, 2009; Enescu et al., 2014). Alpha-SMA expression was noted to be higher in serous borderline ovarian tumors that invade omentum compared to non-invasive (Lee et al., 2006). Alpha-SMA, together with vimentin, E-cadherin, and fibronectin are the markers for the epithelial to mesenchymal transition (EMT) process. The EMT is considered as one of the steps involved in normal cells to become cancerous (Kalluri and Weinberg, 2009).
PCNA proteins have been recognized as an essential contributor of DNA replication in cell division. The expression of this substance was established in normal cells and several malignant neoplasm cells. Their prognostic and predictive values have been assessed to conclude their role in the diagnosis of cancer, yet the results were various (Han et al., 2015; Li et al., 2015; Jurikova et al., 2016).
Collagen is the most abundant protein found in the extracellular matrix of the tissue. Collagen plays an important role in maintaining tissue structural integrity. It also determines whether a tissue can function properly or not (Rich and Whittaker, 2005). Changes due to the extracellular matrix remodeling and degradation of collagen are considered to play a role in the development of tumor cells. Collagen alters the microenvironment around tumor cells to release biochemical signals which will be responded to by tumor cells and stromal cells (Fang et al., 2014). The combination of picrosirius red staining, circularly polarized light, and hue analysis provides a powerful tool for the structural analysis of collagen fibers (Rich and Whittaker, 2005).
Studies of α-SMA, collagen, and PCNA in epithelial ovarian neoplasms are still limited. Thus, this study aimed to observe the expression of α-SMA, collagen, and PCNA in epithelial ovarian neoplasms by histochemical and immunohistochemical methods.
Materials and Methods
Tissue samples from patients
Institutional Review Board approval was given from Medical Faculty Universitas Gadjah Mada before conducting this study. All samples of ovarian epithelial neoplasm tissues used in this research consisted of 12 benign or borderline ovarian epithelial neoplasm tissues (40%) and 18 ovarian carcinoma tissues (60%). Histopathological subtype of benign or borderline samples included 5 serous (41.7%) and 7 mucinous (58.3%) subtypes. Additionally, the histopathological subtypes of malignant samples involved 8 serous (26.7%), 3 mucinous (10%), 4 endometrioid (13.3%) and 3 clear cell (10%) subtypes. The malignancy of all samples was determined by two pathologists of Medical Faculty Universitas Gadjah Mada, Indonesia. The age of the patients ranged from 15 to 71 y (mean age 48.33 y), which consisted of 5 patients whose ages were less than 45 y and 25 patients who attained the age of 45 y or more. The median age of the patients with malignant neoplasms tended to be slightly older than those with benign neoplasms (50 vs. 48.5 y).
Immunohistochemistry
Tissue sampling in this research was processed to be formalin-fixed paraffin-embedded tissue blocks. The paraffin-embedded tissue was placed in 10% buffer formalin that was cut into 4 μm sections. Next the four-mm paraffin sections were deparaffinized and stained with Hematoxyllin-Eosin to examine the histopathology of the neoplasms.
For immunohistochemistry analysis, paraffin-embedded tissues were used with the antibody α-SMA (eBioscience, Tokyo, Japan) and PCNA (Santa Cruz, Tokyo, Japan). The 4-μm paraffin sections were placed on poly-L-Lysine coated slides. After being deparaffinized, endogenous peroxidase was reduced by incubating with 3% hydrogen peroxidase in phosphate buffer saline (PBS) for 5 minutes. The secondary antibodies used were EnVision + System HRP anti rabbit (K4002, Dako, Tokyo, Japan) for α-SMA and PCNA. Diaminobenzidine was used as chromogen. Finally for counterstaining we used hematoxylin.
Evaluation of immunostaining
Positively stained carcinoma cells were counted on 10 representative fields with x40 magnification (Olympus CX22 microscope) for assessing the stain of α-SMA and PCNA. The result of immunohistochemistry staining was counted using the method described by Khatun et al.. A mean percentage of positive cancer cells was calculated and the staining intensity was classified as 0-3 (0, no staining; 1, slight staining; 2, medium staining; and 3, strong staining).
Then, histoscore was used to calculate positively expressed α-SMA in epithelial cells: (mean percentage) x (intensity + 1); range 0-400) (Khatun et al., 2003; Mikami et al., 2006). Alpha-SMA that positively expressed in stromal cells was counted by using fraction area in Image J software.
PCNA was expressed in the nuclei of the cells and the score was counted as stained nuclei among the total number of tumor nuclei in 10 representative high power field (x40 magnification). PCNA score was shown as a percentage that ranged from 0% to 100%.
Histochemical staining with Sirius Red
For Sirius red staining, 1% picric acid solution and picosirius red solution were used. Paraffin blocks were deparaffinized with xylene then hydrated with absolute alcohol (5 times) and running water. After that, the sections were soaked in picosirius red solution for 1 hour and hydrated again using absolute alcohol and xylene. Then the preparations were incubated at room temperature for 24 hours.
To evaluate Sirius red-stained sections, an Olympus CX22 microscope was used. The preparation’s pictures were taken manually in at least 10 representative fields with x40 magnification. Sirius red was positively expressed in stromal and analyzed by using fraction area in Image J software.
Statistical analysis
Categorical variables were analyzed using χ2 test or Fisher’s exact test, while continuous variables were evaluated by Independent-Samples T Test or Mann Whitney Test. Values of P < 0.05 were considered statistically significant.
Results
Immunohistochemical characteristics of α-SMA and PCNA in ovarian epithelial neoplasm
Figure 1 showed the result of immunohistochemical staining of α-SMA, both in malignant and in benign ovarian neoplasms. Alpha-SMA was not expressed in the tumor cells of mucinous and serous cystadenoma. The histoscore of α-SMA was higher in the cytoplasm of malignant than in benign or borderline ovarian epithelial neoplasms’ cells (105.3±129.9 vs. 17.3±17.1, P=0.011; mean±SD of α-SMA) (fig.4). The expression of α-SMA was detected in the cells’ cytoplasm of serous and clear cell cystadenocarcinoma but not detected in the other subtypes. Meanwhile, α-SMA revealed higher expression in the stroma of benign tumor than malignant tumor (27.2±6.6 vs 20.5±8.4, P=0.028) (fig.4). Both percentages of epithelial and stromal PCNA presented no significant statistical difference both in benign and malignant tumors (72.2±27.1 vs. 72.2±26.1, P=0.99; 23.5±24.1 vs. 27.8±17.3, P=0.61; mean±SD of epithelial and stromal PCNA percentages, respectively) (Fig. 4). Some of mucinous cystadenocarcinomas obviously had higher expression of PCNA than mucinous cystadenoma as shown in Figure 2.
Figure 1.

Immunohistochemical Staining of α-SMA. The overexpression of α-SMA was detected in some subtypes of malignant ovarian epithelial tumor i.e. serous (D) and clear cell cystadenocarcinoma (F). Meanwhile, benign ovarian epithelial tumor i.e. mucinous (A) and serous (B) cystadenoma did not express α-SMA as shown, so did the mucinous (C) and endometrioid (E) cystadenocarcinoma
Figure 4.

Stromal and Epithelial PCNA (A and B) percentages, fraction areas of sirius red (C) and stromal α-sma (D), and epithelial α-sma histoscore (E) in ovarian neoplasms classified according to malignancy. ∤, ∤∤, ∤∤∤ p<0.05
Figure 2.
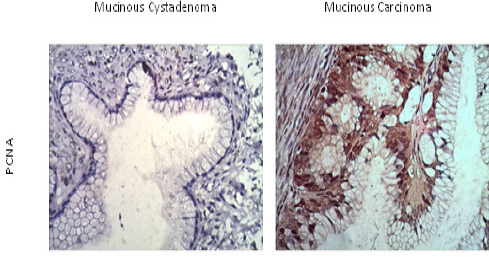
Immunohistochemical Staining of PCNA in Ovarian Epithelial Neoplasms. PCNA was overexpressed in mucinous carcinoma (B). Some epithelial cells of mucinous cystadenoma (A) also expressed PCNA
Histochemical staining of Sirius red
Figure 3 presented the result of Sirius red staining in serous cystadenoma and serous cystadenocarcinoma. Mean of fraction areas that positively expressed for Sirius red staining was higher in benign/ borderline neoplasm than in malignant neoplasm (31.0±5.6 vs. 23.7±6.4, P=0.04) (Figure 4). Mean percentage of endometrioid and clear cell cystadenocarcinoma collagen fraction areas were the lowest among all of the epithelial ovarian neoplasm subtypes used in this study, as shown in Figure 5.
Figure 3.

Sirius Red Staining of Ovarian Epithelial Neoplasms. Staining of serous cystadenocarcinoma (B) looked thinner than serous cystadenoma (A)
Figure 5.
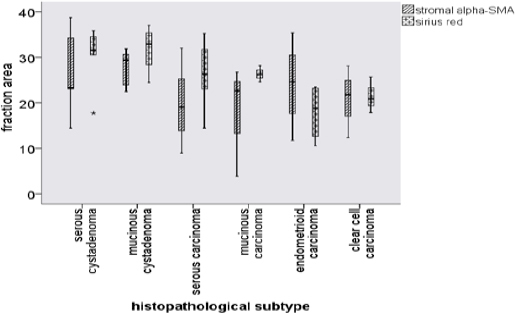
Fraction area of Stromal α-SMA and Sirius Red for Each Pathological Subtypes of Ovarian Epithelial Neoplasm. In sirius red staining, serous and mucinous cystadenoma were positively higher than malignant subtypes. Fraction area of stromal α-SMA in malignant subtypes were also detected less than the benign
Table 1.
Baseline Characteristics of the Patients (n = 30)
| Characteristic | No. of patients (%) |
|---|---|
| Age (y) | 15-71 (median 49.5) |
| < 45 y.o | 5 (50) |
| ≥ 45 y.o | 25 (50) |
| Malignancy | |
| Benign/borderline | 12 (40) |
| Serous cystadenoma | 5 (16.7) |
| Mucinous cystadenoma | 7 (23.3) |
| Malignant | 18 (60) |
| Serous carcinoma | 8 (26.7) |
| Mucinous carcinoma | 3 (10) |
| Endometrioid carcinoma | 4 (13.3) |
| Clear cell carcinoma | 3 (10) |
Discussion
The process of normal cell to become malignant can be divided into four steps, (1) initiation, (2) progression, (3) epithelial to mesenchymal transition (EMT), and (4) metastasize. In EMT, the gene expression pattern changes and the cells will obtain mesenchymal phenotype (Jinka et al., 2012; Ding et al., 2014). They tend to invade the surrounding tissue and infiltrate blood vessels (Jinka et al., 2012). Alpha-SMA is expressed by tumor cells carcinoma. Tumor cells that express α-SMA are predicted to be the cells that have the invasive nature, tend to metastasize, and have poorer prognosis (Lee et al., 2006; Choi et al., 2013; Parikh et al., 2014). Alpha-SMA expression was also positive in the surrounding stroma of tumor cell nests of serous ovarian carcinoma that metastasize to the peritoneum (Lee et al., 2006). In the present study, we found that α-SMA was expressed in the tumor cells of serous and clear cell ovarian carcinoma. This finding might indicate that these subtypes have distinct behavior with the other subtypes. They could be more invasive and tend to metastasize.
Our results showed higher expression of α-SMA in malignant ovarian neoplasm cells compared with that in benign tumors. Oppositely with the stroma, the benign tumor had higher expression of α-SMA compared to the malignant tumor. Previous research established that alpha-SMA was not expressed in normal ovarian surface epithelium (Kobayashi et al., 1993). Regardless the location whether in tumor cells or in stroma, α-SMA expression was higher in benign ovarian tumors compared to malignant tumors. The main source of high α-SMA expression in benign ovarian tumor was blood vessels and myofibroblasts in the stroma. One previous study showed that the expression of α-SMA was positive in the blood vessels and stroma surrounding the tumor cells, but not in cells of epithelial tumors. The explanation for this result was the differences of blood vessels’ maturity. Blood vessels in benign tumors were more mature than in malignant tumors, which results from angiogenesis. The myofibroblasts of the stroma surrounding the tumor cell were also more abundant in benign ovarian tumors thus involving the higher α-SMA expression. Alpha-SMA expression was considered to be predictive factor for prognosis in ovarian tumor (Kobayashi et al., 1993). The present study revealed similar results that were explained in the previous study.
The extracellular matrix surrounding tumor cells undergoes changes along with tumor progression. Extensive changes of the normal extracellular matrix into the matrix of the tumor consists of degradation of matrix components and/or new synthesis of matrix components that are not found in normal tissue (Ricciardelli and Rodgers, 2006). The production of extracellular matrix components is increased in the stroma surrounding the tumor cell. Stromal tumor has an abundant amount of immune cells, endhotelin, and fibroblasts. Due to the effects of mass suppression by tumor cells, fibroblasts in the stroma undergo differentiation and obtain the phenotype resembling myofibroblast. Fibroblasts which have this myofibroblast phenotype produce reactive stroma which has different characteristics from stroma in normal cells. Stromal tumor has a number of ED-A fibronectin, tenascin-C, and type I collagen (Shieh, 2011). Increased production of extracellular matrix components is associated with poor prognosis in ovarian carcinoma (Labiche et al., 2010).
There is an increase of collagen type III intensity and decrease in type I collagen in benign ovarian tumors. The production of collagen in benign ovarian tumor is the result of the fibroblasts. Although in malignant ovarian tumors the synthesis of collagen increases, the total collagen decreases if compared to benign tumors (Ricciardelli and Rodgers, 2006). This change is because in the malignant tumor there is degradation of extracellular matrix components in the stroma, because of the presence of matrix metalloproteinase enzymes (Kamat et al., 2006). Changes in the structure of collagen that induce the interaction between tumor cells and stroma mark the initiation of the process of EMT (Motrescu et al., 2008). Degradation and redeposition of collagen in the stroma regulate the microenvironment around the tumor. Collagen is a physical barrier against invasion of tumor cells, but it is also known in inducing infiltration, angiogenesis, invasion, and migration of tumor cells (Fang et al., 2014).
In this study PCNA expression showed no significant statistical difference between benign and malignant tumors. Thus we still could not conclusively determine what role PCNA has in epithelial ovarian carcinoma’s cell proliferation and aggressivity. However, previous studies showed the association of poor prognosis of cancer and positive PCNA expression (Berny et al., 2004; Barboza et al., 2005; Han et al., 2015; Li et al., 2015).
In summary, our findings suggest that α-SMA might affect the biological tumor behavior of epithelial ovarian neoplasms. Furthermore, serous and clear cell carcinoma might have higher aggressivity compared with the other subtypes because they express α-SMA which is one of the epithelial to mesenchymal markers. Future study should also focus on α-SMA as a prognostic marker and targeted therapy in ovarian cancer.
Acknowledgements
The authors would like to thank Mrs. Agustin, Mrs. Mulyani, Mr. Atpana, and Mr. Mulyana for technical support, and Klinik Bahasa for grammatical editing.
Grant sponsor: Ministry of Research, Technology, and Higher Education, Indonesia.
References
- Barboza CA, Pereira Pinto L, Freitas Rde A, et al. Proliferating cell nuclear antigen (PCNA) and p53 protein expression in ameloblastoma and adenomatoid odontogenic tumor. Braz Dent J. 2005;16:56–61. doi: 10.1590/s0103-64402005000100010. [DOI] [PubMed] [Google Scholar]
- Berny W, Weiser A, Markowska-Woyciechowska A, et al. Analysis of PCNA, Ki67, AgNOR and p53 expression in brain glial tumors. Neurol Neurochir Pol. 2004;38:457–63. [PubMed] [Google Scholar]
- Cherng S, Young J, Ma H. Alpha-smooth muscle actin (α-SMA) J Am Sci. 2008;4:10. [Google Scholar]
- Choi SY, Sung R, Lee SJ, et al. Podoplanin, alpha-smooth muscle actin or S100A4 expressing cancer-associated fibroblasts are associated with different prognosis in colorectal cancers. J Korean Med Sci. 2013;28:1293–301. doi: 10.3346/jkms.2013.28.9.1293. [DOI] [PMC free article] [PubMed] [Google Scholar]
- Ding L, Zhang Z, Shang D, et al. alpha-Smooth muscle actin-positive myofibroblasts, in association with epithelial-mesenchymal transition and lymphogenesis, is a critical prognostic parameter in patients with oral tongue squamous cell carcinoma. J Oral Pathol Med. 2014;43:335–43. doi: 10.1111/jop.12143. [DOI] [PubMed] [Google Scholar]
- Enescu A, Enescu AS, Florou C, et al. E-cadherin and alpha-SMA expression in the epithelial-mesenchymal transition of salivary glands pleomorphic adenomas. Rom J Morphol Embryol. 2014;55:1383–7. [PubMed] [Google Scholar]
- Fang M, Yuan J, Peng C, et al. Collagen as a double-edged sword in tumor progression. Tumour Biol. 2014;35:2871–82. doi: 10.1007/s13277-013-1511-7. [DOI] [PMC free article] [PubMed] [Google Scholar]
- Grotendorst GR, Rahmanie H, Duncan MR. Combinatorial signaling pathways determine fibroblast proliferation and myofibroblast differentiation. FASEB J. 2004;18:469–79. doi: 10.1096/fj.03-0699com. [DOI] [PubMed] [Google Scholar]
- Han YH, Gao B, Huang JH, et al. Expression of CD147, PCNA, VEGF, MMPs and their clinical significance in the giant cell tumor of bones. Int J Clin Exp Pathol. 2015;8:8446–52. [PMC free article] [PubMed] [Google Scholar]
- Jinka R, Kapoor R, Sistla PG, et al. Alterations in Cell-Extracellular Matrix Interactions during Progression of Cancers. Int J Cell Biol. 2012;2012:219196. doi: 10.1155/2012/219196. [DOI] [PMC free article] [PubMed] [Google Scholar]
- Jurikova M, Danihel L, Polak S, et al. Ki67, PCNA, and MCM proteins: Markers of proliferation in the diagnosis of breast cancer. Acta Histochem. 2016;118:544–52. doi: 10.1016/j.acthis.2016.05.002. [DOI] [PubMed] [Google Scholar]
- Kalluri R, Weinberg RA. The basics of epithelial-mesenchymal transition. J Clin Invest. 2009;119:1420–8. doi: 10.1172/JCI39104. [DOI] [PMC free article] [PubMed] [Google Scholar]
- Kamat AA, Fletcher M, Gruman LM, et al. The clinical relevance of stromal matrix metalloproteinase expression in ovarian cancer. Clin Cancer Res. 2006;12:1707–14. doi: 10.1158/1078-0432.CCR-05-2338. [DOI] [PMC free article] [PubMed] [Google Scholar]
- Khatun S, Fujimoto J, Toyoki H, et al. Clinical implications of expression of ETS-1 in relation to angiogenesis in ovarian cancers. Cancer Sci. 2003;94:769–73. doi: 10.1111/j.1349-7006.2003.tb01517.x. [DOI] [PMC free article] [PubMed] [Google Scholar]
- Kobayashi H, Tsuruchi N, Sugihara K, et al. Expression of alpha-smooth muscle actin in benign or malignant ovarian tumors. Gynecol Oncol. 1993;48:308–13. doi: 10.1006/gyno.1993.1054. [DOI] [PubMed] [Google Scholar]
- Labiche A, Heutte N, Herlin P, et al. Stromal compartment as a survival prognostic factor in advanced ovarian carcinoma. Int J Gynecol Cancer. 2010;20:28–33. doi: 10.1111/IGC.0b013e3181bda1cb. [DOI] [PubMed] [Google Scholar]
- Lee ES, Leong AS, Kim YS, et al. Calretinin, CD34, and alpha-smooth muscle actin in the identification of peritoneal invasive implants of serous borderline tumors of the ovary. Mod Pathol. 2006;19:364–72. doi: 10.1038/modpathol.3800539. [DOI] [PubMed] [Google Scholar]
- Li N, Deng W, Ma J, et al. Prognostic evaluation of Nanog, Oct4, Sox2, PCNA, Ki67 and E-cadherin expression in gastric cancer. Med Oncol. 2015;32:433. doi: 10.1007/s12032-014-0433-6. [DOI] [PubMed] [Google Scholar]
- Mikami S, Oya M, Mizuno R, et al. Expression of Ets-1 in human clear cell renal cell carcinomas: implications for angiogenesis. Cancer Sci. 2006;97:875–82. doi: 10.1111/j.1349-7006.2006.00268.x. [DOI] [PMC free article] [PubMed] [Google Scholar]
- Motrescu ER, Blaise S, Etique N, et al. Matrix metalloproteinase-11/stromelysin-3 exhibits collagenolytic function against collagen VI under normal and malignant conditions. Oncogene. 2008;27:6347–55. doi: 10.1038/onc.2008.218. [DOI] [PubMed] [Google Scholar]
- Parikh JG, Kulkarni A, Johns C. alpha-smooth muscle actin-positive fibroblasts correlate with poor survival in hepatocellular carcinoma. Oncol Lett. 2014;7:573–5. doi: 10.3892/ol.2013.1720. [DOI] [PMC free article] [PubMed] [Google Scholar]
- Rao KB, Malathi N, Narashiman S, et al. Evaluation of myofibroblasts by expression of alpha smooth muscle actin: a marker in fibrosis, dysplasia and carcinoma. J Clin Diagn Res. 2014;8:ZC14–7. doi: 10.7860/JCDR/2014/7820.4231. [DOI] [PMC free article] [PubMed] [Google Scholar]
- Ricciardelli C, Rodgers RJ. Extracellular matrix of ovarian tumors. Semin Reprod Med. 2006;24:270–82. doi: 10.1055/s-2006-948556. [DOI] [PubMed] [Google Scholar]
- Rich L, Whittaker P. Collagen and picosirius red staining: a polarized light assessment of fibrillar hue and spatial distribution. J Morphol Sci. 2005;22:9. [Google Scholar]
- Shieh AC. Biomechanical forces shape the tumor microenvironment. Ann Biomed Eng. 2011;39:1379–89. doi: 10.1007/s10439-011-0252-2. [DOI] [PubMed] [Google Scholar]
- Shinde AV, Humeres C, Frangogiannis NG. The role of alpha-smooth muscle actin in fibroblast-mediated matrix contraction and remodeling. Biochim Biophys Acta. 2016;1863:298–309. doi: 10.1016/j.bbadis.2016.11.006. [DOI] [PMC free article] [PubMed] [Google Scholar]
- Sun KH, Chang Y, Reed NI, et al. alpha-Smooth muscle actin is an inconsistent marker of fibroblasts responsible for force-dependent TGFbeta activation or collagen production across multiple models of organ fibrosis. Am J Physiol Lung Cell Mol Physiol. 2016;310:824–36. doi: 10.1152/ajplung.00350.2015. [DOI] [PMC free article] [PubMed] [Google Scholar]