

Abstract
Insult-associated blood–brain barrier leakage is strongly suggested to be a key step during epileptogenesis. In this study, we used three non-invasive translational imaging modalities, i.e. positron emission tomography, single photon emission computed tomography, and magnetic resonance imaging, to evaluate BBB leakage after an epileptogenic brain insult. Sprague-Dawley rats were scanned during early epileptogenesis initiated by status epilepticus. Positron emission tomography and single photon emission computed tomography scans were performed using the novel tracer [68Ga]DTPA or [99mTc]DTPA, respectively. Magnetic resonance imaging included T2 and post-contrast T1 sequence after infusion of Gd-DTPA, gadobutrol, or Gd-albumin. All modalities revealed increased blood–brain barrier permeability 48 h post status epilepticus, mainly in epileptogenesis-associated brain regions like hippocampus, piriform cortex, thalamus, or amygdala. In hippocampus, Gd-DTPA-enhanced T1 magnetic resonance imaging signal was increased by 199%, [68Ga]DTPA positron emission tomography by 37%, and [99mTc]DTPA single photon emission computed tomography by 56%. Imaging results were substantiated by histological detection of albumin extravasation. Comparison with quantitative positron emission tomography and single photon emission computed tomography shows that magnetic resonance imaging sequences successfully amplify the signal from a moderate amount of extravasated DTPA molecules, enabling sensitive detection of blood–brain barrier disturbance in epileptogenesis. Imaging of the disturbed blood–brain barrier will give further pathophysiologic insights, will help to stratify anti-epileptogenic treatment targeting blood–brain barrier integrity, and may serve as a prognostic biomarker.
Keywords: Blood–brain barrier, epilepsy, imaging, magnetic resonance imaging, positron emission tomography
Introduction
The development of insult-induced epilepsy, called epileptogenesis, is characterized by a latency period between brain insult and the occurrence of seizures.1 In patients, common epileptogenic insults are represented by traumatic brain injury, ischemic stroke, febrile seizures, or status epilepticus (SE). It is well agreed that insult-induced epileptogenesis, i.e. the period during which pathological changes finally lead to the development of spontaneous seizures, starts during or directly after the primary insult.1 During this period, structural and morphologic reorganization occurs, which results in neuronal hyperexcitability.2 Recent research, primarily histology-based, has elucidated blood–brain barrier (BBB) leakage, and subsequent extravasation of blood components such as albumin as critical component of insult-driven epileptogenesis and seizure promotion.3–5 The reciprocal may also be true, wherein seizure activity and inflammation may contribute to BBB leakage.6,7 As only part of patients develops epilepsy after brain insults, the generation of prognostic biomarkers is a prerequisite to identify patients at risk which may profit from an anti-epileptogenic therapy. Non-invasive imaging techniques could represent valuable tools to establish such markers that hold potential for translation into the clinic and may also be utilized for monitoring of treatment response.
The availability of dedicated small animal imaging techniques such as positron emission tomography (PET), single photon emission computed tomography (SPECT), and magnetic resonance imaging (MRI) facilitates in vivo assessment of pathological mechanisms in animal models of epileptogenesis.8,9 A great advantage of these methods is that the same protocols can principally be used for both animal research and clinical applications. The basic principle of imaging BBB integrity is identical for all imaging modalities: namely, measuring the brain uptake of a tracer or contrast agent, which does not cross BBB under normal physiological conditions. Even though MRI allows longitudinal assessment throughout epileptogenesis and contrast-enhanced MRI is highly relevant and routinely used for non-invasive imaging of BBB leakage in the clinical setting, its pre-clinical use is still in evolution.10,11 Recently, van Vliet et al.12 reported that infusion of the gadolinium (Gd)-labeled contrast agent gadobutrol allowed MRI visualization of BBB leakage one day and six weeks after an epileptogenesis-inducing SE. To date, no PET tracers for detecting BBB leakage have been evaluated in epilepsy. However, [68Ga]EDTA PET has been employed to assess BBB permeability in multiple sclerosis,13 and [99mTc]DTPA SPECT has been successfully used for evaluation of BBB integrity in patients with post-stroke seizures.14
Considering the limited number of studies assessing imaging protocols for detection of BBB leakage during epileptogenesis, we evaluated the suitability of different imaging modalities for detection of increased BBB permeability. To this end, we compared the reliability of Gd-DTPA-enhanced MRI, [99mTc]DTPA SPECT, and a novel PET tracer, [68Ga]DTPA, using the lithium-pilocarpine-post SE model of epileptogenesis. In this model, the latency phase, reflecting epileptogenesis, is relatively short. In most of the rats, the first spontaneous seizure occurs after one to two weeks following SE.15 In addition, we evaluated two additional MRI contrast agents, gadobutrol and Gd-albumin. Although nuclear imaging is thought to be more accurate due to higher sensitivity and specificity,16 direct comparisons to MRI are lacking in the literature. Notably, we present first detailed comparison between µPET, µSPECT, and µMR imaging of BBB leakage.
Materials and methods
Animals
Adult female Sprague-Dawley rats (200–220 g, n = 45) were obtained from Harlan Laboratories (Udine, Italy). Rats were housed in pairs under controlled climate conditions (22 ± 1℃, humidity 45–55%) in individually ventilated cages under a 14/10-h light-dark cycle. Autoclaved water and standard diet were accessible ad libitum (Altromin 1324; Altromin, Lage, Germany). After delivery, animals were allowed to adapt to the new conditions and were handled daily for at least one week before being used in experiments. Experiments were conducted in accordance with European Communities Council Directives 86/609/EEC and 2010/63/EU and were formally approved by the responsible local authority (Landesamt für Verbraucherschutz und Lebensmittelsicherheit, LAVES). Experiments were reported according to ARRIVE (Animal Research: Reporting in Vivo Experiments) guidelines.
Chemicals and drugs
Isoflurane (Isofluran Baxter) was obtained from Baxter (Unterschleißheim, Germany) and CP-Pharma (Burgdorf, Germany), diazepam (Diazepam-ratiopharm) from Ratiopharm (Ulm, Germany). Unless stated otherwise, all other chemicals were purchased from Sigma-Aldrich (Schnelldorf, Germany).
SE induction
SE was induced by fractionated pilocarpine injections in 38 rats. At 12–14 h before SE induction, animals were pre-treated with lithium chloride (127 mg/kg p.o. in 3 ml/kg 0.9% saline). Methyl-scopolamine (1 mg/kg i.p. in 2 ml/kg 0.9% saline) was administered 30 min before the first pilocarpine injection to reduce parasympathetic side effects. The maximum dose of pilocarpine hydrochloride was 50 mg/kg i.p. in 1 ml/kg 0.9% saline (30 mg/kg, subsequently 10 mg/kg twice every 30 min if SE was not yet reached). According to Racine’s scale,17 seizure activity was monitored by observation and beginning SE was defined as continuous behavioral seizure activity of stage 4 or 5. Ninety minutes after onset, SE was terminated by two diazepam injections given at intervals of 15–20 min (10 mg/kg i.p. in 2 ml/kg). A third dose of diazepam (5 mg/kg) was administered if necessary. Rats were hand fed with standard feed mash three times daily over the first four days after SE and fluid balance was stabilized with injections of electrolyte solution (5 ml s.c. twice daily, Sterofundin/G5, B. Braun Melsungen, Germany). The overall SE induction rate was 97.4% (37 of 38 rats). Rats developed SE after 44.6 ± 6.2 min. Survival rate throughout experiments was 100% (38 of 38 rats).
PET and SPECT tracer synthesis
68Ga was eluted from a 68Ge/68Ga generator (CYCLOTRON Co. Ltd, Obninsk, Russia) and was purified as previously described18 to remove interfering ion contribution. DTPA (10 nmol) was diluted in 2 M acetate buffer. The buffer system was later changed to 1.5 M 2-(4-(2-hydroxyethyl)-1-piperazinyl) ethanesulfonic acid (HEPES) to enhance tolerability. The generator eluate was added to the solubilized DTPA, and the final [68Ga]DTPA formulation adjusted to pH 3–4. For PET imaging, radiochemical purity was determined by thin-layer chromatography (ITLC SG, Pall, Dreieich, Germany) in saline and methyl ethyl ketone, resulting in negligible amounts of free 68Ga and in vitro stability for at least 2 h. Radionuclide purity was determined by means of radioactive decay of 68Ga with respect to the 68Ge residual activity.
For SPECT imaging, [99mTc]DTPA was formulated from a commercially available kit (ROTOP-DTPA, 5.0 mg; ROTOP Pharmaka GmbH, Dresden, Germany), containing pentetic acid. Sodium-[99mTc] pertechnetate solution (5 ml) was added to the kit to form the stable radiotracer.
PET and SPECT imaging
For PET and SPECT imaging, a total of 18 rats were used. Imaging was performed under isoflurane anesthesia (1.5–2.5% in oxygen). Respiration and heart rate were monitored continuously (BioVet, m2m imaging, Cleveland, OH, USA). Respiration rate was maintained at 41 ± 3 breaths per min, resulting in a heart rate of 320 ± 1 beats per min. Total anesthesia duration was approximately 90 min. PET imaging was conducted using a dedicated small animal PET scanner (Inveon µPET/CT camera; Siemens, Erlangen, Germany). A catheter was inserted into a lateral tail vein for tracer administration, and [68Ga]DTPA was either injected as a 1 ml bolus (38.44 ± 3.8 MBq; n = 4) over approximately 1 min, or infused in 1 ml over a 20 min step-down procedure (35.8 ± 8.02 MBq; n = 8) following an already published infusion protocol.12 A 20-min static PET acquisition was started 40 min after start of injection. Rats were scanned serially before SE (baseline) and at 5 h, 24 h, 48 h, and 5 days post SE following bolus injection. For the infusion protocol, only baseline and 48 h post SE images were acquired. After [68Ga]DTPA administration, animals were placed on a temperature-controlled rat imaging bed (Minerve, Esternay, France) in prone position with the brain in the center of the field of view. A 10-min transmission scan for attenuation correction using 57Co was conducted, followed by static PET acquisitions. After completion of scans, rats were kept on heating pads until complete recovery. List mode data were histogrammed to a single frame. PET images were reconstructed to a 128 × 128 × 159 image matrix (voxel size 0.87 × 0.87 × 0.80 mm3) with an iterative ordered subset expectation maximization and maximum a posteriori (OSEM3D/fastMAP) algorithm (ß = 1, two OSEM iterations, 18 MAP iterations) with scanner-applied scatter, randoms, and decay correction.
[99mTc]DTPA SPECT scans were conducted on a preclinical SPECT/CT system (eXplore speCZT/CT120, Trifoil Imaging, Northridge, CA, USA), equipped with a full ring cadmium-zinc-telluride (CZT) semi-conductor detectors, and a rotating 5-pinhole collimator. Rats were scanned at baseline, 48 h and 10 days after SE. Six rats received [99mTc]DTPA (139.5 ± 7.25 MBq) in a volume of 1 ml infused over 20 min using the same infusion protocol as for [68Ga]DTPA. SPECT imaging was started 40 min after start of tracer infusion, with a total scan time of 40 min. Images were acquired over 108 projection views of 15 s using a step-and-shoot protocol. SPECT images were reconstructed using an iterative OSEM algorithm (nine subsets, six iterations) with energy correction, uniformity correction, and resolution recovery according to the manufacturer’s default. The final image matrix was 156 × 156 × 216 with a voxel size of 0.5 × 0.5 × 0.5 mm3.
MRI
Rats (n = 13) were scanned at baseline and 48 h following SE. MRI was conducted with ParaVision 5.1 (Bruker, Ettlingen, Germany) acquisition software on a 7 T (300 MHz) small animal MR system (Bruker Pharmascan) with a 16-cm horizontal bore equipped with a 9 cm inner diameter gradient insert (Bruker BGA-9S). A rat brain receive-only coil array (11483V3) in combination with a quadrature MRI transmit-only coil with active decoupling (T11070) was used. To ensure reproducible positioning, the receive coil was placed at a defined position over the rat head, fixed via tooth bar. Imaging chambers were kept at 37℃ and respiration rate was maintained between 40 and 60 breaths per min.
For detecting edema and for anatomical co-localization, T2-weighted 2D multi slice multi echo images (MSME; repetition time = 2500 ms, echo time = 11 ms, 96 slices of 0.8 mm, 256 × 256 matrix, 35 × 35 × 25.6 mm3 field of view) were acquired. T1-weighted images were acquired using a 3D modified driven equilibrium Fourier transform method (MDEFT; 0.8 mm slice thickness, 256 × 256 × 32 matrix, 35 × 35 × 25.6 mm3 field of view). T1 MDEFT sequences were acquired before and 30 min after the start of contrast agent infusion. The resulting voxel size was 0.136 × 0.136 × 0.8 mm3. For contrast agent infusion, a catheter was placed in a lateral tail vein and connected to a syringe pump (PHD Ultra, Harvard Apparatus, South Natick, MA, USA). Rats were infused with three different gadolinium (Gd) formulations: Gd-DTPA (Magnevist 0.5 mmol/ml; Bayer HealthCare, Leverkusen, Germany), Gadobutrol (Gadovist 1 mmol/ml; Bayer HealthCare) or bovine albumin conjugated with chelated Gd in phosphate-buffered saline (Galbumin; BioPAL, Worcester, MA, USA) using a 20-min step-down infusion schedule to quickly achieve and obtain a plateau level of contrast agent in the blood.12,19 Gd-DTPA and Gd-albumin infusion followed a previously published infusion protocol,12 resulting in a total infusion volume of 1.78 ml. Gadobutrol was infused in 50% of volume in order to reach a Gd dose comparable to Gd-DTPA (i.e. 890 µmol). For Gd-DTPA MRI, animals were additionally scanned at 10 days after SE. For Gd-albumin, the infusion protocol resulted in a Gd dose of 6.0 to 8.9 µmol, which could not be increased due to intolerable viscosity of high albumin concentration and injectable volume restrictions. Simultaneous to the contrast agent infusion, dynamic short T1-weighted rapid acquisition refocusing sequences (RARE; repetition time = 1500 ms, echo time = 9 ms, 16 slices of 0.8 mm, slice gap 1 mm, 256 × 256 matrix and 35 × 35 × 25 mm3 field of view, resulting in a voxel size of 0.136 × 0.136 × 0.8 mm3) were repeated 12 times to evaluate time-dependent changes in uptake of contrast agent.
Image analysis
After reconstruction, PET and SPECT images were first co-registered to corresponding CT images, and subsequently to the built-in MR rat brain template in PMOD software (PMOD Technologies Ltd., Zurich, Switzerland). MRI data were directly co-registered with the template. Brain regions (hippocampus, piriform cortex, amygdala, thalamus, cerebellum, and pons) of all datasets were analyzed using a rat brain atlas.20 PET data were calculated as percent of the injected dose per cubic centimeter brain tissue (% ID/cc). To reduce data variation, SPECT data and MR T1- and T2 signals were normalized to the pons. The pons was chosen as a reference region because no increase in contrast agent/tracer uptake or T2 MRI signal was found after SE (data not shown). Additionally, Gd-DTPA and gadobutrol leakage t-maps were calculated using MATLAB software (MathWorks, Natick, MA, USA) and SPM12 (UCL, London, UK). For parametric mapping analysis, all images of a group were co-registered resulting in an average value ± SD for each voxel. Differences between baseline and 48 h post SE were calculated for each single voxel using a two-sample unpaired t-test, a significance level threshold of 0.001, and a minimum cluster size of 100 voxels.
Histological analysis of albumin extravasation
Additional control rats (n = 7) and rats 48 h after SE (n = 6) received 100 mg/kg bovine albumin-fluorescein isothiocyanate conjugate (FITC-albumin) diluted in 10 ml/kg 0.1 M phosphate-buffered saline (PBS) i.v. with an infusion rate of 1 ml/min. Two hours later, rats were perfused via the heart left ventricle under deep anesthesia. The vascular system was flushed with 125 ml 0.01 M PBS followed by 250 ml of 4% paraformaldehyde in 0.1 M PBS, at a flow rate of 16.6 ml/min. Brains were removed and post-fixed in 4% phosphate-buffered paraformaldehyde for 24 h prior to storage at 4℃ in 30% sucrose in 0.1 M PBS with 0.2% sodium azide. Coronal sectioning at +0.36 mm, −1.56 mm, and −3.72 mm relative to bregma was performed using a freezing microtome (Frigomobil 1205; Jung, Heidelberg, Germany). Staining and measurement of stained areas were performed as described.21 Briefly, after standard tissue pretreatment, FITC fluorescence signal was converted into a light-microscopically visible reaction product by incubation with horseradish-peroxidase-conjugated anti-FITC IgG (1:2000; Dianova, Hamburg, Germany) for 20 h followed by nickel-enhanced diaminobenzidine (DAB-Ni) staining. Images of whole brain sections were acquired using a light microscope (Keyence, Neu-Isenburg, Germany) and stained areas were calculated by the total number of pixels in the stained area relative to the total area of the respective brain section. Green-fluorescent FITC-albumin was revealed by a confocal laser-scanning microscope (LSM 510 Meta, Zeiss, Göttingen, Germany).
Statistical analysis
All results are presented as mean ± standard error of the mean (SEM). Comparisons of two groups were performed by two-tailed Student’s t-test. Multiple comparisons were analyzed by one-way analysis of variance (ANOVA) with Bonferroni’s or Dunnett’s post hoc tests using GraphPad Prism 5 software (GraphPad, La Jolla, CA, USA). Unless stated otherwise, a p-value < 0.05 was considered statistically significant.
Results
[68Ga]DTPA PET and [99mTc]DTPA SPECT imaging
[68Ga]DTPA PET following bolus injection was performed longitudinally before and at 5 h, 24 h, 48 h, and 5 days after SE. [68Ga]DTPA uptake was increased in piriform cortex by 61% at 48 h (p < 0.05) and by 111% at five days (p < 0.001) after SE, indicating BBB leakage (Figure 1). [68Ga]DTPA infusion resulted in an increased tracer uptake by 37% only in hippocampus (p = 0.014) 48 h after SE (Figure 1). [99mTc]DTPA SPECT demonstrated a significant increase of tracer uptake in hippocampus (p < 0.05) and piriform cortex (p < 0.01) at 48 h after SE (Figure 2). In all other regions of interest, the increase in [99mTc]DTPA uptake did not reach statistical significance. At 10 days after SE, tracer uptake values converged to baseline levels in all examined brain regions, suggesting recovery of BBB integrity.
Figure 1.

[68Ga]DTPA PET after bolus injection and following an infusion protocol. (a) Representative coronal PET summation images of the rat brain after [68Ga]DTPA bolus-injection at different time points during epileptogenesis. (b) Quantification of tracer uptake (%ID/cc) in various brain regions (n = 4 per time point). (c) Representative coronal PET images of the rat brain after [68Ga]DTPA infusion at baseline and 48 h post status epilepticus (SE). (d) Quantification of tracer uptake (%ID/cc) in various brain regions (n = 8). Data are presented as mean ± SEM. *p < 0.05 compared to baseline, one-way ANOVA, and Dunnett’s post hoc test (b) or two-tailed Student’s t-test (d).
Figure 2.

[99mTc]DTPA SPECT using an infusion protocol. (a) Representative coronal SPECT images of the rat brain after [99mTc]DTPA infusion at baseline, 48 h and 10 days after status epilepticus (SE). (b) Quantification of tracer uptake in various brain regions (n = 6). Data are normalized to pons and presented as mean ± SEM. *p < 0.05 compared to baseline, one-way ANOVA, and Dunnett’s post hoc test.
MR imaging
T2 values measured by MSME sequence were significantly increased in hippocampus (p = 0.012), entorhinal cortex (p = 0.0045), piriform cortex (p = 0.033), amygdala (p = 0.0003), and thalamus (p = 0.0030) compared to baseline values, indicating edema formation in these brain regions 48 h post SE (Figures 3(a) and 4(a)).
Figure 3.

Assessment of status-epilepticus (SE)-induced pathology by MRI. (a) Representative coronal and horizontal T2-weighted MR images before and 48 h after status epilepticus (SE). (b) Representative coronal T1-weighted MR images before and after gadobutrol infusion 48 h post SE (left), and coronal and horizontal gadobutrol leakage maps (n = 4, right). (c) Representative coronal T1-weighted MR images before and after Gd-DTPA infusion 48 h post SE (left), and coronal and horizontal Gd-DTPA leakage maps (n = 5, right). Leakage t-maps were calculated by SPM12 software (two-sample unpaired t-test, p < 0.001, and a minimum cluster size of 100 voxels).
Figure 4.
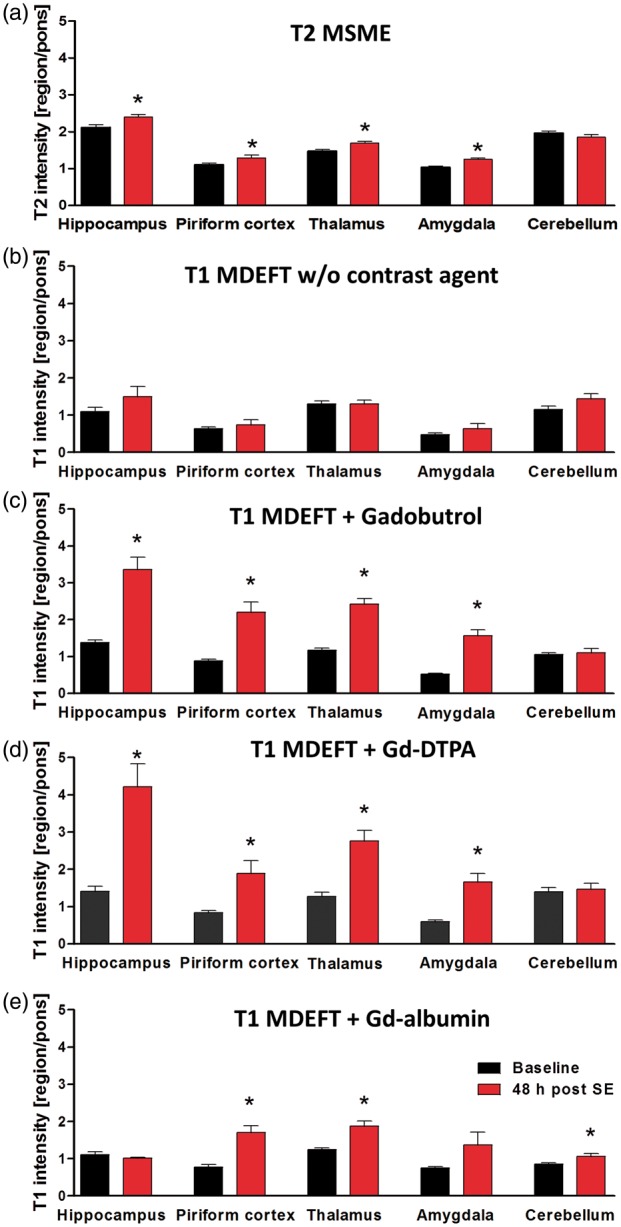
Quantification of MRI T2-multi-slice-multi-echo (MSME, A, n = 10–13) and T1-modified driven equilibrium Fourier transform (MDEFT) values before (b, n = 5) and after infusion of gadobutrol (c, n = 4), Gd-DTPA (d, n = 5) or Gd-albumin (e, n = 4) in various brain regions before and 48 h post status epilepticus (SE). Data are normalized to pons and presented as mean ± SEM. *p < 0.05 compared to baseline, one-way ANOVA and Dunnett’s post hoc test.
High-resolution 3D T1-MDEFT sequences were implemented before and 30 min after infusion of contrast agent. T1 intensity without infusion of contrast agent did not reveal any significant differences between baseline and 48 h post SE (Figure 4(b)). After infusion of gadobutrol, T1 signal was significantly increased in hippocampus (by 145%, p = 0.0011), piriform cortex (by 150%, p = 0.0033), thalamus (by 108%, p = 0.0002), and amygdala (by 203%, p = 0.0007) at 48 h post SE (Figures 3(b) and 4(c)). Comparably, Gd-DTPA resulted in increased T1 signal by 199% in hippocampus (p = 0.0023), 127% in piriform cortex (p = 0.016), 117% in thalamus (p = 0.0017), and 181% in amygdala (p = 0.0020, Figures 3(c) and 4(d)). At 10 days after SE, no significant increases compared to baseline were detected in any analyzed brain region (data not shown). Gd-albumin leakage was also present in thalamus and piriform cortex to a lesser extent than other contrast agents and was absent in hippocampus (Figure 4(e)). Surprisingly, Gd-albumin infusion resulted in significant signal increase in the cerebellum which was not found with any other imaging modality in this study. In addition to atlas-based data evaluation, contrast agent leakage maps were generated for gadobutrol and Gd-DTPA using SPM12 software. The distribution pattern of BBB leakage confirmed the results from regional T1-intensities (Figure 3(b) and (c)).
Additionally, contrast agent uptake was measured dynamically based on T1 RARE mapping. T1 intensity showed a steady increase after both gadobutrol and Gd-DTPA infusion, reaching statistical significance first in hippocampus at 9 min after start of infusion, and, subsequently in other affected regions including amygdala and piriform cortex (Figure 5). Differences persisted to 30 min after infusion with both contrast agents and to 60 min for Gd-DTPA, whereas the gadobutrol group could not be analyzed due to a limited group size of two at 50 min. In contrast, T1 intensity of cerebellum was relatively stable over the course of contrast agent infusion and was comparable between baseline and 48 h after SE.
Figure 5.

Dynamic T1-rapid-acquisition-refocusing (RARE) mapping during step-down contrast agent infusion. Time course of T1 signals after gadobutrol (a) or Gd-DTPA infusion (b) in hippocampus, amygdala, piriform cortex and cerebellum. Data (n = 4–5 per time point) are presented as mean ± SEM. *p < 0.05 between rats before (baseline) and 48 h post status epilepticus (SE), one-way ANOVA and Bonferroni's multiple comparison post hoc test. No statistic was calculated for the baseline group at 50 min after gadobutrol infusion, as scans of only two rats were available for analysis.
Histology
Histological analysis revealed region-dependent albumin extravasation (Figure 6). In thalamus, significantly increased extravasation was only found at section level −3.72 mm relative to bregma. Amygdala, piriform, and entorhinal cortex showed significant increase at −1.56 mm and −3.72 mm relative to bregma. Confocal laser-scanning microscopy revealed interstitial FITC-albumin extravasation as well as cellular uptake as exemplarily shown for hippocampus in Figure 6(b), though albumin extravasation in hippocampus was seen only in individual animals and did not reach statistical significance on group level (data not shown). Visual inspection of the cerebellum did not reveal any albumin extravasation.
Figure 6.

Histological evaluation of albumin extravasation. (a) Representative brain sections of a control rat and a rat 48 h post status epilepticus (SE) after conversion of FITC-albumin with peroxidase-conjugated anti-FITC and nickel-enhanced DAB into a light-microscopically analyzable reaction product at about −3.72 mm relative to bregma. (b) Representative images from hippocampus at 48 h post SE generated by confocal laser-scanning microscopy revealing FITC-labeled albumin extravasation from brain capillaries (left, scale bar indicates 50 µm) and cellular uptake (right, scale bar indicates 25 µm). (c) Quantification of stained area relative to the total section area at +0.36, −1.56, and −3.72 mm relative to bregma. Data are presented as mean ± SEM. *p < 0.05 compared to control, two-tailed Student’s t-test.
Discussion
This study is the first comparison of pre-clinical PET, SPECT, and MRI for detection of BBB leakage. The feasibility of the novel PET tracer [68Ga]DTPA to detect, localize and quantify BBB impairment during early epileptogenesis was compared with [99mTc]DTPA SPECT imaging and Gd-DTPA-, gadobutrol-, and Gd-albumin-enhanced MRI in the lithium pilocarpine post SE rat model. All investigated imaging techniques can effectively detect BBB leakage in early epileptogenesis, and extravasation patterns are limited to specific brain regions typically associated with epilepsy. Contrast-enhanced T1-weighted MRI had the highest diagnostic potential for detecting changes in BBB integrity.
We used three radiotracers and contrast agents bound to DTPA to minimize the difference in the reporter between modalities. Usually, limitations of MRI in comparison to SPECT, and especially to PET, are predicated on sensitivity and quantification methods.16 The described superiority of MRI may stem from MR sequences which are optimized to amplify differences in Gd-associated T1. This obviously results in a strong MR signal in the specific setting of impaired BBB, but the relationship between signal and Gd-concentration may not be linear. In contrast, the quantitative and linear PET signal results in a relatively modest absolute difference between leakage of healthy and impaired BBB. Furthermore, one has to keep in mind that MRI contrast agents are administered in milligrams potentially leading to side effects, whereas radio-tracers are usually administered in micrograms to nanograms,16 therefore influencing physiology to a lesser extent, which might be an advantage in experimental and clinical settings. The superiority of MRI over the nuclear techniques may also derive from different impact of blood background between modalities. Furthermore, partial volume effects should be taken into consideration, due to the small size of the rat brain and the relatively low resolution of PET.22 We used the dynamic data gained for Gd-DTPA and Gadobutrol infusion to assess whether different contrast agents might have different kinetics, which was not the case. Further, we used the dynamic data to confirm that the time window we applied for MR imaging was reasonably chosen (approaching “steady-state”), because we performed the scans earlier than van Vliet et al. (30 min vs. 45 min post start of contrast agent infusion)12 in order to limit total duration of anesthesia.
Earlier work revealed that brain pharmacokinetics are comparable between [99mTc]DTPA and Gd-DTPA.23 Nevertheless, differences in stability or pharmacokinetics between the DTPA complexes used in the present study may explain why, unexpectedly, PET was inferior in signal to background ratio compared to the other modalities. Whereas [68Ga]DTPA-complexes used for 68Ga-labeling of various compounds were reported to be generally stable,24 earlier reports using DTPA as a chelator for protein labeling described inferior stability compared to other 68Ga-complexes.25 If 68Ga is set free from [68Ga]DTPA, it effectively binds to the plasma protein transferrin, which may confound the brain signal because of active transport at the BBB.26,27
T1-weighted MRI following Gd-DTPA and gadobutrol infusion showed comparable extravasation patterns limited to specific brain regions typically associated with epileptogenesis. Our findings align a study by van Vliet et al.12, who described BBB leakage in similar brain regions using the kainate rat model of SE-induced epileptogenesis.12 Gd-DTPA and gadobutrol kinetics demonstrated principal equivalence reflecting their comparable molecular weight (Gd-DTPA 546 Da, gadobutrol 605 Da). By contrast, the high molecular weight Gd-albumin (74000 Da) did not reveal BBB leakage in the hippocampus, though the extravasation pattern compared favorably to Gd-DTPA and gadobutrol in other brain regions. While the Gd dose of Gd-albumin was much lower which may have limited the detection threshold, histological analysis of FITC-albumin signals (converted and enhanced by DAB-Ni) confirmed the limited extravasation in hippocampus. As extravasation patterns of different contrast agents vary depending on molecular and physicochemical properties,11 the much higher molecular size of albumin may underlie this finding. Indeed, this is consistent with a report in a stroke model, where the extravasation pattern of the low-molecular weight Gd-DTPA, which does not bind to albumin, was shown to be less differentiating than Evans blue and Gadofluorine M, each displaying a high binding affinity to albumin.28 The observed differences between contrast agents may offer additional information regarding the extent and nature of BBB impairment. Interestingly, only with Gd-albumin MRI, we found a small but significant signal increase in the cerebellum after SE, but not with other contrast agents, other modalities or histology after FITC-albumin infusion. The T1 signal coming from the tissue itself (Figure 4(b)) might contribute to the signal with contrast agent and seems also to be slightly increased in the cerebellum. This will have more effect on the result of Gd-albumin-enhanced MRI as the absolute Gd-concentration is much lower than for the other Gd-based contrast agents. We cannot exclude that observed differences between Gd-albumin-enhanced MRI and histology after FITC-albumin injection might be caused by differences in biodistribution of both compounds and that both compounds do not entirely reflect distribution of endogenous rat serum albumin.11
Multiple insult-associated and potentially epileptogenic processes occur during the first days after SE. Cerebrovascular damage, in this model resulting from severe SE, is most likely a key factor ultimately leading to spontaneous seizures. Here, we found a peak in BBB leakage at 48 h after SE. In the utilized animal model, this time point lies within the time frame of epileptogenesis, as in most of the rats the first spontaneous seizure occurs after one to two weeks following SE.15 Furthermore, T2-weighted MRI revealed edema formation in the hippocampus, entorhinal cortex, piriform cortex, amygdala, and thalamus 48 h following SE, consistent with earlier studies in different models of epileptogenesis.29–31 Both with [99mTc]DTPA SPECT and with Gd-DTPA-enhanced MRI, BBB leakage was not detectable any more at 10 days after SE. This is principally in line with recent data by van Vliet et al.,32 comprising Gd-leakage maps at eight days after kainic acid induced SE. Though, it remains unclear why calculated leakage values indicating persistent leakage after SE seem to clearly differ from visual analysis of leakage maps.
Inflammatory processes have been described to interact with BBB permeability.10 However, treatment with lithium chloride and pilocarpine, which have both been shown to be pro-inflammatory,33,34 do not seem to lead to albumin extravasation in case of missing SE development. In brain slices of single FITC-albumin-injected rats that had not developed SE despite treatment with lithium chloride and pilocarpine, we did not observe any albumin extravasation at 48 h after treatment (unpublished data). This indicates that acute pro-inflammatory effects reported a few hours after lithium chloride administration33 may have already vanished at 48 h post SE, or were not strong enough to also affect BBB integrity. Therefore, it seems likely that SE itself triggered the herein described changes in MRI signal.
Rats had to be anesthetized to perform imaging. We used isoflurane for this purpose. As isoflurane has been shown to decrease BBB integrity when high concentrations (3%) are administered,35 we cannot exclude an effect of (repetitive) anesthesia on BBB integrity in our experiments, although the concentrations used for anesthesia maintenance were distinctly below 3%. Furthermore, as isoflurane suppresses central neurotransmission, repetitive anesthesia might change pathological processes during epileptogenesis.
For [68Ga]DTPA PET, we also compared bolus injection with an infusion scheme. Whereas our results cannot confirm superiority of one approach, other studies have suggested an advantage of infusion protocols over bolus injection for detection of BBB permeability as evidenced in stroke models19,36 and after kainate-induced SE.12 In PET imaging, tracer injection as a bolus remains standard procedure,37 but it should be taken into consideration that fast administration of high volumes in laboratory rodents may impair BBB integrity.19
While our study was mainly designed to evaluate suitability of different translational imaging protocols for detection of BBB leakage, our findings might also be valuable for identification of increased BBB permeability as a prognostic biomarker of epileptogenesis. In contrast to the animal model used in the present study, where approximately 100% of the animals develop epilepsy, an animal model in which only part of the animals become epileptic has to be used for biomarker evaluation in future studies. If BBB leakage can be confirmed to represent a valuable imaging biomarker for epileptogenesis, this approach can easily be transferred into clinical settings, as in insult-induced epilepsy, the primary insult will normally draw clinical attention and could be closely followed by non-invasive imaging. Furthermore, imaging of BBB might also be helpful to identify BBB impairment in chronic epilepsy. Nevertheless, in the epileptic focus only limited changes in BBB permeability have been described38 and might be below imaging detection levels. Having imaging biomarkers available enables application of potentially BBB protective treatment strategies, like treatment with glucocorticosteroids or mesenchymal stromal cells,39 to prevent or modify epileptogenesis.
Conclusions
The present study demonstrates the suitability of the novel PET tracer [68Ga]DTPA, [99mTc]DTPA SPECT, and contrast-enhanced MRI to quantify BBB leakage in early epileptogenesis. For future studies, contrast-enhanced MRI seems to be the most favorable modality to image BBB leakage due to highest diagnostic potential. Nevertheless, cross-validation of crucial findings using a linear and quantitative method like PET or SPECT should be taken into consideration. Our findings will help to further evaluate the role of BBB impairment in epileptogenesis and provide a potential method to optimize timing of BBB protective treatment approaches. Furthermore, longitudinal imaging of BBB impairment including seizure monitoring may ultimately lead to a prognostic biomarker for the development of epilepsy.
Acknowledgements
We thank C. Bergen, P. Bascunana, J. Kacza, A. Kanwischer, S. Eilert, P. Felsch, M. Brackhan, J. Thackeray, D. Michalski, and A. Thomer for their skillful assistance or help with data analysis.
Funding
The author(s) disclosed receipt of the following financial support for the research, authorship, and/or publication of this article: This study is funded by the European Union Seventh’s Framework Programme (FP7/2007-2013) under grant agreement n°602102 (EPITARGET). Heike Breuer was supported by a scholarship from the Studienstiftung des Deutschen Volkes.
Declaration of conflicting interests
The author(s) declared no potential conflicts of interest with respect to the research, authorship, and/or publication of this article.
Authors’ contributions
MB and JPB contributed equally to this study.
Design of the study/experiments: HB, MMe, JPB, MB, FMB, WH, TLR.
Data acquisition: HB, MMe, SS, AW, WH, MB, MMä.
Analysis of experiments: HB, JPB, MB.
Writing of the manuscript: HB, MB, JPB.
Revision: All authors.
References
- 1.Pitkänen A, Lukasiuk K. Mechanisms of epileptogenesis and potential treatment targets. Lancet Neurol 2011; 10: 173–186. [DOI] [PubMed] [Google Scholar]
- 2.Herman ST. Epilepsy after brain insult targeting epileptogenesis. Neurology 2002; 59: 21–26. [DOI] [PubMed] [Google Scholar]
- 3.Gorter JA, van Vliet EA, Aronica E. Status epilepticus, blood–brain barrier disruption, inflammation, and epileptogenesis. Epilepsy Behav 2015; 49: 13–16. [DOI] [PubMed] [Google Scholar]
- 4.Marchi N, Angelov L, Masaryk T, et al. Seizure-promoting effect of blood-brain barrier disruption. Epilepsia 2007; 48: 732–742. [DOI] [PMC free article] [PubMed] [Google Scholar]
- 5.Seiffert E, Dreier JP, Ivens S, et al. Lasting blood-brain barrier disruption induces epileptic focus in the rat somatosensory cortex. J Neurosci 2004; 24: 7829–7836. [DOI] [PMC free article] [PubMed] [Google Scholar]
- 6.Stanimirovic DB, Friedman A. Pathophysiology of the neurovascular unit: disease cause or consequence & quest. J Cereb Blood Flow Metab 2012; 32: 1207–1221. [DOI] [PMC free article] [PubMed] [Google Scholar]
- 7.Vezzani A, Baram TZ. New roles for interleukin-1 beta in the mechanisms of epilepsy. Epilepsy Curr 2007; 7: 45–50. [DOI] [PMC free article] [PubMed] [Google Scholar]
- 8.Dankbaar JW, Hom J, Schneider T, et al. Dynamic Perfusion CT Assessment of the Blood-Brain Barrier Permeability: First Pass versus Delayed Acquisition. Am J Neuroradiol 2008; 29: 1671–1676. [DOI] [PMC free article] [PubMed] [Google Scholar]
- 9.Dedeurwaerdere S, Shultz SR, Federico P, et al. Workshop on neurobiology of epilepsy appraisal: new systemic imaging technologies to study the brain in experimental models of epilepsy. Epilepsia 2014; 55: 819–828. [DOI] [PMC free article] [PubMed] [Google Scholar]
- 10.Marchi N, Granata T, Ghosh C, et al. Blood–brain barrier dysfunction and epilepsy: pathophysiologic role and therapeutic approaches. Epilepsia 2012; 53: 1877–1886. [DOI] [PMC free article] [PubMed] [Google Scholar]
- 11.Wunder A, Schoknecht K, Stanimirovic DB, et al. Imaging blood-brain barrier dysfunction in animal disease models. Epilepsia 2012; 53: 14–21. [DOI] [PubMed] [Google Scholar]
- 12.van Vliet EA, Otte WM, Gorter JA, et al. Longitudinal assessment of blood-brain barrier leakage during epileptogenesis in rats. A quantitative MRI study. Neurobiol Dis 2014; 63: 74–84. [DOI] [PubMed] [Google Scholar]
- 13.Pozzilli C, Bernardi S, Mansi L, et al. Quantitative assessment of blood-brain barrier permeability in multiple sclerosis using 68-Ga-EDTA and positron emission tomography. J Neurol Neurosurg Psychiatry 1988; 51: 1058–1062. [DOI] [PMC free article] [PubMed] [Google Scholar]
- 14.Gilad R, Lampl Y, Eilam A, et al. SPECT-DTPA as a tool for evaluating the blood-brain barrier in post-stroke seizures. J Neurol 2012; 259: 2041–2044. [DOI] [PubMed] [Google Scholar]
- 15.Rattka M, Brandt C, Bankstahl M, et al. Enhanced susceptibility to the GABA antagonist pentylenetetrazole during the latent period following a pilocarpine-induced status epilepticus in rats. Neuropharmacology 2011; 60: 505–512. [DOI] [PubMed] [Google Scholar]
- 16.Skotland T. Molecular imaging: challenges of bringing imaging of intracellular targets into common clinical use. Contrast Media Mol Imaging 2012; 7: 1–6. [DOI] [PubMed] [Google Scholar]
- 17.Racine RJ. Modification of seizure activity by electrical stimulation 2. motor seizure. Electroencephalogr Clin Neurophysiol 1972; 32: 281–294. [DOI] [PubMed] [Google Scholar]
- 18.Meyer G-J, Mäcke H, Schuhmacher J, et al. 68Ga-labelled DOTA-derivatised peptide ligands. Eur J Nucl Med Mol Imaging 2004; 31: 1097–1104. [DOI] [PubMed] [Google Scholar]
- 19.Nagaraja TN, Nagesh V, Ewing JR, et al. Step-down infusions of Gd-DTPA yield greater contrast-enhanced magnetic resonance images of BBB damage in acute stroke than bolus injections. Magn Reson Imaging 2007; 25: 311–318. [DOI] [PMC free article] [PubMed] [Google Scholar]
- 20.Schwarz AJ, Danckaert A, Reese T, et al. A stereotaxic MRI template set for the rat brain with tissue class distribution maps and co-registered anatomical atlas: application to pharmacological MRI. Neuroimage 2006; 32: 538–550. [DOI] [PubMed] [Google Scholar]
- 21.Michalski D, Grosche J, Pelz J, et al. A novel quantification of blood-brain barrier damage and histochemical typing after embolic stroke in rats. Brain Res 2010; 1359: 186–200. [DOI] [PubMed] [Google Scholar]
- 22.Goffin K, Van Paesschen W, Dupont P, et al. Longitudinal microPET imaging of brain glucose metabolism in rat lithium-pilocarpine model of epilepsy. Exp Neurol 2009; 217: 205–209. [DOI] [PubMed] [Google Scholar]
- 23.Prato FS, Wisenberg G, Marshall TP, et al. Comparison of the biodistribution of gadolinium-153 DTPA and technetium-99m DTPA in rats. J Nucl Med 1988; 29: 1683–1687. [PubMed] [Google Scholar]
- 24.Wagner SJ, Welch MJ. Ga-68 labeling of albumin and albumin microspheres. J Nucl Med 1979; 20: 428–433. [PubMed] [Google Scholar]
- 25.Al-Nahhas A, Win Z, Szyszko T, et al. Gallium-68 PET: a new frontier in receptor cancer imaging. Anticancer Res 2007; 27: 4087–4094. [PubMed] [Google Scholar]
- 26.Harris WR, Pecoraro VL. Thermodynamic binding constants for gallium transferrin. Biochemistry (Mosc) 1983; 22: 292–299. [DOI] [PubMed] [Google Scholar]
- 27.Pardridge WM. The blood-brain barrier: bottleneck in brain drug development. NeuroRx 2005; 2: 3–14. [DOI] [PMC free article] [PubMed] [Google Scholar]
- 28.Klohs J, Steinbrink J, Bourayou R, et al. Near-infrared fluorescence imaging with fluorescently labeled albumin: A novel method for non-invasive optical imaging of blood–brain barrier impairment after focal cerebral ischemia in mice. J Neurosci Meth 2009; 180: 126–132. [DOI] [PubMed] [Google Scholar]
- 29.Choy M, Cheung KK, Thomas DL, et al. Quantitative MRI predicts status epilepticus-induced hippocampal injury in the lithium-pilocarpine rat model. Epilepsy Res 2010; 88: 221–230. [DOI] [PubMed] [Google Scholar]
- 30.Nairismagi J, Grohn OHJ, Kettunen MI, et al. Progression of brain damage after status epilepticus and its association with epileptogenesis: a quantitative MRI study in a rat model of temporal lobe epilepsy. Epilepsia 2004; 45: 1024–1034. [DOI] [PubMed] [Google Scholar]
- 31.Roch C, Leroy C, Nehlig A, et al. Magnetic resonance imaging in the study of the lithium-pilocarpine model of temporal lobe epilepsy in adult rats. Epilepsia 2002; 43: 325–335. [DOI] [PubMed] [Google Scholar]
- 32.van Vliet EA, Otte WM, Wadman WJ, et al. Blood–brain barrier leakage after status epilepticus in rapamycin-treated rats I: magnetic resonance imaging. Epilepsia 2016; 57: 59–69. [DOI] [PubMed] [Google Scholar]
- 33.Marchi N, Fan Q, Ghosh C, et al. Antagonism of peripheral inflammation reduces the severity of status epilepticus. Neurobiol Dis 2009; 33: 171–181. [DOI] [PMC free article] [PubMed] [Google Scholar]
- 34.Marchi N, Oby E, Batra A, et al. In vivo and in vitro effects of pilocarpine: relevance to ictogenesis. Epilepsia 2007; 48: 1934–1946. [DOI] [PMC free article] [PubMed] [Google Scholar]
- 35.Tétrault S, Chever O, Sik A, et al. Opening of the blood–brain barrier during isoflurane anaesthesia. Eur J Neurosci 2008; 28: 1330–1341. [DOI] [PubMed] [Google Scholar]
- 36.Knight RA, Karki K, Ewing JR, et al. Estimating blood and brain concentrations and blood-to-brain influx by magnetic resonance imaging with step-down infusion of Gd-DTPA in focal transient cerebral ischemia and confirmation by quantitative autoradiography with Gd-[(14)C]DTPA. J Cereb Blood Flow Metab 2009; 29: 1048–1058. [DOI] [PMC free article] [PubMed] [Google Scholar]
- 37.Carson RE. PET physiological measurements using constant infusion. Nucl Med Biol 2000; 27: 657–660. [DOI] [PubMed] [Google Scholar]
- 38.van Vliet EA, da Costa AS, Redeker S, et al. Blood-brain barrier leakage may lead to progression of temporal lobe epilepsy. Brain 2007; 130: 521–534. [DOI] [PubMed] [Google Scholar]
- 39.Obermeier B, Daneman R, Ransohoff RM. Development, maintenance and disruption of the blood-brain barrier. Nat Med 2013; 19: 1584–1596. [DOI] [PMC free article] [PubMed] [Google Scholar]