

Abstract
High variability in infarct size is common in experimental stroke models and affects statistical power and validity of neuroprotection trials. The aim of this study was to explore cerebral collateral flow as a stratification factor for the prediction of ischemic outcome. Transient intraluminal occlusion of the middle cerebral artery was induced for 90 min in 18 Wistar rats. Cerebral collateral flow was assessed intra-procedurally using multi-site laser Doppler flowmetry monitoring in both the lateral middle cerebral artery territory and the borderzone territory between middle cerebral artery and anterior cerebral artery. Multi-modal magnetic resonance imaging was used to assess acute ischemic lesion (diffusion-weighted imaging, DWI), acute perfusion deficit (time-to-peak, TTP), and final ischemic lesion at 24 h. Infarct volumes and typology at 24 h (large hemispheric versus basal ganglia infarcts) were predicted by both intra-ischemic collateral perfusion and acute DWI lesion volume. Collateral flow assessed by multi-site laser Doppler flowmetry correlated with the corresponding acute perfusion deficit using TTP maps. Multi-site laser Doppler flowmetry monitoring was able to predict ischemic outcome and perfusion deficit in good agreement with acute MRI. Our results support the additional value of cerebral collateral flow monitoring for outcome prediction in experimental ischemic stroke, especially when acute MRI facilities are not available.
Keywords: Cerebral collateral flow, laser Doppler flowmetry, magnetic resonance imaging, middle cerebral artery occlusion, Wistar rat
Introduction
The failure of promising preclinical neuroprotective therapies to translate into successful clinical results raised discussions about the quality of preclinical trials.1,2 Among several aspects, attention should be addressed to the poor statistical power of most neuroprotection studies, mainly driven by small sample size and variability of lesion size in ischemic models. Several factors may account for this variability, including the collateral circulation.3,4 The collateral circulation is a subsidiary vascular network virtually able to provide residual perfusion to potentially salvageable cerebral regions after occlusion of a cerebral artery.5 It is emerging as a strong determinant of stroke outcome not only in humans,6 but also in experimental stroke models.3,4
In neuroprotection studies, predicting ischemic outcome before animal allocation would allow researchers to a priori stratify animals relying on the expected lesion size and to better control variability. Multi-modal magnetic resonance imaging (MRI) performed during occlusion has previously been used in neuroprotection studies.7–10 In particular, a strong correlation between acute and 24-h ischemic lesion was shown.11
While MRI provides spatial resolution, laser Doppler flowmetry (LDF) instead monitors real-time cortical perfusion within a precise cortical region, where a recording probe is positioned. A single LDF probe is commonly monitoring in the lateral middle cerebral artery (MCA) territory,12–15 but the perfusion threshold to stratify animals is not well standardized. In the present work, two probes were used for the monitoring of cortical perfusion in two different regions16: the lateral MCA territory and the borderzone between anterior and middle cerebral arteries (ACA-MCA) territories, in order to monitor the perfusion drop due to occlusion and the residual perfusion provided by the leptomeningeal anastomoses (i.e. collateral circulation), respectively. We previously showed a correlation between the collateral perfusion evaluated by multi-site LDF and both 24-h outcome3 and molecular penumbra.17
The aim of this study was to validate the predictive value of collateral flow assessment by multi-site LDF monitoring in the intraluminal MCA occlusion (MCAO) in rats, using MRI as a reference. The transient intraluminal MCA occlusion model in the rat was chosen for this study because no craniotomy was required to allow continuous multi-site cerebral hemodynamic monitoring during ischemia. The results show the additional value of multi-site LDF compared to single-site LDF for outcome prediction, suggesting its potential as a good alternative to MRI for controlling the variability of lesions.
Materials and methods
Animals and experimental design
The experimental protocol was approved by the Committee on Animal Care of the University of Milano Bicocca Italy, and of the CNRS (CREEA Rhône-Alpes, France, approval n°0274). Procedures were performed in accordance with the European Union Directive for animal experiments (2010/63/EU), the national guidelines on the use of laboratory animals (D.L. 116/1992), under project licence from the Italian Ministry of Health and French Decree 2013-118 and reported according to the ARRIVE (Animals in Research: Reporting In Vivo Experiments) guidelines.
Adult male Wistar Han rats (9–11 weeks old, Charles River Laboratories, L’Arbresle, France) were housed at a constant temperature of 22 ± 2℃ in Plexiglas cages bedded with wood dust in groups of six in a colony room maintained on a 12–12 h light–dark cycle (07:00–19:00), and were provided with food and water ad libitum. A single experimental group of 18 rats (250–300 g) was considered for this study, where the single animal represents the experimental unit. The sample size was estimated based on previous works.3,11
Experimental design is illustrated in Figure 1(a). On Day 0, animals underwent 90 min of focal cerebral ischemia induced by intraluminal MCAO. Surgical procedures were performed in the morning or afternoon in an equipped surgery room. Cerebral perfusion was monitored by multi-site LDF during surgery and occlusion induction. Afterwards, LDF probes were detached and animals were immediately transferred to the scanner to undergo multi-parametric MRI (T2-weighted imaging, diffusion-weighted imaging or DWI and perfusion-weighted imaging or PWI) for the respective evaluation of anatomy, acute lesion and perfusion during occlusion. The imaging session started approximately 40 min after onset of ischemia. After 90 min of ischemia, animals were reperfused outside the magnet. On Day 1, after 24 h of reperfusion, neurobehavioral assessment and T2-MRI imaging were performed. Animals were then euthanized under deep anesthesia, brains were extracted, and the occurrence of any subarachnoid hemorrhage, i.e. macroscopic bleeding around the circle of Willis, was evaluated ex-vivo.
Figure 1.

Experimental design and LDF monitoring. (a) On Day 0, animals (n = 18) underwent 90 min of focal cerebral ischemia induced by intraluminal MCAO. Cerebral perfusion was monitored by multi-site LDF during surgery up to occlusion induction and for 10 min after. Next, animals underwent multi-parametric MRI, including DWI and PWI for the respective evaluation of acute lesion and perfusion during occlusion. After 90 min of ischemia, animals were reperfused. On Day 1, after 24 h of reperfusion, neurobehavioral assessment and T2-MRI imaging were performed. (b) Probes’ position on the skull surface is shown. (c) Representative LDF tracings are shown for Probe 1 (upper tracing) and Probe 2 (lower tracing), baseline flow and perfusion deficit after MCAO are indicated (shaded portions). MCAO = middle cerebral artery occlusion; LDF = laser Doppler flowmetry; MRI = magnetic resonance imaging; DWI = diffusion-weighted imaging; PWI = perfusion-weighted imaging; ADC = apparent diffusion coefficient; TTP = time-to-peak.
The ability of LDF perfusion to predict 24-h infarct topology assessed by T2-MRI represents the primary outcome. The presence of a correlation between LDF perfusion with acute and 24-h lesion volumes assessed by MRI (DWI and T2, respectively), with 24-h neurobehavioral assessment and with acute PWI-MRI parameters represent the secondary outcomes.
Early death and signs of subarachnoid haemorrhage detected by MRI and ex-vivo evaluation were used as exclusion criteria. All investigators were blind to data obtained with other modalities than the one they performed and/or analyzed.
MCAO surgery
On Day 0, rats were anesthetized with 3% isoflurane air, and maintained with 1.5% isoflurane. Isofluorane was chosen for the possibility to control the level of anesthesia. Before surgery, animals received 0.05 mg/kg subcutaneous buprenorphine to alleviate pain, and throughout the surgical procedure their body temperature was monitored by a rectal thermometer and maintained to 37.0 ± 0.5℃ by a feedback-controlled heating pad. A silicon-coated filament (diameter 0.39 ± 0.02 mm, Doccol Corporation, Redlands, CA, USA) was inserted into the right external carotid artery and advanced in the internal carotid artery under multi-site LDF monitoring (see below), reaching and occluding the MCA origin. Immediately before filament insertion, common carotid artery (CCA) was transiently occluded and subsequently re-opened during ischemia and reperfusion. After 90 min, the filament was withdrawn and animals were allowed to recover and had free access to food and water.
Multi-site laser Doppler flowmetry
An LDF apparatus (dual channel moorVMS-LDF™, Moor, Axminster, UK) was used to continuously monitor cerebral perfusion during MCAO surgery, up to occlusion induction and for 10 min after. Two blunt needle probes (VP12, Moor, Axminster, UK) were firmly positioned on the intact skull surface, thanks to a custom-made silicon probe holder.16 The cranial coordinates for probes positioning were based on a rat brain atlas.18 A first probe (Probe 1) monitored perfusion within the lateral MCA territory, corresponding to the core territory of MCA (1 mm posterior to the Bregma and 5 mm lateral to the midline). A second probe (Probe 2) monitored perfusion within the borderzone territory between ACA and MCA territory (2 mm anterior to the Bregma and 2 mm lateral to the midline), where leptomeningeal anastomoses are likely to provide residual perfusion after occlusion induction. For both probes, the residual perfusion after occlusion was expressed as percentage of pre-ischemic baseline. We assessed baseline flow as the stable perfusion value in the 5–10 min immediately before the occlusion of the proximal cerebral arteries (external carotid artery, common carotid artery) in order to avoid the confounding effects of anesthesia and surgery. Probes positioning on the skull surface and representative LDF recordings are shown in Figure 1(b) and (c), respectively.
Magnetic resonance imaging
MRI experiments were performed on a Bruker Biospec 7 T/12 cm horizontal magnet equipped with Paravision 5.0 (Bruker, Ettlingen, Germany). A birdcage head coil of 72 mm inner diameter was used for radiofrequency transmission, and a 25 mm diameter surface coil was used for reception. The rats were placed in a cradle equipped with a stereotaxic holder, an integrated heating system to maintain body temperature at 37 ± 1℃, and a pressure probe to monitor respiration.
During arterial occlusion, DWI echo planar imaging (EPI) spin-echo images were acquired using field of view (FOV) = 3.0 × 1.5 cm2, fifteen contiguous slices of 1 mm thickness, with matrix = 128 × 64, echo time/repetition time (TE/TR) = 22.75/5250 ms, and six b-values (100, 200, 400, 600, 800, 1000 s/mm2) for a total duration of 4 min 54 s. PWI was performed with multislice dynamic susceptibility contrast-enhanced MRI (DSC-MRI), using an EPI gradient-echo sequence with the same FOV and slice characteristics, matrix = 80 × 40 and TE/TR 6.61/600 ms, for a total duration of 1 min. One hundred consecutive images were acquired per slice with a time resolution of 0.6 s during before, during and after the intravenous injection of a 200 -µmol/kg bolus of gadolinium (Dotarem, Guerbet Aulnay-sous-Bois, France). After 24 h of reperfusion, T2-weighted images were acquired using a RARE sequence with the same FOV and slice characteristics, matrix = 256 × 128, effective TE/TR = 60.28/3500 ms, RARE factor 8 and 4 averages (total duration: 2 min 48 s).
Image analysis
Apparent diffusion coefficient (ADC) maps (in mm2/s) were calculated by fitting MR signal curves to a monoexponential model function on a pixel-by-pixel basis using in-house software written in Matlab 2009 (MathWorks, Natick, MA, USA). Time to peak (TTP) maps (in s) were calculated after converting the signal–time curves to concentration–time curve according to: as the time between the first T2*-weighted measurement and the bolus peak.19
Images were analyzed on MIPAV software (Medical Image Processing And Visualization, NIH, Bethesda, MD; http://mipav.cit.nih.gov/).20 For the evaluation of acute ischemic lesion, the ipsilateral regions encompassing hypointense signal (compared to contralateral hemisphere) were manually outlined on ADC maps. Subsequently, the acute ischemic lesion was segmented in these regions by applying the already reported viability threshold of 0.53 × 10⁻³ mm2/s21 and lesion volume (expressed in mm3) was calculated as the summation of the lesion areas multiplied by slice thickness (1 mm). For the evaluation of cerebral perfusion, TTP maps were used. Ipsilateral and contralateral ROIs covering the upper cortex were delineated on the two slices corresponding to the two regions of LDF monitoring: slice anatomically identified as Bregma−1 and Bregma+2, for Probe 1 and Probe 2, respectively. The ipsilateral and contralateral average TTP values were considered. Assuming the contralateral perfusion to be comparable to pre-ischemic perfusion,22 the difference between ipsilateral and contralateral TTP values (relative TTP) was considered to reflect the residual perfusion monitored by LDF
where represents the TTP of ipsilateral cortex and represents the TTP of contralateral cortex.
24-h ischemic outcome evaluation
On Day 1, ischemic outcome was evaluated after 24 h of reperfusion by both neurobehavioral testing and T2-weighted MRI for the assessment of infarct volume.
Just before Day 1 MRI acquisitions, rats were evaluated for spontaneous activity, motor and sensitive function and scored on a scale from 3 (most severe) to 18 (no deficit).23 For the evaluation of 24-h infarct lesion, the ipsilateral areas of hyperintense signal (i.e. ischemic lesion) and the ipsilateral and contralateral hemisphere areas were manually defined on T2-weighted images. The typology of the ischemic lesions was visually evaluated and animals were subsequently divided in two groups: large hemispheric lesions (corticostriatal lesions, Group A) and basal ganglia lesions (subcortical lesions, Group B). In addition, infarct areas were calculated and corrected for asymmetries due to cerebral edema using the formula24
Corrected infarct volume (expressed in mm3) was subsequently calculated as the summation of the corrected lesion areas multiplied by slice thickness (1 mm).
Supplementary analyses were performed for the evaluation of the ischemic lesion (see Supplementary Material and Methods). Lesion volumes were also calculated and corrected for edema according to an alternative formula.25 Moreover, histological staining Cresyl violet was used as a complementary method for lesion visualization and volume calculation.
Statistical analysis
All results are expressed as mean ± standard deviation, except for neurobehavioral scores which are expressed as median [min; max]. Statistical analyses were performed using GraphPad Prism software. Unpaired Student’s t-test was used for two-group analysis, while correlation and linear regression analysis were computed with Pearson’s r test. Regression analyses were not forced through 0. A value of p < 0.05 was considered significant.
Receiver operator characteristics (ROC) analysis was performed to identify the optimal LDF (i.e. residual perfusion) threshold values for the prediction of animals developing a large hemispheric infarct at 24 h (see Supplementary Material and Methods). The area under curve (AUC) was considered as an indicator of prediction ability (ranging from 1 = best to 0.5 = worst).
Results
A total number of 18 rats were enrolled in the study. Three rats did not complete the protocol because of early death after ischemia, likely due to anesthesiological complications or/and massive infarcts. Hence, 15 rats were included in the analysis. No signs of subarachnoid haemorrhage were detected by MRI or by ex-vivo evaluation.
Evaluation of outcome at 24 h post-reperfusion
Animals with a large hemispheric lesion, characterized by a significant involvement of the sensori-motor cortex, were assigned to Group A (n = 9, Figure 2(a)). Animals with a lesion mainly restricted to basal ganglia were assigned to Group B (n = 6, Figure 2(b)). In Group A, lesion volumes (208 ± 61 mm3, n = 9) were higher than in Group B (68 ± 32 mm3, n = 6) and no overlap was present between the two groups (Figure 2(c)). According to these results, Group A animals showed higher deficits, resulting in lower neurobehavioral scores (9 [6; 12]) compared to Group B (17 [14; 18], n = 6) and no overlap between the two groups (Figure 2(d)). Similar results were obtained with lesion volumes corrected for edema according to an alternative formula25 (Supplementary Figure 1). Excellent matching between histological and T2 images lesion visualization and volume is shown in Supplementary Figure 2.
Figure 2.

Evaluation of post-reperfusion ischemic outcome. Representative T2-weighted images showing a large hemispheric (a) and basal ganglia (b) lesion, visible as hyperintense areas (contoured). (c) Ischemic lesion volumes of Group A were higher compared to Group B and no overlap was present between the two groups (dot-dashed line). (d) Neurobehavioral scores in Group A were lower (higher deficit) compared to Group B and no overlap was present between the two groups (dot-dashed line). Black spots = Group A animals (n = 9); White spots = Group B animals (n = 6).
Diffusion-weighted magnetic resonance imaging for the prediction of ischemic outcome
Acute lesion was visually evaluated on ADC maps (Figure 3(a) to (d)) and, as expected, group distribution was found to exactly match that of 24-h lesion. In other words, animals presenting an acute (D0) lesion with a given typology (large hemispheric or basal ganglia) were presenting the same lesion typology at 24 h (D1). In addition, acute lesion volume quantified on ADC maps positively correlates with 24-h lesion volume calculated on T2-weighted images (p < 0.0001, Pearson’s r 0.91, Figure 3(e)).
Figure 3.
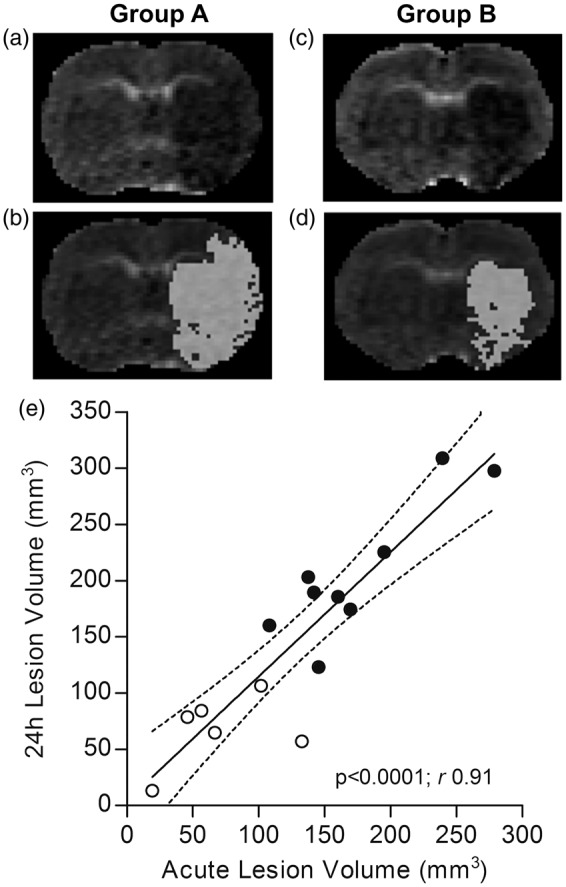
Evaluation of acute ischemic lesion on DWI-MRI and correlation with 24-h ischemic lesion. Representative ADC maps showing a large hemispheric (a) and basal ganglia (c) lesion, visible as hypointense areas (same animals as in Figure 2). Corresponding segmentation masks of the lesion (viability threshold value 0.53 × 10⁻³ mm2/s) are superimposed on the ADC maps (b and d). (e) Acute lesion volumes positively correlate with 24-h lesion volumes, with a slope of 1.11 ± 0.14. Dotted lines represent the 95% confidence interval of the regression line. Black spots = Group A animals (n = 9); White spots = Group B animals (n = 6). DWI = diffusion-weighted imaging; MRI = magnetic resonance imaging; ADC = apparent diffusion coefficient.
Multi-site laser Doppler flowmetry for the prediction of ischemic outcome
Cerebral perfusion was monitored by two probes within two different regions of the ischemic cortex: lateral MCA territory (Probe 1) and ACA-MCA borderzone territory (Probe 2). Monitoring with Probe 2 encountered technical problems for one rat. This unreliable data was subsequently excluded from the analysis.
Residual perfusion values monitored by Probe 1 did not correlate with the 24-h ischemic outcome, neither in terms of infarct volume (p = 0.15, Pearson’s r −0.39, Figure 4(a)) nor neuroscore (p = 0.54, Pearson’s r 0.17, Figure 4(c)). In contrast, Probe 2 residual perfusion values correlated with 24-h ischemic outcome, both for infarct volume (p < 0.01, Pearson’s r −0.70, Figure 4(b)) and neuroscore (p < 0.01, Pearson’s r 0.68, Figure 4(d)). Furthermore, residual perfusion values monitored by Probe 1 did not correlate with the acute lesion volume (p = 0.06, Pearson’s r −0.51, Figure 4(e)), whereas Probe 2 perfusion did (p < 0.05, Pearson’s r −0.65, Figure 4(f)). Similar results were obtained when using an alternative formula for edema correction25 (Supplementary Figure 1).
Figure 4.

Multi-site LDF perfusion monitoring and correlation with acute lesion and 24-h ischemic outcome. No significant correlation was observed between Probe 1 perfusion values and 24-h ischemic outcome, neither in terms of ischemic lesion volumes (a) and neuroscores (c), nor acute lesion volumes (e). In contrast, a negative correlation was observed between Probe 2 perfusion values and both 24-h ischemic outcome, in terms of ischemic lesion volumes (b) and neuroscores (d), and acute lesion volumes (f). The 53% perfusion value threshold discriminating between group A and B is shown in B and D (dot-dashed line). Dotted lines represent the 95% confidence interval of the regression line. Black spots = Group A animals (n = 9 in a, c and e; n = 8 in b, d and f); White spots = Group B animals (n = 6). The arrowhead in F indicates two overlapped spots. LDF = laser Doppler flowmetry.
As LDF monitors cortical perfusion, the correlations between residual perfusion values monitored by Probe 1 and 2 and the cortical component of acute and 24-h lesions were also explored (Supplementary Figure 3): perfusion from both probes correlated with acute and 24-h cortical infarct volumes, but these correlations were stronger in the case of Probe 2.
Interestingly, residual perfusion values monitored by Probe 1 were not significantly different (p = 0.34) between Group A (37% ± 15%, n = 9) and B (46% ± 17%, n = 6) (Figure 5(a)). On the contrary, residual perfusion values monitored by Probe 2 were significantly higher (p < 0.001) in Group B (60% ± 6%, n = 6) than in Group A (45% ± 6%, n = 8) (Figure 5(b)). In particular, a value of 53% residual perfusion recorded by Probe 2 was identified by ROC analysis (Supplementary Figure 4) as a threshold dividing the two groups with a 100% specificity and 100% sensitivity (Supplementary Table 1), with Group A and B presenting lower and higher values, respectively (Figure 5(b), dotted line). In contrast, Probe 1 values between the two groups presented a wide overlap (Figure 5(a)) and a 39% residual perfusion was identified as optimal threshold (i.e. maximizing specificity and sensitivity), resulting in 83% specificity and 55% sensitivity (Supplementary Table 1). Residual perfusion values recorded by Probe 1 and Probe 2 in the same animals were not significantly correlated (p = 0.07, Pearson’s r 0.50, Supplementary Figure 5).
Figure 5.

Multi-site LDF perfusion monitoring and infarct typology classification. (a) Groups A and B perfusion values monitored by Probe 1 are not significantly different and are largely overlapping. (b) Groups A and B perfusion values monitored by Probe 2 are significantly different and a 53% value was identified as a threshold discriminating between the two groups (dot-dashed line). Black spots = Group A animals (n = 9 in A; n = 8 in B); White spots = Group B animals (n = 6). ***P < 0.001. LDF = laser Doppler flowmetry.
Perfusion-weighted magnetic resonance imaging and laser Doppler flowmetry for the evaluation of cerebral perfusion
The cortical perfusion was evaluated on TTP maps within slices encompassing the two cortical regions of LDF monitoring: slices anatomically identified as Bregma−1 and Bregma+2 for Probe 1 and Probe 2, respectively, shown in Figure 6(a) and (b). TTP values were significantly higher for Group A compared to Group B in both Bregma−1 (p < 0.05, Figure 6(c)) and Bregma + 2 (p < 0.05, Figure 6(d)) slices. Interestingly, residual perfusion values monitored by Probe 2 negatively correlated with corresponding TTP values (p < 0.05, Pearson’s r −0.61, Figure 6(f)), whereas Probe 1 residual perfusion values did not correlate with corresponding TTP values (p = 0.34, Pearson’s r −0.27, Figure 6(e)).
Figure 6.

Cerebral perfusion evaluated by PWI-MRI and multi-site LDF. (A and B) Ipsilateral and contralateral TTP values measured within cortical ROIs delineated on the two slices corresponding to the two regions of LDF monitoring: slice anatomically identified as Bregma−1 (a) and Bregma + 2 (b), for Probe 1 and Probe 2, respectively (yellow, left hemisphere: contralateral ROI; red, right hemisphere: ipsilateral ROI). Relative TTP values (delay of bolus peak between the contralateral and ipsilateral hemisphere) were significantly different between Group A and B for both slice Bregma−1 (Probe 1 position) (c) and Bregma + 2 (Probe 2 position) (d). (e) No significant correlation was observed between Probe 1 residual perfusion values and corresponding TTP values. (f) A negative correlation was observed between Probe 2 residual perfusion values and corresponding TTP values. Dotted lines represent the 95% confidence interval of the regression line. Black spots = Group A animals (n = 9); White spots = Group B animals (n = 6). *P < 0.05. LDF = laser Doppler flowmetry; PWI = perfusion-weighted imaging; MRI = magnetic resonance imaging; TTP = time-to-peak.
Discussion
The aim of this study was to validate collateral flow assessment by multi-site LDF for the prediction of the 24-h ischemic outcome, using multi-modal MRI. Using the intraluminal model of 90-min MCAO in rats, we observed a variable lesion size after the same surgical procedure, as commonly reported by other groups.26 The presence or lack of a significant cortical involvement (as in large hemispheric and basal ganglia infarcts, respectively) can be influenced by exogenous (surgery, filament) and endogenous (collaterals) factors. Outcome variability of ischemic stroke models represents one of the several aspects that may participate in the translational failure of neuroprotective strategies.1 Indeed, variability affects sample homogeneity, implying a higher number of animals required to reach an optimal statistical power.
Different methods have been used in experimental stroke research to assess correct MCAO induction. (i) The presence of neurological deficits during arterial occlusion has been widely used in the past as an inclusion criteria, but was shown not predictive of final infarct.11 (ii) Imaging perfusion deficit, acute lesion or vascular occlusion on MRI (PWI-MRI, DWI-MRI and Magnetic Resonance Angiography or MRA, respectively) certainly represents the method of choice for the prediction of lesion extent,27 but it is expensive and not widely available to stroke basic scientists. However, the development of benchtop MRI systems could enable a more widespread use of imaging in the future.28 As disadvantages, MRI requires manipulation of the animal during occlusion (accompanied by the risk of thread displacement) and does not provide intra-surgical information. (iii) LDF has been frequently used to monitor cerebral blood flow drop at occlusion induction in several stroke models, including the intraluminal MCA occlusion.12–15,29 This simple and flexible option is probably a method of choice for multicentre neuroprotection studies, provided that its application can be standardized. Different perfusion drop values are considered to confirm intraluminal MCAO induction, varying in the range of 60–80%,12–15,30 or being not specified.31 A single monitoring probe is commonly positioned in the lateral MCA territory of the parietal cortical surface, more frequently after craniotomy,12–15 while a less invasive approach through intact skull may be considered.16,30
In the present study, multi-site LDF recorded cerebral perfusion in both lateral MCA territory and ACA-MCA borderzone (collaterals territory) at MCAO induction, thanks to a custom-made probe holder allowing for a precise and stable positioning of two probes over the intact skull surface.16 Although the distance between Probe 1 and Probe 2 is only a few millimeters, our current findings and our previously published results3 clearly demonstrated that these probes monitor two hemodynamically different territories during MCA occlusion: a lateral MCA territory (Probe 1), which is more densely ischemic after MCA occlusion and receives less collateral flow, and a medial MCA territory (Probe 2), which receives more collateral flow (ACA-MCA anastomoses) during MCA occlusion. Cerebral perfusion evaluated by LDF in the collaterals territory correlated with ischemic outcome after 24 h of reperfusion, both in terms of infarct volume and neuroscore, and acute lesion volumes correlated with 24-h infarct volumes, confirming our previous results.3,11
Interestingly, different 24-h infarct typologies (i.e. large hemispheric or basal ganglia infarcts) were correctly a priori identified relying on both visual evaluation of the MRI acute ischemic lesion and LDF perfusion monitored in the collaterals territory (but not in the lateral MCA territory). Indeed, the best predictive value was provided by Probe 2 (AUC = 1), versus a weaker predictive value provided by Probe 1 (AUC = 0.66) (See Supplementary Figure 4). Accordingly, a 53% residual perfusion recorded by Probe 2 was identified as a threshold associated with 100% specificity and 100% sensitivity, i.e. complete and correct segregation of infarct types. A 39% residual perfusion was identified as the optimal threshold (i.e. maximizing the specificity and sensitivity) for Probe 1, associated with 83% specificity and 56% sensitivity. The 39% perfusion threshold value obtained for Probe 1 is in the range of values reported in the literature for the prediction of large hemispheric infarcts (i.e. <40–20% residual perfusion). Of note, if this threshold had been applied for animal stratification in our study, one animal with a basal ganglia infarct (false positive) would have been wrongly included, and four animals with large hemispheric infarct (false negative) would have been wrongly excluded. This misclassification would have a strong impact in a neuroprotection study.
In order to confirm that LDF perfusion monitored in a restricted cortical area is reflecting the actual perfusion, the latter was evaluated on TTP maps computed from per-occlusion PWI-MRI and compared to LDF perfusion. In other words, the correlation between LDF and MRI perfusion was used as a surrogate for LDF reliability. As expected, cortical perfusion was significantly lower for the large hemispheric compared to basal ganglia infarcts, in both slices corresponding to Probe 1 and Probe 2 monitoring sites (Bregma−1 and Bregma+2, respectively). Notably, TTP values correlated with LDF perfusion only for Probe 2 and not for Probe 1, suggesting a weaker reliability of Probe 1 compared to Probe 2.
The current assumption is that perfusion recorded by Probe 1 results from the drop in perfusion in the MCA core territory. Nonetheless, we cannot exclude that the perfusion recorded by Probe 1 might also be influenced by the posterior collateral perfusion (i.e. leptomeningeal anastomoses between the posterior and the middle cerebral artery). In addition, a monitoring bias might have been introduced by probe placement in the vicinity of a major arterial vessel. This event is more likely to happen in Probe 1 area (located close to MCA branches, where macrocirculation predominates) rather than in Probe 2 area (located in the borderzone ACA-MCA territory, where microcirculation predominates). Therefore, a “contamination” of Probe 1 recording might have occurred in some animals and may at least partially explain the larger scatter of Probe 1 values compared to Probe 2, and the lack of correlation between TTP and LDF values for this same probe. Although both probes are likely to be correlated at a populational level (see Supplementary Figure 5), our results clearly demonstrate a stronger predictive ability for Probe 2 compared Probe 1 at an individual level (See supplementary Table 1). Our hypothesis is that cortical involvement is mainly determined by the extent of collateral flow, hence the advantage of monitoring this parameter (with Probe 2) in addition to the perfusion drop in the core territory of the MCA (with Probe 1).
A major limitation of this study is the small sample size. Nevertheless, we were able to obtain reliable stratification based on Probe 2 perfusion value despite n = 15. On the other hand, if a higher sample size was considered, Probe 2 perfusion values would certainly overlap between groups A and B. Indeed, perfusion values of both groups were close to the 53% perfusion threshold for Probe 2, with subsequent wide 95% confidence intervals of both sensitivity and specificity values (see Supplementary Table 1). Further studies in independent laboratories including larger sample size are necessary to confirm the efficiency of multi-site LDF stratification. Generally, in order to apply multi-site LDF to a larger experimental stroke study, we would suggest researchers to perform a pilot study for the identification of the optimal perfusion drop threshold in their own experimental setting, which can be defined as that maximizing specificity and sensitivity in case of uncomplete separation of the two groups (see Supplementary Figure 4). Alternatively, the complete exclusion of false positives might represent the priority over the exclusion of false negative: if a basal ganglia infarct is a priori misclassified as large hemispheric infarct (i.e. false positive) and subsequently allocated in a treatment group, its small volume on follow-up will be wrongly interpreted as a result of the neuroprotective effect. In an attempt to minimize false positives, the threshold value associated with the highest specificity should be identified. Nonetheless, if on the one hand the exclusion of animals would reduce variability, on the other the overall number of animals required for a neuroprotection study would increase. In order to avoid this drawback, the additional information provided by monitoring collateral flow could also be used to evaluate a potential confounding effect resulting from a differential pre-treatment cerebral perfusion between experimental groups: if a treatment effect is observed, but a better pre-treatment collateral perfusion is monitored in a treatment group compared to control group, the positive treatment results should be interpreted with care. Otherwise, if pre-treatment collateral perfusion is comparable between treatment and control groups, the pre-treatment variability of ACA-MCA collateral flow is unlikely to have confounded results.
Another limitation is represented by the lack of simultaneous assessment of multi-site LDF and MRI, which would have required amagnetic LDF probes and compatible surface head coils. As a consequence, LDF perfusion monitoring was not performed during the whole period of ischemia, including reperfusion. However, our previously published results showed stable LDF signal during intraluminal MCAO over 60 min3 and 90 min,17 and successful reperfusion in all animals in both studies (n = 20 and n = 25, respectively). In neuroprotection studies, multi-site LDF could be used to continuously monitor perfusion, helping in identifying any animals with delayed or no reperfusion. Of note, a recent work in mice showed that ADC lesion volumes during MCAO predicted final infarct volumes for 90-min MCAO, but not for 45-min MCAO,32 thus further investigation in future studies should evaluate the predictive value of LDF for different occlusion durations.
In summary, multi-site LDF for the monitoring of collateral flow was in agreement with multi-modal acute MRI for the prediction of ischemic outcome in experimental ischemic stroke. We propose this approach to a priori stratify animals in neuroprotection studies, in order to enhance sample homogeneity and contribute to the refinement and eventual reduction of the use of animals in research. The additional value of multi-site LDF compared to single-site LDF highlights its potential for outcome prediction in experimental ischemic stroke, especially for laboratories in which MRI is not accessible.
Supplementary Material
Acknowledgements
Experiments were performed on CERMEP – Imagerie du vivant, Bron, F-69677, France, imaging facilities. We thank Jean-Baptiste Langlois and Radu Bolbos for the technical assistance with MRI.
Funding
The author(s) disclosed receipt of the following financial support for the research, authorship, and/or publication of this article: This study was supported by the Italian Ministry of University and Research (MIUR, FAR12-01-138-2002100) and Université Lyon 1.
Declaration of conflicting interests
The author(s) declared no potential conflicts of interest with respect to the research, authorship, and/or publication of this article.
Authors’ contributions
EC was responsible data analysis and interpretation and manuscript drafting. AV, THC, FC, and DC were responsible for MCAO surgery and LDF monitoring. EO and MW were responsible for neurobehavioral testing. SB was responsible for LDF data analysis. MW was responsible for MRI images processing. EC, LPB, RC, and LM were responsible for MRI images analysis. EC, RC, and LM were responsible for cerebral tissue processing, histological staining, and images analysis. FC, SB, and MW were responsible for study design, data interpretation, and critical article revision. All authors contributed to the interpretation of data, critical article revision, and gave final approval of the version to be published.
Supplementary material
Supplementary material for this paper can be found at http://jcbfm.sagepub.com/content/by/supplemental-data
Data availability
Data are available upon request to the corresponding author.
References
- 1.Dirnagl U. Bench to bedside: the quest for quality in experimental stroke research. J Cereb Blood Flow Metab 2006; 26: 1465–1478. [DOI] [PubMed] [Google Scholar]
- 2.Dirnagl U, Fisher M. International, multicenter randomized preclinical trials in translational stroke research: it's time to act. J Cereb Blood Flow Metab 2012; 32: 933–935. [DOI] [PMC free article] [PubMed] [Google Scholar]
- 3.Riva M, Pappada GB, Papadakis M, et al. Hemodynamic monitoring of intracranial collateral flow predicts tissue and functional outcome in experimental ischemic stroke. Exp Neurol 2012; 233: 815–20. [DOI] [PubMed] [Google Scholar]
- 4.Zhang H, Prabhakar P, Sealock R, et al. Wide genetic variation in the native pial collateral circulation is a major determinant of variation in severity of stroke. J Cereb Blood Flow Metab 2010; 30: 923–934. [DOI] [PMC free article] [PubMed] [Google Scholar]
- 5.Liebeskind DS. Collateral circulation. Stroke 2003; 34: 2279–2284. [DOI] [PubMed] [Google Scholar]
- 6.Miteff F, Levi CR, Bateman GA, et al. The independent predictive utility of computed tomography angiographic collateral status in acute ischaemic stroke. Brain 2009; 132: 2231–8. [DOI] [PubMed] [Google Scholar]
- 7.Bardutzky J, Meng X, Bouley J, et al. Effects of intravenous dimethyl sulfoxide on ischemia evolution in a rat permanent occlusion model. J Cereb Blood Flow Metab 2005; 25: 968–977. [DOI] [PMC free article] [PubMed] [Google Scholar]
- 8.Chauveau F, Cho TH, Perez M, et al. Brain-targeting form of docosahexaenoic acid for experimental stroke treatment: MRI evaluation and anti-oxidant impact. Curr Neurovasc Res 2011; 8: 95–102. [DOI] [PubMed] [Google Scholar]
- 9.Cho TH, Aguettaz P, Campuzano O, et al. Pre- and post-treatment with cyclosporine A in a rat model of transient focal cerebral ischaemia with multimodal MRI screening. Int J Stroke 2013; 8: 669–674. [DOI] [PubMed] [Google Scholar]
- 10.Minematsu K, Fisher M, Li L, et al. Diffusion and perfusion magnetic resonance imaging studies to evaluate a noncompetitive N-methyl-D-aspartate antagonist and reperfusion in experimental stroke in rats. Stroke 1993; 24: 2074–2081. [DOI] [PubMed] [Google Scholar]
- 11.Chauveau F, Cho TH, Riou A, et al. Does acute behavioral testing reflect successful ischemia in rats with transient middle cerebral artery occlusion? Int J Stroke 2012; 7: 465–472. [DOI] [PubMed] [Google Scholar]
- 12.Esposito E, Mandeville ET, Hayakawa K, et al. Effects of normobaric oxygen on the progression of focal cerebral ischemia in rats. Exp Neurol 2013; 249: 33–38. [DOI] [PMC free article] [PubMed] [Google Scholar]
- 13.Hungerhuber E, Zausinger S, Westermaier T, et al. Simultaneous bilateral laser Doppler fluxmetry and electrophysiological recording during middle cerebral artery occlusion in rats. J Neurosci Meth 2006; 154: 109–115. [DOI] [PubMed] [Google Scholar]
- 14.Kläsner B, Lumenta DB, Pruneau D, et al. Therapeutic window of bradykinin B2 receptor inhibition after focal cerebral ischemia in rats. Neurochem Int 2006; 49: 442–447. [DOI] [PubMed] [Google Scholar]
- 15.Taninishi H, Jung JY, Izutsu M, et al. A blinded randomized assessment of laser Doppler flowmetry efficacy in standardizing outcome from intraluminal filament MCAO in the rat. J Neurosci Meth 2015; 241: 111–120. [DOI] [PubMed] [Google Scholar]
- 16.Beretta S, Riva M, Carone D, et al. Optimized system for cerebral perfusion monitoring in the rat stroke model of intraluminal middle cerebral artery occlusion. J Vis Exp 2013; (72): 50214. [DOI] [PMC free article] [PubMed]
- 17.Beretta S, Cuccione E, Versace A, et al. Cerebral collateral flow defines topography and evolution of molecular penumbra in experimental ischemic stroke. Neurobiol Dis 2015; 74: 305–313. [DOI] [PubMed] [Google Scholar]
- 18.Paxinos G and Watson C. The rat brain in stereotaxic coordinates. 6th ed. San Diego, CA: Academic Press, 2007.
- 19.Neumann-Haefelin T, Wittsack HJ, Wenserski F, et al. Diffusion- and perfusion-weighted MRI. The DWI/PWI mismatch region in acute stroke. Stroke 1999; 30: 1591–1597. [DOI] [PubMed] [Google Scholar]
- 20.McAuliffe MJ, Lalonde FM, McGarry D, et al. Medical Image Processing, Analysis and Visualization in clinical research. In: 14th IEEE symposium on computer-based medical systems, 2001. CBMS 2001, Bethesda, MD, 26–27 July 2001, pp.381–386.
- 21.Shen Q, Meng X, Fisher M, et al. Pixel-by-pixel spatiotemporal progression of focal ischemia derived using quantitative perfusion and diffusion imaging. J Cereb Blood Flow Metab 2003; 23: 1479–1488. [DOI] [PMC free article] [PubMed] [Google Scholar]
- 22.Schmid-Elsaesser R, Zausinger S, Hungerhuber E, et al. A critical reevaluation of the intraluminal thread model of focal cerebral ischemia: evidence of inadvertent premature reperfusion and subarachnoid hemorrhage in rats by laser-Doppler flowmetry. Stroke 1998; 29: 2162–2170. [DOI] [PubMed] [Google Scholar]
- 23.Garcia JH, Wagner S, Liu KF, et al. Neurological deficit and extent of neuronal necrosis attributable to middle cerebral artery occlusion in rats. Statistical validation. Stroke 1995; 26: 627–634. discussion 635. [DOI] [PubMed] [Google Scholar]
- 24.Leach MJ, Swan JH, Eisenthal D, et al. BW619C89, a glutamate release inhibitor, protects against focal cerebral ischemic damage. Stroke 1993; 24: 1063–1067. [DOI] [PubMed] [Google Scholar]
- 25.Gerriets T, Stolz E, Walberer M, et al. Noninvasive quantification of brain edema and the space-occupying effect in rat stroke models using magnetic resonance imaging. Stroke 2004; 35: 566–571. [DOI] [PubMed] [Google Scholar]
- 26.Howells DW, Porritt MJ, Rewell SS, et al. Different strokes for different folks: the rich diversity of animal models of focal cerebral ischemia. J Cereb Blood Flow Metab 2010; 30: 1412–1431. [DOI] [PMC free article] [PubMed] [Google Scholar]
- 27.Bouts MJ, Tiebosch IA, van der Toorn A, et al. Early identification of potentially salvageable tissue with MRI-based predictive algorithms after experimental ischemic stroke. J Cereb Blood Flow Metab 2013; 33: 1075–1082. [DOI] [PMC free article] [PubMed] [Google Scholar]
- 28.Caysa H, Metz H, Mäder K, et al. Application of Benchtop-magnetic resonance imaging in a nude mouse tumor model. J Exp Clin Cancer Res 2011; 30: 69. [DOI] [PMC free article] [PubMed] [Google Scholar]
- 29.Henninger N, Bouley J, Bratane BT, et al. Laser Doppler flowmetry predicts occlusion but not tPA-mediated reperfusion success after rat embolic stroke. Exp Neurol 2009; 215: 290–297. [DOI] [PubMed] [Google Scholar]
- 30.Harada H, Wang Y, Mishima Y, et al. A novel method of detecting rCBF with laser-Doppler flowmetry without cranial window through the skull for a MCAO rat model. Brain Res Brain Res Protoc 2005; 14: 165–170. [DOI] [PubMed] [Google Scholar]
- 31.Zhao H, Mayhan WG, Sun H. A modified suture technique produces consistent cerebral infarction in rats. Brain Res 2008; 1246: 158–166. [DOI] [PMC free article] [PubMed] [Google Scholar]
- 32.Leithner C, Fuchtemeier M, Jorks D, et al. Infarct volume prediction by early magnetic resonance imaging in a murine stroke model depends on ischemia duration and time of imaging. Stroke 2015; 46: 3249–3259. [DOI] [PubMed] [Google Scholar]
Associated Data
This section collects any data citations, data availability statements, or supplementary materials included in this article.
Supplementary Materials
Data Availability Statement
Data are available upon request to the corresponding author.