

Abstract
Insulin resistance (IR) is associated with poor cerebrovascular health and increased risk for dementia. Little is known about the unique effect of IR on both micro- and macrovascular flow particularly in midlife when interventions against dementia may be most effective. We examined the effect of IR as indexed by the Homeostatic Model Assessment of Insulin Resistance (HOMA-IR) on cerebral blood flow in macro- and microvessels utilizing magnetic resonance imaging (MRI) among cognitively asymptomatic middle-aged individuals. We hypothesized that higher HOMA-IR would be associated with reduced flow in macrovessels and lower cortical perfusion. One hundred and twenty cognitively asymptomatic middle-aged adults (57 ± 5 yrs) underwent fasting blood draw, phase contrast-vastly undersampled isotropic projection reconstruction (PC VIPR) MRI, and arterial spin labeling (ASL) perfusion. Higher HOMA-IR was associated with lower arterial blood flow, particularly within the internal carotid arteries (ICAs), and lower cerebral perfusion in several brain regions including frontal and temporal lobe regions. Higher blood flow in bilateral ICAs predicted greater cortical perfusion in individuals with lower HOMA-IR, a relationship not observed among those with higher HOMA-IR. Findings provide novel evidence for an uncoupling of macrovascular blood flow and microvascular perfusion among individuals with higher IR in midlife.
Keywords: Alzheimer’s, arterial spin labeling, cerebral blood flow, cerebrovascular disease, diabetes
Introduction
Vascular health plays an integral role in trajectories of brain aging.1–3 Decreased cerebral blood flow (CBF) is commonly observed in normal aging4,5 and deficits in CBF are worsened by vascular risk factors.6,7 Furthermore, lower CBF is also associated with lower cognitive function.6,8 Vascular dementia (VaD) is characterized by inadequate CBF, and patients with dementia due to Alzheimer disease (AD)9–11 often present with cerebrovascular disease as well as neuropathological changes associated with AD (i.e. amyloid deposition and neurofibrillary tangle aggregation). While reduced CBF is known to be involved in age-related dementias, it is particularly remarkable in AD and VaD.12 Recently, human brain imaging studies suggest that altered cortical CBF may precede development of dementia due to AD, with lower CBF observed in individuals who harbor invariable AD risk factors.9 Indeed, vascular dysfunction has long been considered a concomitant or contributing facet of dementia, including but not limited to AD.11,13,14
Cerebrovascular health, and therefore CBF, is moderated by several modifiable risk factors including central obesity, high blood pressure, and insulin resistance (IR), offering possible therapeutic targets to prevent the onset of pathological brain changes. IR, in particular, is associated with cerebrovascular disease, cognitive decline, and development of neuropathological features of AD.15–18 Metabolic syndrome—a cluster of cardiovascular risk factors characterized by IR—is also linked to cognitive decline and dementia, and has previously been associated with decreased cortical perfusion.6,19,20 While prior studies have examined the relationship between IR and CBF, the impact on macrovascular blood flow and the microvessels they supply is still incompletely known, and relationships between blood flow and IR among those who have not yet converted to disease state (i.e. diabetes mellitus (DM)) are currently unknown. This is important, given that IR as indexed by HOMA-IR may be reversible prior to the onset of DM. Furthermore, the individual impact of IR versus comorbidities (including central obesity, dyslipidemia, and hypertension) has been difficult to define, particularly in midlife irrespective of DM, due in part to studies that vary in methods for measuring CBF, age of participants, and the presence of confounding factors such as existing neurologic dysfunction.
The current study examined the relationship between IR as indexed by the Homeostatic Model Assessment of Insulin Resistance (HOMA-IR) and cerebrovascular health as measured in both macro- and microvessels among middle-aged participants enriched for AD risk factors, including apolipoprotein E (APOE) ɛ4 genotype and parental family history of dementia due to AD. Macrovascular blood flow was assessed using phase contrast-vastly undersampled isotropic projection reconstruction (PC VIPR) imaging. PC VIPR is a novel 4D flow magnetic resonance imaging (MRI) technique that enables both volumetric angiographic and quantitative assessment of mean blood flow in macrovessels in a single acquisition.10,13,21,22 In turn, arterial spin labeling (ASL) perfusion MRI was used to assess cortical perfusion. We examined relationships between HOMA-IR, arterial blood flow, and their interaction on cortical perfusion. We postulated that higher HOMA-IR would be associated with lower arterial blood flow and that HOMA-IR and arterial blood flow would interact to predict lower cerebral perfusion in cortical brain regions known to be susceptible to early pathological changes in AD. Secondary analyses assessed the extent to which HOMA-IR was associated with lower arterial blood flow when present among a cluster of cardiovascular risk factors (i.e. metabolic syndrome).
Materials and methods
All procedures were approved by the Health Sciences Institutional Review Board of the University of Wisconsin—Madison and conformed to the standards set by the Declaration of Helsinki. All participants provided written informed consent prior to engaging in study procedures.
Participants
Participants were 120 cognitively asymptomatic middle-aged adults (mean age 57 ± 5.01 years, range = 45–66 years, 76% women) from the Wisconsin Alzheimer’s Disease Research Center, Investigating Memory in People At risk, Causes and Treatments (IMPACT) cohort (Table 1). Inclusion criteria required that participants had undergone fasting blood draw and MRI, including 4D flow MRI measurements from the basilar (BA) and bilateral internal carotid arteries (ICAs) and pseudo-continuous ASL (pcASL) perfusion MRI. pcASL scans were reviewed by a radiologist to rule out presence of significant flow-limiting stenosis. All participants were required to have normal cognitive function, as determined by comprehensive evaluation including the Uniform Data Set (UDS) neuropsychological test battery and consensus review (see Table 1), no current diagnosis of major psychiatric illness, and no history of neurological disease or head trauma. The IMPACT cohort is enriched for AD risk based on parental history of dementia due to AD defined as one or both biological parents meeting criteria for clinical diagnosis.23,24. Parental family history was determined by a validated interview reviewed by a multidisciplinary diagnostic consensus panel25 or postmortem neuropathological diagnosis of AD. Participants who reported at least one biological parent with a diagnosis of dementia due to AD were considered positive for parental family history of dementia due to AD. APOE ɛ4 genotyping was conducted to determine carriage of the ɛ4 allele (see “APOE ɛ4 genotyping” section), a genetic risk factor known to confer risk for dementia due to AD. Participants who harbored at least one copy of the ɛ4 allele were defined as APOE ɛ4 positive. Percent of participants with parental family history of dementia due to AD and percent of participants with APOE ɛ4 carriage are reported in Table 1.
Table 1.
Participant demographics, glucoregulatory, genetic, and cognitive data.
| Demographic, glucoregulatory, genetic and cognitive data |
|||
|---|---|---|---|
| Whole sample | Control group | MetSyn group | |
| Sex | 91 women, 29 men | 70 women, 20 men | 21 women, 9 men |
| Age (yrs) | 57 ± 5 | 56.4 ± 5.1 | 58.7 ± 4.5 |
| Education (yrs) | 16.5 ± 2.3 | 16.4 ± 2.4 | 16.9 ± 2.1 |
| Waist circumference (cm) | 91 ± 17 (women), 99 ± 12 (men) | 87 ± 15 (women), 95 ± 10 (men) | 105 ± 16 (women), 108 ± 13 (men) |
| Mean arterial pressure (mm Hg) | 91 ± 9 | 90 ± 8.8 | 93 ± 9.6 |
| Triglycerides (mg/dL) | 102 ± 54 | 90 ± 35.7 | 139 ± 77.3 |
| HDL (mg/dL) | 70 ± 20 (women), 50 ± 14 (men) | 73 ± 19 (women), 53 ± 13 (men) | 59 ± 19 (women), 45 ± 14 (men) |
| HOMA-IR (FG × FINSL) /405 | 2.85 ± 3.6 | 2 ± 1.3 | 5.4 ± 6.1 |
| Diabetes status | |||
| Normoglycemic (FG < 100 mg/dL) | 109 | 87 | 22 |
| Diabetes diagnosis | 11 | 3 | 8 |
| APOE ɛ4 genotype | |||
| APOE ɛ4 (hetero- or homozygous) | 51 (43%) | 37 (31%) | 14 (12%) |
| Parental family history AD | 94 (78%) | 72 (60%) | 22 (18%) |
| Cognitive function | |||
| MMSE | 29.44 ± 0.73 | 29.5 ± 0.75 | 29.4 ± 0.67 |
| Immediate memory RAVLT | 6.18 ± 1.64 | 6.20 ± 1.63 | 6.10 ± 1.73 |
| Delayed memory RAVLT | 10.33 ± 2.66 | 10.51 ± 2.56 | 10 ± 2.93 |
HDL: high-density lipoprotein; HOMA-IR: Homeostatic Model Assessment of Insulin Resistance; FG: fasting glucose; FINSL: fasting insulin; MMSE: Mini-Mental State Examination; RAVLT: Rey Auditory Verbal Learning Test.
Design and procedure
Cardiovascular risk factors
To assess IR, venipuncture was performed in the morning after a minimum 12 h fast. Blood samples were collected in 9 mL polypropylene tubes and left standing for 30 min to allow for clotting. Samples were centrifuged at 4℃ at 3000 r/min for 10 min. Cell-free plasma/serum was aliquoted into 1.5 mL micro centrifuge tubes and frozen at −80℃ until analyzed at the University of Wisconsin Hospital and Clinics Laboratory (Madison, WI). To assess fasting glucose and insulin, plasma was assayed using a hexokinase glucose method (Siemens Dimension Vista) and serum was assayed using a chemiluminescent immunoassay on an ADVIA Centaur XP Immunoassay System (Siemens Corporation, Washington, DC). IR was calculated from fasting insulin and fasting glucose using the HOMA-IR method calculated as HOMA-IR = (fasting glucose (mg/dL) × fasting insulin (uIU/mL)) / 405. A log transformation (log base 10) was performed on HOMA-IR scores to correct for a skewed distribution. Fasting blood was also analyzed using lipid panels to assess high-density lipoprotein (HDL) using accelerator selective detergent and triglycerides (TGs) were assessed using glycerol phosphate oxidase. Systolic and diastolic blood pressures were measured using an automated brachial sphygmomanometer. Mean arterial pressure (MAP) was estimated using systolic pressure (SP) and diastolic pressure (DP) at resting heart rate calculated as MAP ≅ DP + 1/3 (SP − DP).
APOE ɛ4 genotyping
APOE ɛ4 genotyping was performed using the fasting blood sample collected at baseline visit, using standard polymerase chain reaction (PCR) and deoxyribonucleic acid (DNA) sequencing techniques. DNA extracted from whole blood was genotyped with the use of homogenous Florescent Resonance Energy Transfer technology coupled to competitive allele specific PCR (LGC Genomics; Beverly, MA). The National Cell Repository for Alzheimer’s Disease (NCRAD) also performed genotyping. There was 100% concordance for APOE genotyping between these analyses.
Classification of metabolic syndrome
A secondary analysis was conducted to examine the association between IR and arterial blood flow in individuals with a clustering of cardiovascular risk factors known as metabolic syndrome. For these analyses, individuals were dichotomized as healthy control or metabolic syndrome group (i.e. metabolic syndrome (MetSyn)) using published criteria for clinical diagnosis of metabolic syndrome.26 Classification required that an individual meet at least three of five criteria: (1) central obesity defined by US criteria as waist circumference >40 in (102 cm) for men and >35 in (88 cm) for women; (2) elevated TG level: ≥150 mg/dL (1.7 mmol/L) or drug treatment for elevated TGs; (3) reduced HDL cholesterol (HDL-C): <40 mg/dL (1.03 mmol/L) in males and <50 mg/dL (1.29 mmol/L) in women or drug treatment for reduced HDL-C; (4) systolic blood pressure (BP): ≥130 mm Hg or diastolic BP ≥ 85 mm Hg or antihypertensive drug treatment, and/or; (5) elevated fasting plasma glucose (FPG): ≥100 mg/dL (5.6 mmol/L) or drug treatment for elevated glucose. Approximately 25% of the sample met metabolic syndrome diagnosis criteria.
Magnetic resonance imaging
Participants underwent scanning on a General Electric 3.0 Tesla Discovery MR750 MRI system with an 8-channel receive-only head coil (Excite HD Brain Coil, GE Healthcare). The body coil was used for radiofrequency (RF) excitation including spin labeling. To reduce interparticipant variability, participants abstained from food, caffeine, tobacco, and medication with vasomodulatory properties for a minimum of 4 h prior to scanning. T1-weighted imaging was acquired in the axial plane with a 3D fast spoiled gradient-echo sequence using the following parameters: inversion time (TI) = 450 ms; repetition time (TR) = 8.2 ms; echo time (TE) = 3.2 ms; flip angle = 12°; acquisition matrix = 256 × 256 mm, field of view (FOV) = 256 mm; slice thickness = 1.0 mm. T1-weighted images were used for pcASL processing and to calculate gray matter volume (GMV) to be used as a covariate in statistical analyses.
To assess cerebral perfusion, resting CBF assessments were made using a background-suppressed pcASL sequence,27 featuring a 3D fast spin-echo spiral sequence that utilizes a stack of variable-density 4 ms readout and eight interleaves. Scan parameters were TR = 4.9 ms; TE = 10.5 ms; FOV = 240 mm; slice thickness = 4 mm no gap; matrix size = 128 × 128; number of excitations (NEX) = 3; and labeling RF amplitude = 0.24 mG. Post-labeling delay was 2025 ms. A fluid-suppressed proton density (PD) scan was acquired with the same imaging sequence/image slab location as the pcASL but without RF labeling preparation for cerebral perfusion flow quantitation and image registration.
To assess arterial blood flow PC MRI data with three-directional velocity encoding were acquired with a 3D radially undersampled sequence (PC VIPR),21 with the following imaging parameters: velocity encoding (venc) = 80 cm/s, imaging volume = 22 × 22 × 10 cm3, acquired isotropic spatial resolution = (0.7 mm)3, TR/TE = 7.4/2.7 ms, flip angle α = 10°, bandwidth = ±83.3 kHz, 14,000 projection angles, scan time ∼ 7 min. The data were retrospective cardiac gated and reconstructed into 20 cardiac phases using temporal interpolation.28
MRI processing
The T1-weighted volume was segmented into tissue classes using the updated segmentation routine in SPM12 (http://www.fil.ion.ucl.ac.uk/spm/software/spm12/), which produces gray, white, and cerebrospinal fluid (CSF) probability maps. The segmentation procedure also produces a deformation field mapping the T1 image to Montreal Neurological Institute (MNI) standard space. GMV was derived for each participant from their gray matter probability map by summing all non-zero voxels which were then entered as a covariate in all analyses to control for interparticipant variability in GMV which was shown to correlate with arterial blood flow in the current sample (data not shown).
pcASL processing
The CBF images were processed using SPM12. Each participant’s PD image was co-localized to their T1-weighted image and the derived transformation matrix was applied to the CBF map. The coregistered CBF image was then spatially normalized to the MNI template with resampling to a 2 × 2 × 2 mm voxel size via the deformation field produced during the tissue segmentation. The normalized CBF maps were smoothed using an 8 mm full-width at half-maximum Gaussian kernel. Global nuisance effects were controlled for by including a global covariate in the general linear model (ANCOVA) as a nuisance effect. This approach is less conservative than proportional scaling as it does not restrict the model to a simple proportional regression thus allowing different relationships between local and global measurements to exist across participants.
Flow analysis
Four dimensional flow MRI data were used to generate PC angiograms to allow for segmentation of the arterial tree, performed in Matlab (The Mathworks, Natick, MA).29 Interactive flow visualization and selection of planes for quantitative analyses were conducted using EnSight (CEI, Apex, NC) software. Flow analysis planes of measurements were manually placed orthogonal to vessel orientation10 allowing for assessment of blood flow at a single segment at a single time point along a vessel. Blood flow (mL/min) was measured from and assessed in the following vessels: bilateral distal cervical ICA (inferior ICA), bilateral distal petrous ICA (superior ICA), and the BA, approximately 4–5 mm from the vertebrobasilar junction. Mean flow in inferior and superior segments of the ICA were calculated as an average (i.e. ICA flow = (inferior ICA flow + superior ICA flow)/2) for right and left sides separately. Arterial blood flow was calculated as the sum of bilateral ICAs and BA flow (i.e. right ICA flow + left ICA flow + BA flow).
Statistical analyses
To examine the effects of IR on arterial blood flow, as measured by HOMA-IR and PC VIPR, linear regression analyses were conducted in SPSS (IBM SPSS Statistics for Mac, Version 21.0. Armonk, NY: IBM Corp) with HOMA-IR defined as the predictor variable and arterial blood flow as the dependent variable. In all analyses, HOMA-IR was treated as a continuous variable. To allow us to examine unique effects of HOMA-IR on arterial blood flow, comorbid vascular risk factors including waist circumference, MAP, TG, HDL, and total cholesterol were included as covariates in all statistical models. Age and sex were included as covariates to account for interparticipant variance in arterial blood flow as a function of age and sex. APOE ɛ4 carriage and family history of dementia due to AD were added as covariates to control for invariable risk factors shown to be associated with lower CBF and cerebrovascular dysfunction.30,31 Within the study sample, higher GMV correlated with higher arterial blood flow (data not shown) and was thus added as a covariate in all analyses. Results for linear regression conducted in SPSS were considered significant at an alpha of p < 0.05.
Whole-brain multiple linear regression analyses were conducted in SPM12. To test the hypothesis that higher HOMA-IR is associated with lower cortical perfusion, a voxel-wise analysis was conducted to examine the relationship between HOMA-IR and perfusion as measured with pcASL. Subsequently, we tested for a moderating effect of IR on the relationship between arterial blood flow (measured with PC VIPR) and cortical perfusion (measured with pcASL) using a voxel-wise multiple regression implemented in SPM12. Covariates defined in SPM included age, sex, GMV, and comorbid vascular risk factors, specifically waist circumference, MAP, TG, HDL, and total cholesterol. APOE ɛ4 carriage and parental family history of dementia due to AD were also added as covariates in this model. Analyses were restricted to gray matter (GM) using an explicit mask made by thresholding the International Consortium for Brain Mapping Tissue Probabilistic Atlases GM map at 0.20. Voxel-wise analyses were considered significant at an alpha of p < 0.001, uncorrected. A cluster threshold of > 50 voxels was applied to the results to increase anatomic plausibility.
Results
HOMA-IR and arterial blood flow
Linear multiple regression analysis conducted to examine the relationship between HOMA-IR and arterial blood flow revealed a significant relationship between HOMA-IR where higher HOMA-IR was associated with lower arterial blood flow (F[1,107] = 6.15, p = 0.015). In contrast to HOMA-IR, comorbid vascular risk factors including waist circumference, MAP, TG, HDL, and total cholesterol were not significantly associated with arterial blood flow. Likewise, APOE ɛ4 status and family history of dementia due to AD were not significant predictors of arterial blood flow.
A follow-up analysis was conducted to determine whether the significant association observed between HOMA-IR and arterial blood flow was present uniformly or among specific vessels. To do this, a multiple regression analysis was conducted with HOMA-IR as the predictor variable and blood flow through the right ICA, left ICA and the BA defined as three dependent measures. Results revealed a significant relationship between HOMA-IR and blood flow in the right ICA (F[1,108] = 6.14, p = 0.015) and left ICA (F[1,108] = 9.76, p = 0.002) such that higher HOMA-IR was associated with lower ICA blood flow (Figure 1a and b). By contrast, HOMA-IR was not significantly associated with blood flow through the BA (F[1,108] = 0.317, p = 0.575 (NS)).
Figure 1.

Relationship between Homeostatic Model Assessment of Insulin Resistance (HOMA-IR) (log 10) and arterial blood flow (mL/min) through the right (a) and left (b) internal carotid arteries, as assessed by phase contrast-vastly undersampled isotropic projection reconstruction (PC VIPR).
HOMA-IR, arterial blood flow, and cerebral perfusion
Whole-brain voxel-wise analyses were conducted in SPM12 to test the hypothesis that greater HOMA-IR is associated with lower cortical perfusion, as indexed by pcASL. This analysis revealed a main effect of HOMA-IR on perfusion in several regions of the brain, specifically the left middle frontal gyrus, the right anterior cingulate, the right precentral gyrus, the right medial frontal gyrus, and the right temporal lobe (Table 2, Figure 2a–d). Investigation of the relationship between HOMA-IR and pcASL revealed that higher HOMA-IR was associated with lower cerebral perfusion in regions of significance (e.g. temporal lobe cluster (F[1,108] = 11.30, p = 0.001), see Figure 2e).
Table 2.
Regions that showed a significant main effect of HOMA-IR and an interaction of HOMA-IR and arterial blood flow on pcASL using voxel-wise analyses.
| Laterality | k | x | y | z | t | p value | |
|---|---|---|---|---|---|---|---|
| Main effect HOMA-IR (Figure 2a–d) | |||||||
| Middle frontal gyrus | L | 98 | −30 | 36 | 26 | 4.04 | 0.0001 |
| Anterior cingulate | R | 65 | 14 | 48 | 0 | 3.80 | 0.0001 |
| Precentral gyrus | R | 99 | 30 | −14 | 56 | 3.73 | 0.0001 |
| Medial frontal gyrus | R | 220 | 12 | 42 | −14 | 3.72 | 0.0001 |
| Temporal lobe | R | 64 | 44 | −4 | −32 | 3.46 | 0.0001 |
| ICA mean flow × HOMA-IR (Figure 3a) | |||||||
| Superior frontal gyrus | R | 92 | 14 | 60 | 30 | 3.71 | 0.0001 |
Voxel-wise clusters significant at p = 0.001 (uncorrected) with a cluster extent threshold of > 50. X, Y, and Z coordinates are presented in mm in Montreal Neurological Institute (MNI) space and statistics represent the peak voxel within each cluster. ICA: internal carotid arteries; R: right; L: left; k: number of contiguous voxels in cluster.
Figure 2.

Regions that showed a significant main effect of Homeostatic Model Assessment of Insulin Resistance (HOMA-IR) on pseudo-continuous arterial spin labeling (pcASL) perfusion. Higher HOMA-IR was associated with lower cerebral perfusion in the, (a) right medial frontal gyrus and anterior cingulate, (b) left middle frontal gyrus, (c) right precentral gyrus, and the (d) right temporal lobe. This relationship is illustrated by the plot of HOMA-IR (log 10) and pcASL values extracted from the right temporal lobe gyrus (e). Clusters are significant at p = 0.001 (uncorrected) with a voxel extent threshold of > 50.
A second whole-brain voxel-wise analysis was conducted to examine whether the concomitant presence of higher HOMA-IR and lower bilateral ICA blood flow has a detrimental effect on regional cerebral perfusion. This analysis revealed a significant interaction between HOMA-IR and bilateral ICA blood flow on cortical perfusion in the right superior frontal gyrus (Table 2, Figure 3a). Further investigation of this region revealed a significant association between HOMA-IR and bilateral ICA blood flow (F[1,106] = 13.70, p = 0.0001) such that higher bilateral ICA blood flow was associated with higher perfusion in the right superior frontal gyrus among individuals with lower but not higher HOMA-IR (Figure 3b). Voxel-wise results did not survive family-wise error (FWE) or false discovery rate (FDR) corrections.
Figure 3.
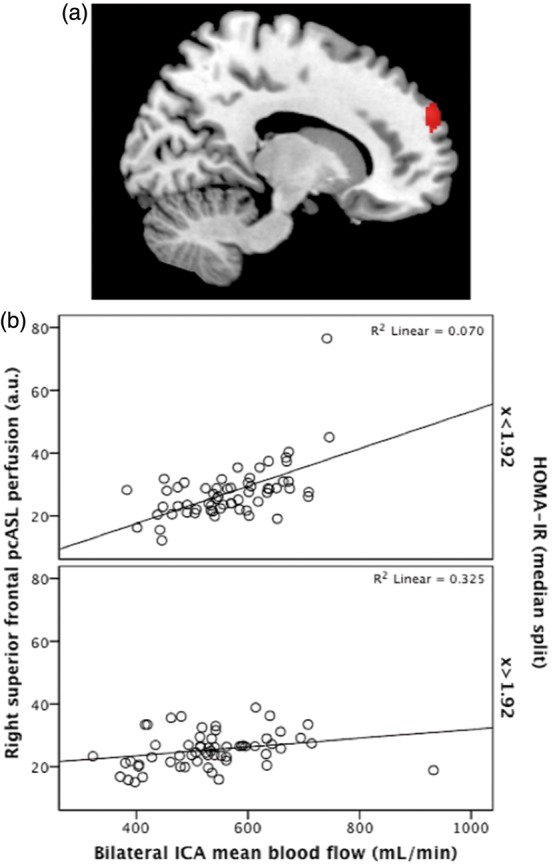
Significant interaction of Homeostatic Model Assessment of Insulin Resistance (HOMA-IR) and mean blood flow through bilateral internal carotid arteries (ICAs) on pseudo-continuous arterial spin labeling (pcASL) perfusion. A significant cluster was observed in the right superior frontal gyrus (a) where higher mean blood flow was associated with greater perfusion in individuals with lower but not higher HOMA-IR (b). Clusters are significant at p = 0.001 (uncorrected) with a voxel extent threshold of > 50. HOMA-IR is presented here as a median split for graphing purposes only.
Control versus MetSyn group
Thirty participants met criteria for the MetSyn group, while 90 individuals did not meet criteria and were deemed control (see Table 1 for descriptive statistics). To examine whether individuals who met criteria for clinical diagnosis of metabolic syndrome were significantly different on health measures from those deemed as controls, an analysis of covariance was conducted between Control and MetSyn groups. Sex, education, APOE ɛ4 status, and history of dementia due to AD were treated as covariates. Analyses revealed that compared to controls, the MetSyn group was older (F[1,114] = 5.29, p = 0.023). As expected, the MetSyn group also showed significantly greater waist circumference (F[1,114] = 37.31, p = 0.0001), significantly higher TGs (F[1,114] = 22.63, p = 0.0001), and significantly lower HDL (F[1,114] = 9.23, p = 0.003). Furthermore, the MetSyn group had significantly higher fasting glucose (F[1,114] = 19.03, p = 0.0001) and fasting insulin levels (F[1,114] = 32.07, p = 0.0001) compared to controls which yielded in greater HOMA-IR (F[1,114] = 26.16, p = 0.0001). Total cholesterol, MAP, and arterial blood flow did not significantly differ between groups (see Table 3).
Table 3.
Control and MetSyn Groups—comparison across criteria for clinical diagnosis of metabolic syndrome, arterial blood flow, and gray matter volume.
| Control group | MetSyn group | |||
|---|---|---|---|---|
| Measure | M (SD) | M (SD) | Statistic | p value |
| Age (yrs) | 56 (5) | 59 (5) | F(1,114) = 5.3 | 0.023* |
| Waist circumference (cm) | 89 (14) | 106 (15) | F(1,114) = 37.31 | 0.0001** |
| MAP (mm Hg) | 90 (9) | 93 (10) | F(1,114) = 2.95 | 0.089 |
| Triglycerides | 91 (36) | 139 (77) | F(1,114) = 22.63 | 0.0001** |
| HDL | 68 (20) | 55 (19) | F(1,114) = 9.23 | 0.003* |
| Total cholesterol | 203 (34) | 188 (39) | F(1,114) = 3.11 | 0.080 |
| Fasting glucose (mg/dL) | 90 (10) | 116 (54) | F(1,114) = 19.03 | 0.0001** |
| Fasting insulin (uIU/mL) | 9 (6) | 17 (9) | F(1,114) = 32.07 | 0.0001** |
| HOMA-IR | 2 (1.3) | 5.4 (6) | F(1,114) = 6.16 | 0.0001** |
| Arterial BF (mL/min) | 718 (117.9) | 698 (150.8) | F(1,114) = 0.906 | 0.343 |
| Gray matter volume (mL) | 685 (61.8) | 707 (62.9) | F(1,114) = 1.82 | 0.179 |
MetSyn: metabolic syndrome; MAP: mean arterial pressure; HDL: high-density lipoprotein; HOMA-IR: Homeostatic Model Assessment of Insulin Resistance; BF: blood flow; M: Mean; SD: standard deviation.
Significant at p < 0.05.
Significant at p < 0.001.
Differences in arterial blood flow between control and MetSyn, as well as differences in the relationships between HOMA-IR and arterial blood flow, were examined in SPSS. The statistical model tested main effects of HOMA-IR and MetSyn, as well as an interaction between HOMA-IR × MetSyn, on arterial blood flow. Covariates included age, sex, waist circumference, MAP, TG, HDL, total cholesterol, and GMV. Arterial blood flow was not significantly different between MetSyn and control groups and there was no significant HOMA-IR × MetSyn group interaction. While the interaction was not significant, follow-up analyses conducted within each group showed that HOMA-IR was associated with arterial blood flow within the MetSyn group, with higher HOMA-IR predicting lower arterial blood flow (F[1,30] = 6.09, p = 0.023). This association between HOMA-IR and arterial blood flow was not observed within the control group (Figure 4a and b).
Figure 4.

Relationship between Homeostatic Model Assessment of Insulin Resistance (HOMA-IR) and arterial blood flow (phase contrast-vastly undersampled isotropic projection reconstruction (PC VIPR)) in control (a) and metabolic syndrome (MetSyn) (b) groups.
Discussion
DM and metabolic syndrome are associated with a host of vascular impairments across the lifespan; however, the relationship between IR and cerebrovascular health prior to the onset of DM with respect to macrovascular blood flow and microvessel cerebral perfusion is incompletely known. Thus, we sought to determine the relationship between IR, arterial blood flow, and cerebral perfusion in a cognitively asymptomatic middle-aged sample. Secondarily, we investigated associations between HOMA-IR and macro- and microvascular blood flow in the context of a cluster of metabolic disease risk factors to determine the relationship between IR and cerebrovascular health in middle-aged individuals who met clinical diagnosis criteria for metabolic syndrome. Findings indicated that higher HOMA-IR was associated with lower arterial blood flow, specifically in bilateral ICAs. Furthermore, findings revealed that higher HOMA-IR was associated with lower cortical perfusion in middle and medial frontal gyri, anterior cingulate, precentral gyrus, and the temporal lobe. In the context of dementia, both frontal and temporal regions are known to be vulnerable to AD pathology. While the mechanism under study is primarily vascular, it is possible that these regions are particularly vulnerable to neural injury due to accompanying pathological processes. While this is pure speculation, prior studies provide support for this notion showing that vascular risk and biomarkers associated with AD pathology (i.e. Aβ) interact to reduce cortical thickness in brain regions vulnerable to AD.32 Of note, our results suggest that IR may have a deleterious effect on CBF compared to other vascular risk factors and that this process may occur as early as midlife prior to the development of metabolic disease or cognitive impairment. Follow-up studies are needed to determine if the current findings generalize to a broader sample. Furthermore, interactions between IR and other pathological processes that may occur concomitantly with vascular disease in midlife should be considered.
Additionally, higher blood flow in bilateral ICAs was associated with higher cortical perfusion in the right superior frontal gyrus only among individuals who had lower HOMA-IR. Taken together, the findings suggest that IR may have an effect on both macrovessels and microvessels, and perhaps more intriguingly, suggest that IR may contribute to an uncoupling of arterial blood flow from regional cortical microperfusion. This uncoupling provides novel evidence that a mismatch of blood flow supply and demand may occur in discrete brain regions among individuals with elevated IR. Further research is needed to examine the relationship between IR and macro- and microvascular blood flow while considering other risk factors for cerebrovascular disease.
Vulnerability to dementia as a result of vascular disease may occur through a variety of mechanisms including atherosclerosis,14 vessel stiffening and increased pulsatility,10 as well as endothelial dysfunction. Reduced cerebral perfusion which is associated with decreased cerebral oxygen supply results in an unfavorable metabolic environment that increases reactive oxygen species (ROS) production and is associated with increased amyloid accumulation, all factors linked with neurodegeneration and conferred risk for cognitive changes, including dementia due to AD.33–36 While the underlying mechanisms for IR-related decreased cerebral perfusion are unknown, studies conducted in obese rats provide evidence that excessive generation of ROS and uncoupling of the enzyme nitric oxide synthase attenuates bioavailability of nitric oxide (NO) and vasodilation in response to insulin levels.37 A decrease in NO bioavailability in obesity and IR has also been attributed to decreased activity of the phosphatidylinositol 3-kinase (PI3K) pathway38 and increases in caveolin-1,39 thereby potentially increasing risk for vascular disease through disruption of mechanisms involved in normal arterial function. The present data forms the basis for future mechanistic studies in humans aimed at identifying mechanisms of vascular dysfunction in IR that mediates cerebral perfusion. Furthermore, examination of the relationship among IR, arterial blood flow, and cerebral perfusion with respect to cerebrovascular risk factors such as macrovascular events, arterial stiffness, and microvascular disease is critically important for developing our current understanding of the role of IR in vascular disease and brain health.
While 4D flow MRI is a recent technological development, investigators from our group have shown that flow deficits are observed among individuals with attenuated cognitive function,10 including patients with mild cognitive impairment (MCI) and AD. Conversely, all participants enrolled in the current study were cognitively asymptomatic, suggesting that alterations to macrovascular blood flow and cortical perfusion may precede overt decrements in cognitive function. Thus, a major strength of the current study design is the ability to identify cerebrovascular dysfunction in the absence of cognitive impairment. Taken together, the data justify the importance for longitudinal studies to examine the effect of IR mediated CBF changes on cognitive trajectories.
While our group and others have previously found that metabolic syndrome is associated with lower cortical perfusion6,40,41 less is known about macrovascular blood flow differences. While the current study did not find differences in arterial blood flow between MetSyn and control groups, we observed that higher HOMA-IR was associated with lower macrovascular blood flow in the MetSyn group, a relationship not observed among healthy adults. It is important to note, however, that neither the group comparison nor the interaction was statistically significant and this finding should be interpreted with caution. Furthermore, the MetSyn comparison was limited by an uneven distribution of individuals across MetSyn and control groups, as well as limitations in identifying participants completely free of all vascular risk factors. Even among the control group, many participants harbored at least one or two vascular risk factors, a common finding among participants in this age range. Further research is needed to better understand the effects of metabolic syndrome on brain health in midlife.
A few additional limitations deserve note. Our sample comprised participants with a variety of vascular risk factors. While significant results centered on IR while controlling for other vascular risk factors, it is well known that vascular risk factors often occur in concert. Thus, we cannot rule out that given a larger group or a more even distribution across groups MetSyn and control groups that metabolic syndrome would have had an effect on arterial blood flow. Research has shown that lower blood flow velocities are commonly observed in patients with type 2 diabetes, particularly among those with comorbid cardiovascular risk factors.42 While it is known that DM is associated with reduced blood flow, the relationship between blood flow velocities in individuals with higher IR who have not yet converted to a clinical disease state (i.e. DM) is currently unknown. Investigation and identification of risk factors prior to disease onset is critical as risk factors at this stage are likely modifiable making them primary targets for intervention. Furthermore, it is not well known if higher IR in the presence of other cardiovascular risk factors impairs cerebrovascular blood flow with respect to macro- and/or microvessels in cognitively asymptomatic individuals in midlife. The current study sought to investigate the relationship between cardiovascular risk factors, particularly high IR prior to onset of clinical diagnosis of DM, and cerebrovascular health in middle-aged individuals. While it is expected that DM patients in the sample will show decreased CBF overall, DM patients constituted less than 10% of the overall study sample. Eight of the 11 DM patients did, however, meet criteria for metabolic syndrome, thus CBF differences reported between healthy controls and MetSyn groups should be interpreted with caution. It is also important to note that many participants in this study harbored invariable risk factors for AD, including parental family history of dementia due to AD and/or carriage of one or two APOE ɛ4 alleles. While we did not find an effect of APOE ɛ4 on arterial blood flow or cerebral perfusion, we cannot exclude the possibility that the findings may not generalize to a non-enriched population. Furthermore, our sample was largely composed of women, thus findings may have limited generalizability and warrant further investigation in a broader sample.
Overall, our findings suggest that among metabolic and cardiovascular risk factors, IR is a potential predictor of lower arterial blood flow and lower cerebral perfusion in cognitively asymptomatic middle-aged adults. Specifically, as HOMA-IR increased, decreased macrovascular blood flow, as well as regional microvascular perfusion, were observed. Furthermore, we observed a significant interaction between IR and macrovascular blood flow on cortical perfusion, providing evidence for an uncoupling of macro- and microvascular flow among individuals with higher IR. As the prevalence of metabolic and cardiovascular disease continues to dramatically rise in the US, and given IR-induced hypoperfusion occurs as early as midlife and likely younger,43,44 it is of critical importance to examine and identify modifiable risk factors for early interventions in an effort to promote healthy brain aging and potentially thwart early pathological changes associated with IR.
Acknowledgements
We wish to thank the MRI staff at the Wisconsin Institute for Medical Research, support staff at the Wisconsin Alzheimer’s Disease Research Center, Deborah A Hoscheidt for her medical expertise, and above all, our dedicated participants.
Declaration of conflicting interests
The author(s) declared the following potential conflicts of interest with respect to the research, authorship, and/or publication of this article: OW reports research agreement with GE HealthCare. HR reports that he is a consultant for GE HealthCare. All remaining authors declare no conflict of interest.
Authors’ contributions
All authors made the following significant contributions to the current manuscript: SMH—substantial contributions to conception and design, data acquisition, analysis and interpretation, drafted manuscript and contributed significant revisions, and approved final version submitted for publication; JMK—substantial contributions to conception and design, data analysis and interpretation of data, drafted manuscript and contributed significant revisions, and approved final version submitted for publication; SEB—substantial contributions to interpretation of data, revisions to manuscript, and approval of final version for publication; LAR—substantial contributions to interpretation of data, revisions to manuscript, and approval of final version submitted for publication; RAK—substantial contributions to acquisition and analysis of data, revisions to manuscript, and approval of final version submitted for publication; JMO—substantial contributions to acquisition and analysis of data, revisions to manuscript, and approval of final version submitted for publication; MSB—substantial contributions to interpretation of data, revisions to manuscript, and approval of final version submitted for publication; CMC—substantial contributions to interpretation of data, revisions to manuscript, and approval of final version submitted for publication; SA—substantial contributions to conception and design, revisions, and approved final version submitted for publication; HAR—substantial contributions to interpretation of data, revisions to manuscript, and approval of final version submitted for publication; OW—substantial contributions to interpretation of data, revisions to manuscript, and approval of final version submitted for publication; SCJ—substantial contributions to interpretation of data, revisions to manuscript, and approval of final version submitted for publication; WGS—substantial contributions to conception and design, data analysis and interpretation of data, revisions, and approved final version submitted for publication; BBB—substantial contributions to conception and design, data analysis and interpretation of data, revisions, and approved final version submitted for publication.
Authors’ note
Research materials may be accessed through contacting Dr Barbara Bendlin at bbb@medicine.wisc.edu.
Funding
The author(s) disclosed receipt of the following financial support for the research, authorship, and/or publication of this article: NIH grant P50 AG033514, as well as funding from a National Center for Research Resources/National Institutes of Health Clinical and Translational Science Award, 1UL1RR025011, a program of the National Center for Research Resources, United States National Institutes of Health, NIH T32 GM008692 (SEB) and the Training, Education, and Mentoring in Science (TEAM) Fellowship grant R25GM083252 (LRR), and the American Heart Association AHA-15POST23100020 (JMK).
References
- 1.DeCarli C, Miller BL, Swan GE, et al. Predictors of brain morphology for the men of NHLBI twin study. Stroke 1999; 30: 529–536. [DOI] [PubMed] [Google Scholar]
- 2.Raz N, Lindenberger U, Rodrigue KM, et al. Regional brain changes in aging healthy adults: general trends, individual differences and modifiers. Cereb Cortex 2005; 15: 1676–1689. [DOI] [PubMed] [Google Scholar]
- 3.Raz N, Rodrigue KM, Kennedy KM, et al. Vascular health and longitudinal changes in brain and cognition in middle-aged and older adults. Neuropsychology 2007; 21: 149–157. [DOI] [PubMed] [Google Scholar]
- 4.Biagi L, Abbruzzese A, Bianchi MC, et al. Age dependence of cerebral perfusion assessed by magnetic resonance continuous arterial spin labeling. J Magn Reson Imaging 2007; 25: 696–702. [DOI] [PubMed] [Google Scholar]
- 5.Zarrinkoob L, Ambarki K, Wahlin A, et al. J. Blood flow distribution in cerebral arteries. J Cereb Blood Flow Metab 2015; 35: 648–654. [DOI] [PMC free article] [PubMed] [Google Scholar]
- 6.Birdsill AC, Carlsson CM, Willette AA, et al. Low cerebral blood flow is associated with lower memory function in metabolic syndrome. Obesity 2013; 21: 1313–1320. [DOI] [PMC free article] [PubMed] [Google Scholar]
- 7.Launer LJ, Lewis CE, Schreiner PJ, et al. Vascular factors and multiple measures of early brain health: CARDIA brain MRI study. PLoS One 2015; 10: e0122138. [DOI] [PMC free article] [PubMed] [Google Scholar]
- 8.Birdsill AC, Koscik RL, Jonaitis EM, et al. Regional white matter hyperintensities: aging, Alzheimer’s disease risk, and cognitive function. Neurobiol Aging 2014; 35: 769–776. [DOI] [PMC free article] [PubMed] [Google Scholar]
- 9.Okonkwo OC, Xu G, Oh JM, et al. Cerebral blood flow is diminished in asymptomatic middle-aged adults with maternal history of Alzheimer’s disease. Cereb Cortex 2014; 24: 978–988. [DOI] [PMC free article] [PubMed] [Google Scholar]
- 10.Rivera-Rivera LA, Turski P, Johnson KM, et al. 4D flow MRI for intracranial hemodynamics assessment in Alzheimer’s disease. J Cereb Blood Flow Metab. Epub ahead of print 25 November 2015. DOI: 10.1177/0271678X15617171. [DOI] [PMC free article] [PubMed] [Google Scholar]
- 11.Wang Z, Das SR, Xie SX, et al. Arterial spin labeled MRI in prodromal Alzheimer’s disease: a multi-site study. Neuroimage Clin 2013; 2: 630–636. [DOI] [PMC free article] [PubMed] [Google Scholar]
- 12.Hughes TM, Craft S. The role of insulin in the vascular contributions to age-related dementia. Biochim Biophys Acta 2016; 1862: 983–991. [DOI] [PubMed] [Google Scholar]
- 13.Berman SE, Rivera-Rivera LA, Clark LR, et al. Intracranial arterial 4D-flow is associated with metrics of brain health and Alzheimer’s disease. Alzheimers Dement 2015; 1: 420–428. [DOI] [PMC free article] [PubMed] [Google Scholar]
- 14.Roher AE, Tyas SL, Maarouf CL, et al. Intracranial atherosclerosis as a contributing factor to Alzheimer’s disease dementia. Alzheimers Dement 2011; 7: 436–444. [DOI] [PMC free article] [PubMed] [Google Scholar]
- 15.Crane PK, Walker R, Hubbard RA, et al. Glucose levels and risk of dementia. N Engl J Med 2013; 369: 540–548. [DOI] [PMC free article] [PubMed] [Google Scholar]
- 16.Ronnemaa E, Zethelius B, Lannfelt L, et al. Vascular risk factors and dementia: 40-year follow-up of a population-based cohort. Dement Geriatr Cogn Disord 2011; 31: 460–466. [DOI] [PubMed] [Google Scholar]
- 17.Willette AA, Xu G, Johnson SC, et al. Insulin resistance, brain atrophy, and cognitive performance in late middle-aged adults. Diabetes Care 2013; 36: 443–449. [DOI] [PMC free article] [PubMed] [Google Scholar]
- 18.Willette AA, Johnson SC, Birdsill AC, et al. Insulin resistance predicts brain amyloid deposition in late middle-aged adults. Alzheimers Dement 2015; 11: 504–510 e1. [DOI] [PMC free article] [PubMed] [Google Scholar]
- 19.Kivipelto M, Ngandu T, Fratiglioni L, et al. Obesity and vascular risk factors at midlife and the risk of demnetia and Alzheimer disease. Arch Neurol 2005; 62: 1556–1560. [DOI] [PubMed] [Google Scholar]
- 20.Viticchi G, Falsetti L, Buratti L, et al. Metabolic syndrome and cerebrovascular impairment in Alzheimer’s disease. Int J Geriatr Psychiatry 2015; 30: 1164–1170. [DOI] [PubMed] [Google Scholar]
- 21.Gu T, Korosec FR, Block WF, et al. PC VIPR: a high-speed 3D phase-contrast method for flow quantification and high-resolution angiography. AJNR Am J Neuroradiol 2005; 26: 743–749. [PMC free article] [PubMed] [Google Scholar]
- 22.Johnson KM, Lum DP, Turski PA, et al. Improved 3D phase contrast MRI with off-resonance corrected dual echo VIPR. Magn Reson Med 2008; 60: 1329–1336. [DOI] [PMC free article] [PubMed] [Google Scholar]
- 23.McKhann GM, Drachman D, Folstein M, et al. Clinical diagnosis of Alzheimer’s disease: report of the NINCDS-ADRDA Work Group* under the auspices of Department of Health and Human Services Task Force on Alzheimer’s Disease. Neurology 1984; 34: 939–944. [DOI] [PubMed] [Google Scholar]
- 24.McKhann GM, Knopman DS, Chertkow H, et al. The diagnosis of dementia due to Alzheimer’s disease: recommendations from the National Institute on Aging-Alzheimer’s Association workgroups on diagnostic guidelines for Alzheimer’s disease. Alzheimers Dement 2011; 7: 263–269. [DOI] [PMC free article] [PubMed] [Google Scholar]
- 25.Kawas CH, Segal J, Stewart WF, et al. A validation study of the dementia questionnaire. Arch Neurol 1994; 51: 901–906. [DOI] [PubMed] [Google Scholar]
- 26.Circulation. Harmonizing the metabolic syndrome: a joint interim statement of the International Diabetes Federation Task Force on Epidemiology and Prevention; Heart, Lung, and Blood Institute; American Heart Association; World Heart Federation; Int. Atherosclerosis Society; and Int. Association for the Study of Obesity, 2009. [DOI] [PubMed]
- 27.Xu G, Rowley HA, Wu G, et al. Reliability and precision of pseudo-continuous arterial spin labeling perfusion MRI on 3.0 T and comparison with 15O-water PET in elderly subjects at risk for Alzheimer’s disease. NMR Biomed 2010; 23: 286–293. [DOI] [PMC free article] [PubMed] [Google Scholar]
- 28.Liu J, Redmond MJ, Brodsky EK, et al. Generation and visualization of four-dimensional MR angiography data using an undersampled 3-D projection trajectory. IEEE Trans Med Imaging 2006; 25: 148–157. [DOI] [PubMed] [Google Scholar]
- 29.Stalder AF, Russe MF, Frydrychowicz A, et al. Quantitative 2D and 3D phase contrast MRI: optimized analysis of blood flow and vessel wall parameters. Magn Reson Med 2008; 60: 1218–1231. [DOI] [PubMed] [Google Scholar]
- 30.Okonkwo OC, Xu G, Oh JM, et al. Cerebral blood flow is diminished in asymptomatic middle-aged adults with maternal history of Alzheimer’s disease. Cereb Cortex 2014; 24: 978–988. [DOI] [PMC free article] [PubMed] [Google Scholar]
- 31.Tai LM, Thomas R, Marottoli FM, et al. The role of APOE in cerebrovascular dysfunction. Acta Neuropathol 2016; 131: 709–723. [DOI] [PMC free article] [PubMed] [Google Scholar]
- 32.Fletcher E, Villeneuve S, Maillard P, et al. Beta-amyloid, hippocampal atrophy and their relation to longitudinal brain change in cognitively normal individuals. Neurobiol Aging 2016; 40: 173–180. [DOI] [PMC free article] [PubMed] [Google Scholar]
- 33.de la Torre JC. Vascular basis of Alzheimer’s pathogenesis. Ann N Y Acad Sci 2002; 977: 196–215. [DOI] [PubMed] [Google Scholar]
- 34.de la Torre JC. Cardiovascular risk factors promote brain hypoperfusion leading to cognitive decline and dementia. Cardiovasc Psychiatry Neurol 2012; 2012: 367516. [DOI] [PMC free article] [PubMed] [Google Scholar]
- 35.Toda N, Okamura T. Cerebral blood flow regulation by nitric oxide in Alzheimer’s disease. J Alzheimers Dis 2012; 32: 569–578. [DOI] [PubMed] [Google Scholar]
- 36.Toda N, Ayajiki K, Okamura T. Obesity-induced cerebral hypoperfusion derived from endothelial dysfunction: one of the risk factors for Alzheimer’s disease. Curr Alzheimer Res 2014; 11: 733–744. [DOI] [PubMed] [Google Scholar]
- 37.Katakam PV, Snipes JA, Steed MM, et al. Insulin-induced generation of reactive oxygen species and uncoupling of nitric oxide synthase underlie the cerebrovascular insulin resistance in obese rats. J Cereb Blood Flow Metab 2012; 32: 792–804. [DOI] [PMC free article] [PubMed] [Google Scholar]
- 38.Contreras C, Sanchez A, Garcia-Sacristan A, et al. Preserved insulin vasorelaxation and up-regulation of the Akt/eNOS pathway in coronary arteries from insulin resistant obese Zucker rats. Atherosclerosis 2011; 217: 331–339. [DOI] [PubMed] [Google Scholar]
- 39.Grayson TH, Chadha PS, Bertrand PP, et al. Increased caveolae density and caveolin-1 expression accompany impaired NO-mediated vasorelaxation in diet-induced obesity. Histochem Cell Biol 2013; 139: 309–321. [DOI] [PubMed] [Google Scholar]
- 40.Jennings JR, Heim AF, Kuan DC, et al. Use of total cerebral blood flow as an imaging biomarker of known cardiovascular risks. Stroke 2013; 44: 2480–2485. [DOI] [PMC free article] [PubMed] [Google Scholar]
- 41.Rusinek H, Ha J, Yau PL, et al. Cerebral perfusion in insulin resistance and type 2 diabetes. J Cereb Blood Flow Metab 2015; 35: 95–102. [DOI] [PMC free article] [PubMed] [Google Scholar]
- 42.Chytilová E, Malík J, Kasalová Z, et al. Lower wall shear rate of the common carotid artery in treated type 2 diabetes mellitus with metabolic syndrome. Physiol Res 2009; 58: 185–191. [DOI] [PubMed] [Google Scholar]
- 43.Harrell JW, Morgan BJ, Schrage WG. Impaired hypoxic cerebral vasodilation in younger adults with metabolic syndrome. Diab Vasc Dis Res 2013; 10: 135–142. [DOI] [PMC free article] [PubMed] [Google Scholar]
- 44.Harrell JW, Schrage WG. Cyclooxygenase-derived vasoconstriction restrains hypoxia-mediated cerebral vasodilation in young adults with metabolic syndrome. Am J Physiol Heart Circ Physiol 2014; 306: H261–H269. [DOI] [PMC free article] [PubMed] [Google Scholar]