Abstract
The alleviation of hypoxia in glioblastoma with carbogen to improve treatment has met with limited success. Our hypothesis is that the eventual benefits of carbogen depend on the capacity for vasodilation. We examined, with MRI, changes in fractional cerebral blood volume, blood oxygen saturation, and blood oxygenation level dependent signals in response to carbogen. The analyses were performed in two xenograft models of glioma (U87 and U251) recognized to have different vascular patterns. Carbogen increased fractional cerebral blood volume, blood oxygen saturation, and blood oxygenation level dependent signals in contralateral tissues. In the tumor core and peritumoral regions, changes were dependent on the capacity to vasodilate rather than on resting fractional cerebral blood volume. In the highly vascularised U87 tumor, carbogen induced a greater increase in fractional cerebral blood volume and blood oxygen saturation in comparison to the less vascularized U251 tumor. The blood oxygenation level dependent signal revealed a delayed response in U251 tumors relative to the contralateral tissue. Additionally, we highlight the considerable heterogeneity of fractional cerebral blood volume, blood oxygen saturation, and blood oxygenation level dependent within U251 tumor in which multiple compartments co-exist (tumor core, rim and peritumoral regions). Finally, our study underlines the complexity of the flow/metabolism interactions in different models of glioblastoma. These irregularities should be taken into account in order to palliate intratumoral hypoxia in clinical trials.
Keywords: Dynamic blood oxygenation level dependent, fractional cerebral blood volume, tissue oxygen saturation, glioma, hypoxia
Introduction
Hypoxia is a cardinal feature of glioblastoma (GB) in comparison to lower grades of gliomas.1 By promoting tumor growth and resistance to conventional treatments, based on X-ray radiation and temozolomide administrations,2–4 hypoxia has been shown to be an independent factor for poor prognosis in GB.5,6 Over the past two decades, various strategies have been developed to alleviate tumor hypoxia: (i) by inhibiting oxygen consumption in tumor cells; or (ii) by increasing oxygen supply to the tumor. For instance, through the use of arsenic trioxide as an inhibitor of mitochondrial respiration, Diepart et al.7 were able to restore oxygen tension in a tumoral tissue located in a murine limb and hence to radiosensitize tumor cells. To achieve an increase in oxygen supply, carbogen (a gas mixture composed of 95% O2 and 5% CO2) has been proposed as a vasoactive agent which can induce both a vasodilation (hypercapnia) with subsequent increase in blood flow and an increase in arterial oxygenation (hyperoxia) with a resulting increase in tissue oxygenation. This approach has been proposed for various tumor locations in preclinical settings as well as in patients alone or in combination with nicotinamide (as a prevention for acute hypoxia) to further potentiate radiotherapy efficacy8–10 (see Kaanders et al.11 for review).
The overall results of these studies were that carbogen could potentiate treatment. Nonetheless, this beneficial effect depends on the tumor type. Indeed, for glioma patients, the overall survival was not improved by carbogen inhalation as initially predicted on the basis of animal studies.12 Indeed, in preclinical investigations, it has been reported that carbogen breathing can not only reoxygenate the tumor but also potentiate radiotherapy in the F98 model of GB.13 Based on the use of electron paramagnetic oximetry (EPR), a tumor-specific response to carbogen has been published.14 A relative minor increase in oxygenation in the orthotopic C6 model was observed while, in the more vascularized 9L model, greater changes in tumoral pO2 were noted following carbogen inhalation.14 These results suggest that the response to carbogen could be dependent on various parameters, including the quantity of blood initially present under baseline conditions,15 as well as resting state of oxygenation, before any reoxygenation strategy is initiated. These points may be critical for GB patients since it is well known that the vasculature of the tumor is highly disorganized.16
Based on the above, the ability of GB to respond to carbogen needs further characterization both within the diseased and the healthy brain, a study that remains difficult with EPR oximetry since the measurements require oxygen-sensitive paramagnetic probes.
Here, we aimed to characterize, by multiparametric MRI, the effect of carbogen inhalation, in two GB models, differing in vasculature and oxygen status. Briefly, the U87 model has been shown to exhibit more dense and homogeneous vasculature without apparent hypoxia as determined by an absence of uptake of [18F]-FMISO.17 For these two tumor models, we measured, with multiparametric MRI, the cerebral blood volume (fCBV), oxygen saturation (SMRIO2), and also the cerebrovascular response to a hypercapnic/hyperoxic challenge. These approaches have been chosen to optimize biomarkers for the vascular physiology and oxygen use throughout the entire brain.18,19
Methods
Ethical approval and animal issues
A total of 31nude (detailed in each subsection), athymic rats (Crl:NIH-Foxn1rnu) were used in the present investigation. The animals were obtained from an in-house breeding stock at the Centre Universitaire de Ressources Biologiques(CURB, A14118015). The male rats (250–300 g, three to four months) were maintained in specific pathogen free housing and were fed γ-irradiated laboratory food and water ad libitum. At the end of MRI experimentations, the animal was euthanized. The animal investigations were performed under the current European directive (2010/63/EU) as incorporated in national legislation and in authorized laboratories (B14118001). Ethical approval was sought and obtained by the principal investigator (SV, personal authorization: 14–55) from the French Ministère de l’éducation nationale, de l’enseignement supérieur et de la recherche (study authorization: 00918.01). Data are reported according to ARRIVE guidelines.20
Cell line inoculation
U87-MG (ATCC) and U251 (NCI) human glioma cells were stereotactically injected into the caudatoputamen of rats.17 Briefly, animals were anesthetized with 5% isoflurane for induction and 2% for maintenance in N2O/O2 = 70/30%. Body temperature was monitored and maintained around 37.5℃. Rats were placed in a stereotactic head holder and a scalp incision was performed along the sagittal suture. A 1 mm diameter burr hole was drilled in the skull. U87 and U251 cells (5 × 10⁴ cells in 3 μl PBS-glutamine 2 mM) were injected over 6 min via a fine needle (30G) connected to a Hamilton syringe. The injection site was the right caudatoputamen with stereotactic coordinates: AP = 0, L = 3 and D = 6 mm, Paxinos and Watson (2007).21 The needle was then slowly removed and the craniotomy sealed.
MRI examinations and carbogen challenge
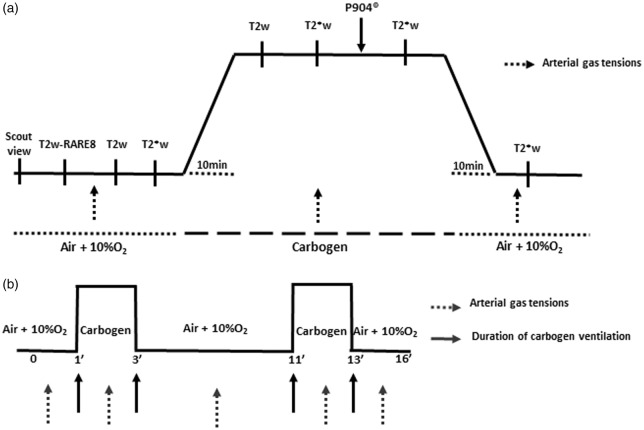
The rats were anesthetized (isoflurane 2% in oxygen-enhanced air fraction of inspired O2, FiO2 = 30%) to counteract the technical constraints of the respiratory system in MRI laboratory. Femoral arterial and venous catheters were placed and rats were mechanically ventilated (MRI-1 Ventilator, BioSeb Instruments®) to achieve stable and reproducible arterial gas tensions; paO2 = 113 ± 28.0 mmHg, paCO2 = 39.2 ± 8.0 mmHg (n = 17). All MRI experiments were conducted within a horizontal magnet operating at 7 T (Pharmascan, Bruker, CYCERON platform). Images were performed using a cross coils configuration with two decoupled volume coils for excitation and a surface coil for reception. Two protocols for imaging were employed (Figure 1).
Figure 1.
MRI study protocols. Each rat underwent T2w-RARE8 images. (a) For each situation, high resolution T2*w and T2w images were acquired (at five and four echo times, respectively). The fCBV and SMRIO2 maps were calculated for two experimental conditions (ventilation with oxygen-enriched air or carbogen) after one injection of P904® of (200 µmol.kg−1, 20 min after the induction of ventilation with carbogen, solid black arrow). The arterial gas analyses at the beginning, during, and at the end of the ventilation with carbogen (dashed arrows). (b) Vasoreactivity was tested by continuous recording of T2*w over 16 min under Domitor®. Two consecutive tests with carbogen were performed at 1 min and 11 min (2 min per stimulation).
Protocol 1: Measurement of blood volume and SMRIO2
The total number of animals for this protocol was 19 rats (U87 (n = 9) and U251 (n = 10)) and was defined following a calculation of sample size based on preliminary experiments including three healthy rats. We measured the SMRIO2 under normoxia and carbogen which led to a mean difference of 7 ± 5%; power analysis indicated that a sample size of nine rats was required to obtain a statistical difference (<0.05) with a power of 80%. As SMRIO2 has a considerable variance in tumor-bearing rats, we expanded the cohort number to 10 though one U87 rat was excluded because of the lack of tumor development.
Anatomical imaging
To image the evolution of tumor volume, we used a T2w imaging sequence, RARE (rapid acquisition with relaxation enhancement): acceleration factor = 8, repetition time/echo time (TR/TE) = 5000/65 ms, 20 slices, acquisition matrix = 256 × 192, resolution 0.15 × 0.15 × 0.75 mm, acquisition time 2 min). To image tumor progression, each animal underwent a series of T2w imaging at 7, 10, and 14 days after the implantation of tumor cells. For the first protocol, we waited two to three weeks (U87 model) and three to four weeks (U251 model) after cell inoculation, to obtain a spread in the range of tumor volumes. Within each group, the day of imaging of each animal might vary as a function of the availability of the MRI. Manual segmentation was performed on coronal slices to delineate tumor core, peritumoral region, and contralateral tissue (composed of cortex and striatum). The specific regions of interests (ROIs) for the first protocol are shown in Figure 2(a).
Figure 2.
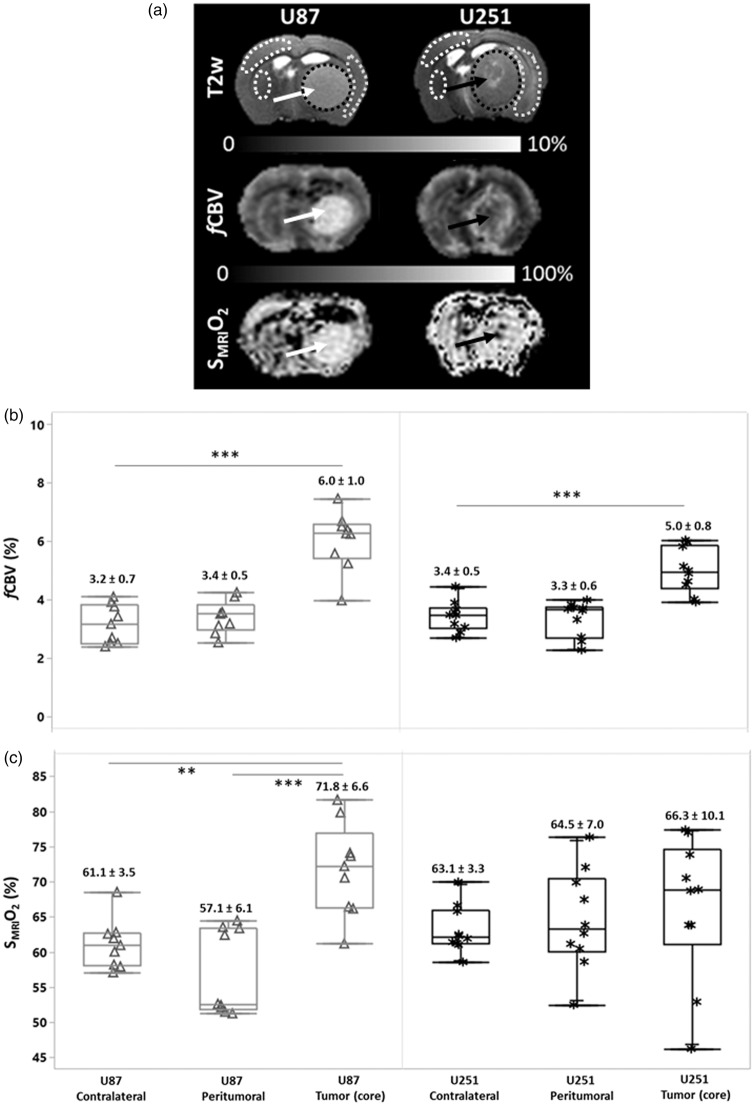
Characterization of vascular and oxygen status in two models of glioma. In the upper segment of the panel (a), representative T2w images are shown for the two respective models; U87 and U251. The middle panel illustrates fCBV maps and the lower panel, SMRIO2 maps. The white arrows indicate in the homogenous vascularized U87 model, increased fCBV throughout the tumor and, correspondingly, an increase in SMRIO2. The U251 model is highlighted by central hypo-vascularization in the core of the tumor (black arrow). With the SMRIO2 image in the U251 tumor (lower panel), the severely hypoxic core (black arrow) is surrounded by inner shell of enhanced fCBV which, in turn, is surrounded by another shell of decreased fCBV that corresponds to the zone of edema, noted on the T2w image. In the box plot representations (b–c), the fCBV and SMRIO2 values (medians, and quartiles) are shown for each region of interest as well as the corresponding means and standard deviations (numerical values). Each point corresponds to one rat (Δ U87| * U251). Statistical analyses were performed with Tuckey’s HSD test. Asterisks (*, **, ***) refer to the following levels of significance: p < 0.05, p < 0.005, and p < 0.001.
Fractional cerebral blood volume maps
Fractional cerebral blood volume (fCBV)was measured at equilibrium as previously described.22 Prior to the injection of the contrast agent, and air ventilation (FiO2: 30%), five T2*w (TR/TE = 20,000/12 ms, Number of EXcitation: NEX = 3, 50 contiguous slices, resolution = 0.3 × 0.3 × 0.3 mm) and four T2w (TR/TE = 20,000/40 ms, NEX = 3) images (echo planar imaging: EPI) were acquired with various echo times (TE for T2* = 12, 15, 18, 21, and 24 ms and for T2w = 40, 60, 80, and 100 ms, respectively) (Figure 1(a)). Then the breathing mixture carbogen was switched on and the two acquisitions were repeated. An intravenous administration of P904® (200 µmol.kg−1, Guerbet Research) was performed and T2*w images (TE = 12 ms) were acquired under carbogen first and subsequently under baseline conditions. Consequently, for each animal, fCBV maps were obtained under two conditions: baseline (FiO2 = 30%) and during carbogen breathing.
Oxygen saturation maps
Oxygen saturation (SMRIO2) maps were derived from the equation published by Christen and Lemason.23,24 Briefly, SMRIO2 maps were calculated as a function of the T2*w signal after correction of inhomogeneities of magnetic field (B0), blood volume fraction, and T2 effects. An SMRIO2 map under air and carbogen ventilation was generated for each animal.
Protocol 2: Measurement of cerebrovascular response
The cerebrovascular response was measured in the two models of glioma (U87 and U251; n = 6 for each), by testing the vasodilation induced by carbogen on the blood oxygenation level dependent weighted (BOLD) signal. For BOLD experiments, the sample size was estimated at n = 5. We increased the number to reach six animals/group. Rats were anesthetized (isoflurane 2% in oxygen-enhanced air (fraction of inspired O2:30%)). After endotracheal intubation and cannulation of the femoral artery (for gas analyses), a subcutaneous injection of 50 µg.kg−1 of medetomidine (Domitor®, Orion Pharma) was administrated. Five minutes later, isoflurane was stopped and a subcutaneous perfusion of medetomidine was initiated (0.1 mg.kg−1.h−1 at 6 ml.kg−1.h−1). For the imaging protocol, after a scout view and a T2w-RARE8 scan, the BOLD signal was measured with an EPI-BOLD weighted sequence of the following parameters: TR/TE = 3000/20 ms, 320 repetitions, 22 slices, slice thickness = 1 mm, acquisition matrix = 96 × 64, spatial resolution = 0.39 × 0.55 mm, acquisition time = 16 min. After 1 min of acquisition under baseline conditions, ventilation with carbogen was initiated and lasted 2 min. Carbogen ventilation was repeated once; the two sequences started at 1 and 9 min (Figure 1(b)). Two consecutive stimulations were performed to increase the statistical robustness of T maps. Before, during, and after each stimulation, an arterial sample was withdrawn to measure paO2, paCO2, and paH.
Image post-processing and data analyses
Image analysis was performed with in-house developed macros based on the ImageJ software (http://rsb.info.nih.gov/ij/, 1997–2014). The tumor volume was achieved by multiplication of the sum of contiguous tumor surface areas with the slice thickness. fCBV maps (expressed as a %) were calculated according to previous publications (equation (1))22,25
| (1) |
where γ is 2.67502 × 10⁸ rad.sec−1.T−1; B0 is 7T and ΔxUSPIO, the increase in blood magnetic susceptibility induced by the injection of ultra-small superparamagnetic iron oxide (uspio) was set to 0.28.10−6 cm.g.s.26
SMRIO2 maps were computed with the following equation
| (2) |
where the magnetic susceptibility difference between fully oxygenated and deoxygenated hemoglobin (Δx0) is equal to 0.264.10−6 cm.g.s.27 Hct is the microvascular hematocrit fraction and was set to 29%.28
The area under the curve (AUC) of the T2*w signal was firstly calculated by the trapezoid rule for each animal and each ROI. To take into account the delay in vasoreactivity observed in the tumor region, we defined the onset of each stimulation when R2* was greater than 2% of the baseline signal for each ROI (namely contralateral and tumoral tissues). The processing of functional BOLD images was performed with SPM12® software. After realignment (estimating and reslicing of all images), a spatial filtering was applied (0.8 mm). To generate tumor-adapted T maps for each voxel, a Student’s t-test (p < 0.05) was used to compare the R2* values obtained under carbogen with those obtained during baseline. The matrix of a general linear model was generated by the introduction of delays for each stimulation. A blue-red color map was used to display the significant changes of the signal (red – positive; blue – negative) and overlaid on the corresponding T2*w image.
Statistical analyses
Box plots, Tuckey’s HSD test, and linear regressions were performed using JMP Pro10® software (SAS). Further statistical analyses are detailed in the legends to figures. Data are presented either/or as mean ± sd or median and quartiles. As mentioned, SPM was used for BOLD studies.
Results
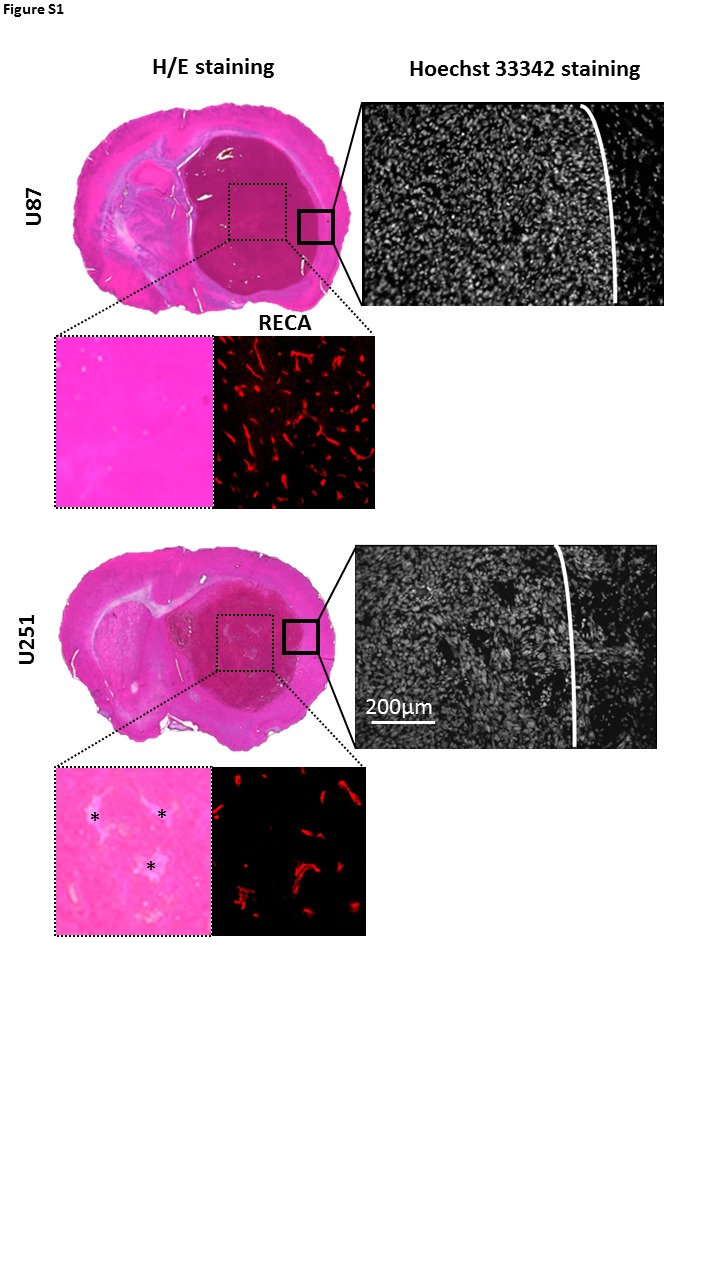
For the first protocol, the tumor volume range was 17.1–175.6 mm3 (median = 77.5 mm3) for U87 model and 21.8–104.8 mm3 (median = 36.1 mm3) for U251 model, respectively, values that are significantly different (p < 0.05). The U87 model appears less hypoxic, without apparent infiltration of tumor cells outside the tumor core and hypervascularization (rat endothelial cell antigen staining (RECA)). In contrast, the U251 model is known to be more hypoxic, with a chaotic but less prominent vasculature and presence of active infiltration in peritumoral regions, highly visible on the Hoechst 33342 staining (Figure S1).
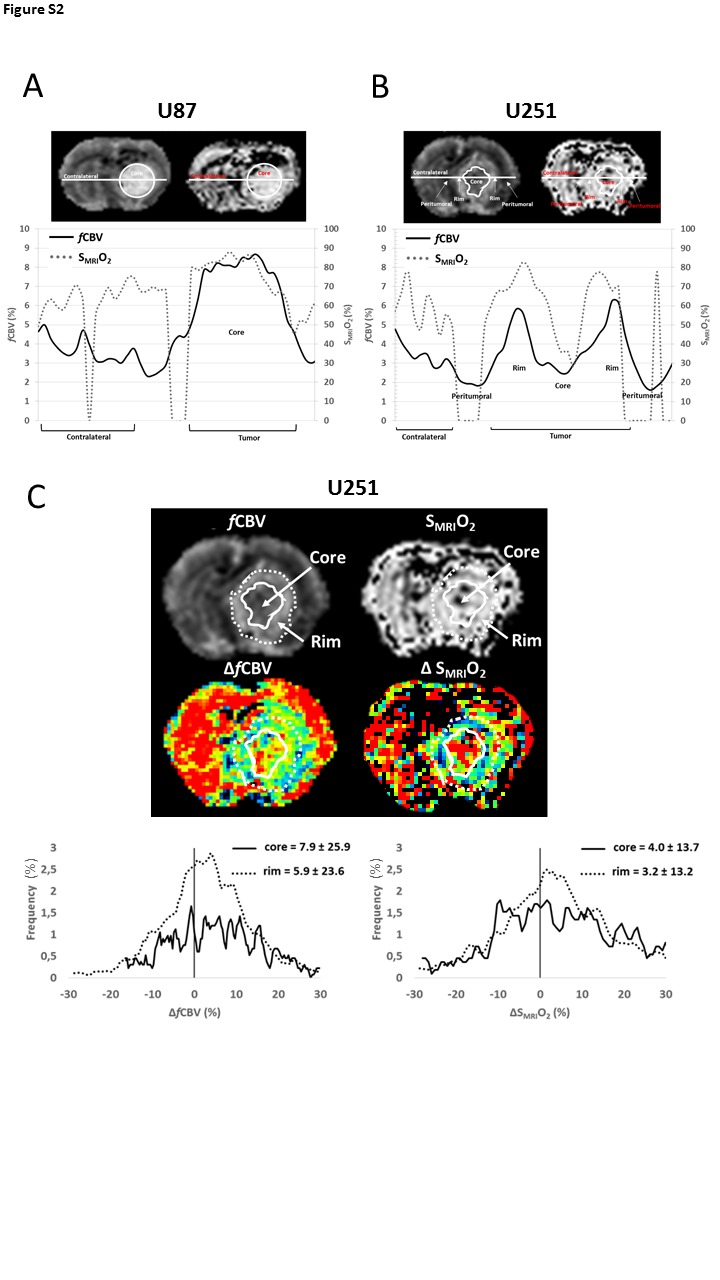
We evaluated, at baseline conditions, the fCBV and SMRIO2 in the two xenograft models (Figure 2(a)). As expected, resting fCBV in the U87 model was significantly greater (6.0 ± 1.0%, p < 0.001) in the tumor core compared to the peritumoral and contralateral tissues (3.4 ± 0.5% and 3.2 ± 0.7%, respectively). (Figure 2(b)). In contrast, the U251 tumor core exhibited a more spatially heterogeneous and significantly greater fCBV (5.0 ± 0.8%, p < 0.001) compared to the peritumoral and contralateral tissues in the same model. One of the factors that accounts, in part, for the heterogeneity in and around the U251 tumors is the edematous and hypovolemic zone that surrounds the shell of increased fCBV which, in turn, encloses the necrotic core of the tumor (black arrow, Figure 2(a), middle panel and Figure S1). The mean fCBV value measured in the tumor core of U87 glioma was significantly greater compared to the U251 model (p < 0.05) (Figure 2(b)). The SMRIO2 measured in the contralateral tissues of U87 and U251 models were 61.1 ± 3.5% and 63.1 ± 3.3%, respectively, indicative of a normal oxygenation in the contralateral hemisphere (Figure 2(c)). We found significantly greater O2 saturation values in U87 tumor core (71.8 ± 6.6%) compared to both its surrounding peritumoral tissue (57.1 ± 6.1%, p < 0.001) and contralateral tissue (p < 0.005), yet no significant difference was found between U87 and U251 tumor cores, in the former, 66.3 ± 10.1% (Figure 2(c)). Of note is the elevated spatial heterogeneity observed in the U251 model with a region of severe central hypoxia (black arrow, Figure 2(a), lower panel) and a surrounding region with more elevated oxygenation corresponding to the region of increased fCBV. Cross sectional analyses summarize (Figures S2(a) and S2(b)) these issues, especially those of spatial heterogeneity. In the U87 models, from the left to the right of the image, fCBV remains around 4% in the contralateral tissue and rises to 8% in the tumor core. In the U251 model, after the contralateral stability, a drop occurs for both fCBV and SMRIO2 corresponding to the peritumoral region. Thereafter, a rise in fCBV and SMRIO2 is detectable, corresponding to the tumor rim, followed by a subsequent fall in values corresponding to the hypovolemic and hypo-oxygenated tumor core. A second rise in fCBV and SMRIO2 values then occurs before the peritumoral region is attained. We found a positive correlation between normoxic fCBV and tumor volume in the more homogenous vascularization of the U87 tumor (r = 0.53), whereas in the U251 tumor, the correlation was negative (r = −0.43). However, no correlation was found between SMRIO2 and tumor volume in both models (r = −0.12 and r = 0.24 in U87 and U251 models, respectively).
Effects of carbogen inhalation on blood volume
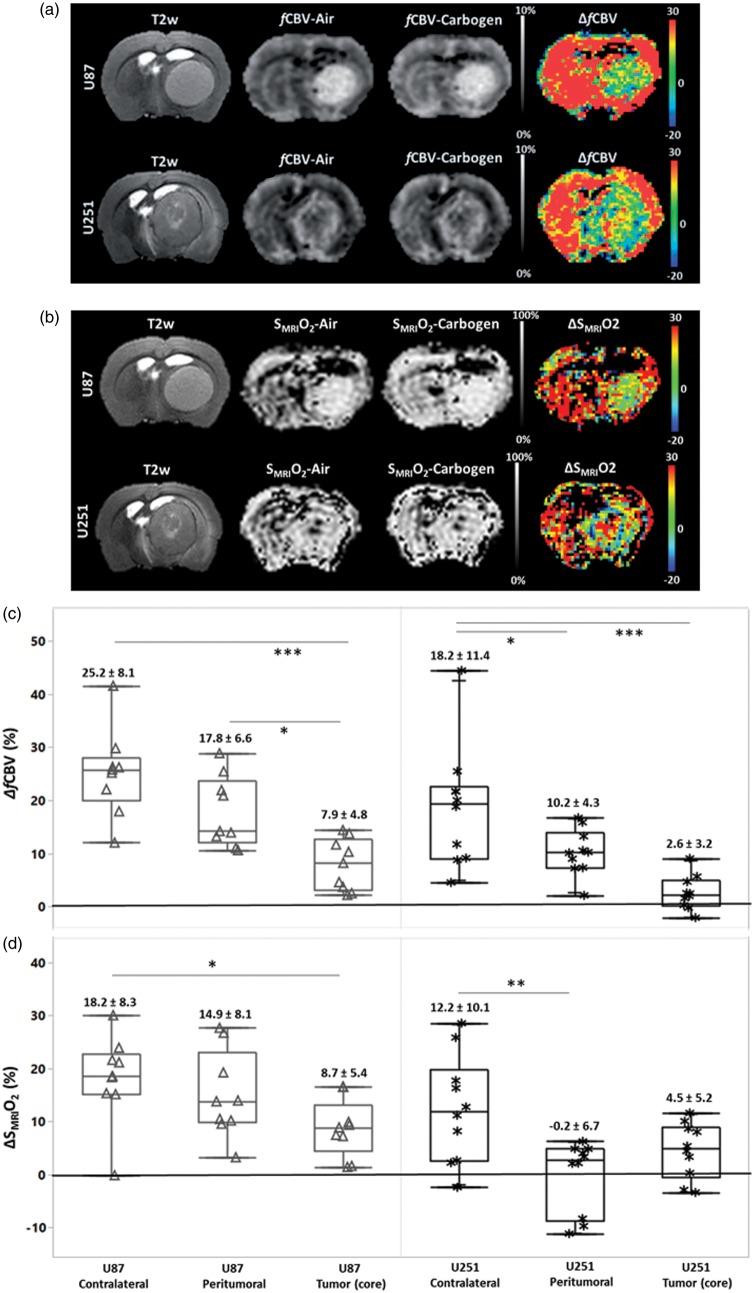
Ventilation with carbogen significantly increased both paCO2 and paO2 (paCO2; baseline = 37.4 ± 4.8 mmHg; carbogen = 60.9 ± 8.2 mmHg and paO2; baseline = 116.0 ± 10.0 mmHg; carbogen = 337.0 ± 9.0 mmHg). This gas mixture induced a significant increase in fCBV in the contralateral tissues of U87 and U251 models without inter-model significance (25.2 ± 8.1% and 18.2 ± 11.4%, vs. baseline p < 0.05) (Figure 3(a)). The carbogen-induced increases in fCBV were significantly higher in contralateral tissues than the changes observed in both U87 (7.9 ± 4.8%) and U251 (2.6 ± 3.2%) tumor cores. The response observed in the peritumoral region of U87 model was greater than that observed in the tumor core (p < 0.05) (Figure 3(c)). We found regions of elevated ΔfCBV (10.2 ± 4.3%) in the peritumoral region of the U251 model when the response to carbogen in the tumor core was not significantly different from baseline.
Figure 3.
Carbogen-induced changes in fCBV and SMRIO2. Composite images (anatomical T2w, fCBV (a) and SMRIO2 (b) under air, carbogen ventilation, and corresponding delta maps expressed as a percentage) in the two models of glioma. The box plots (c–d) illustrate quantitatively the percentage changes from baseline condition induced by carbogen in cerebral blood volume and O2 saturation respectively and statistical differences between tissues. The corresponding means and standard deviations are noted above the box plots.
Effects of carbogen inhalation on SMRIO2
Carbogen increased in SMRIO2 by 18.2 ± 8.3% and 12.2 ± 10.1% in the contralateral tissue of U87 and U251 models, respectively (Figure 3(b)). We noted a considerable response in the peritumoral region of U87 model (14.9 ± 8.1%) compared to the U251 model, which failed to response (−0.2 ± 6.7%, p < 0.001). In the tumor core, although ventilation with carbogen increased SMRIO2 by 8.7 ± 5.4% (p < 0.05) in the U87 model, an increase of no more than 4.5 ± 5.2% was seen in the U251 model (Figure 3(d)). The question then arose as to whether the changes in SMRIO2 (ΔSMRIO2) in contralateral and tumoral tissues were related to changes in fCBV (ΔfCBV) (Figure 4(a) and (b)). A significant relationship between ΔSMRIO2 and ΔfCBV was found not only in the contralateral tissue (r = 0.79) but also in the tumoral region of both models. In the U87 model, the correlation coefficient was r = 0.55, with a similar goodness of fit in the U251 model (r = 0.63). The relationship between fCBV and SMRIO2 remains identical in both types of tumors and their contralateral tissues as evidenced by the fact that the slopes and intercepts of the linear regressions (Figure 4(a) and (b)) do not significantly differ from each other. A potential correlation between the responses to the gas and tumor volume was then analyzed. In the U87 model, inverse negative relationships were observed (ΔfCBV and tumor volume: r = −0.67; ΔSMRIO2 and tumor volume: r = −0.55) (Figure 4(c), upper panel). However, for the U251 model, we failed to observe any correlation between tumor volume and carbogen-induced changes (r = 0.16 and r = 0.19, respectively) (Figure 4(c), lower panel). In summary, these data indicate that carbogen-induced changes for both ΔfCBV and ΔSMRIO2 are more evident in the U87 model but that this increase is progressively attenuated as tumor volume increase.
Figure 4.
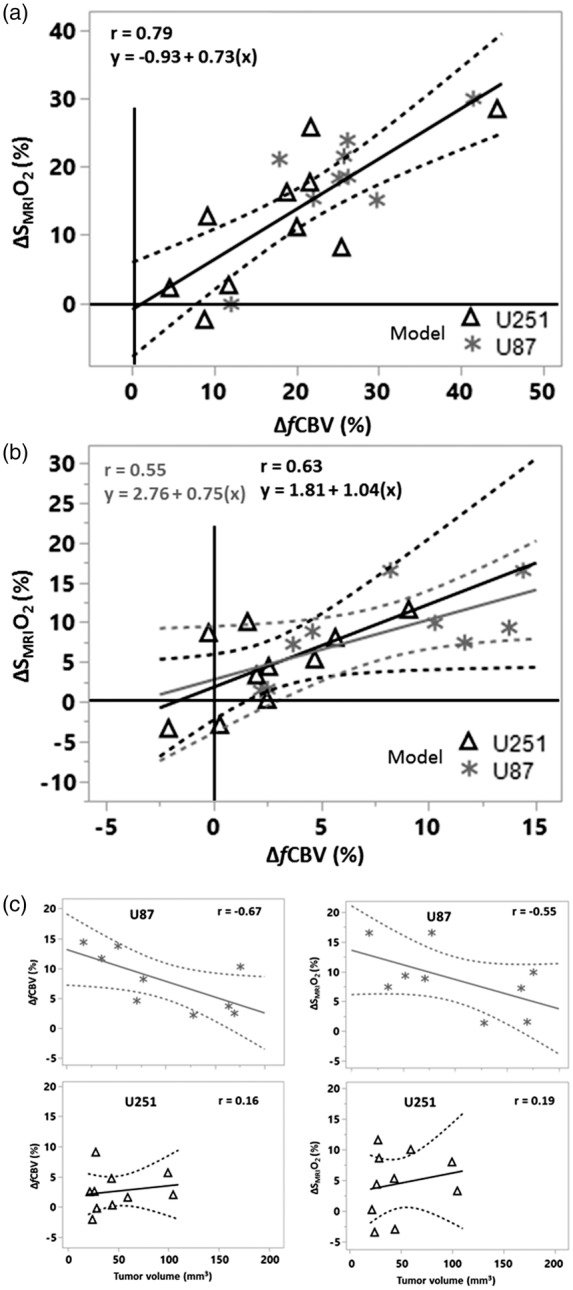
Carbogen-induced changes in the tissues explored. (a) Contralateral tissue; (b) Tumor. Note the changes in the x and y axes between (a) and (b). When the data shown in a and b are combined (n = 38), the following linear regression was found: ΔSMRIO2 (%) = 0.63 ΔfCBV + 2.39 (r = 0.81, p < 0.001, figure not illustrated). (c) ΔfCBV and ΔSMRIO2 as a function of tumor volume. The linear regressions are represented in solid lines, with the interval of confidence in dashed lines.
Effects of carbogen inhalation on dynamic vascular responses
For the second protocol, tumor volumes ranged between 29.6 and 163.7 mm3 (median = 56.6 mm3) for the U87 model and between 33.0 and 120.1 mm3 (median = 67.4 mm3) for the U251 model (p = 0.71).
Representative averaged dynamic R2* signals in the contralateral tissue and in both tumors are shown (Figure 5(a) and (b)). Carbogen ventilation resulted in an increase in T2*w signal recorded from the normal tissue. This increase was greater in the U87 tumor shown by the estimation of the AUC (11.0 ± 5.3) (Figure 5(c)). In contrast, in the U251 model, the signal changes were lesser (6.3 ± 3.9, p < 0.05). However, the AUC was greater in the contralateral tissue of U251 model (9.1 ± 3.9) compared to that of U87 model (6.4 ± 2.3, p < 0.05).
Figure 5.
Dynamic assessment of the cerebrovascular response to carbogen. The R2* signal, normalized to baseline, is illustrated for each model: (a) U87; (b) U251. The averaged maximal responses are shown for contralateral and tumoral tissues. Black dashed blocks represent the duration of carbogen inhalation. (c) The area under curve (AUC) in the tissues and models explored as estimated by the trapezoidal rule. (d) Response delay (s) to carbogen defined as a signal increase, greater than 2% of that observed during pre-exposure baseline conditions, obtained from a cross-correlation approach.
The calculation of the delay of response to the presence of the gas showed an onset of response of 75 ± 16 s and 82 ± 20 s for the first and the second stimulation, respectively, in the contralateral tissue (Figure 5(d)). The onset of response was more variable in the tumor regions in both models. Irregular, but not significant, delays were observed in the U87 model as compared to the contralateral tissue (1st stimulation; 112 ± 67 s and 2nd stimulation; 130 ± 57 s (ns)). In contrast, U251 model showed significantly increased delays compared to the contralateral tissue (1st stimulation; 165 ± 45 s (p < 0.001) and 2nd stimulation; 165 ± 62 s (p < 0.01)). Given this temporal evolution, we calculated not only the delay of response but also the overall intensity of response with statistical maps.
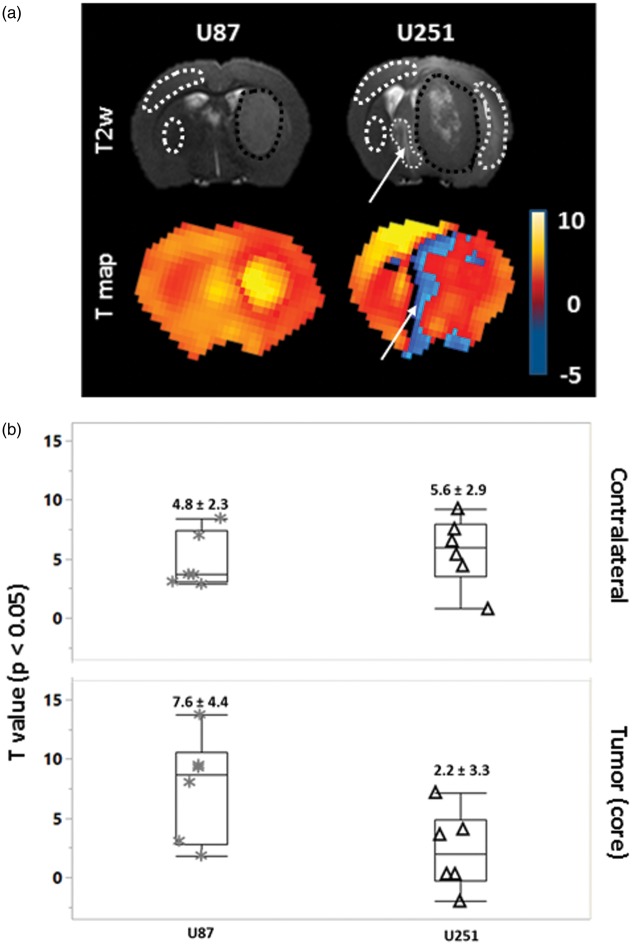
The quantitative analyses of vasoreactivity by SPM demonstrated responses of a three-fold greater significativity in the U87 (7.6 ± 4.4) compared to U251 model (2.2 ± 3.3) (Figure 6(a) and (b)). The contralateral tissues of both models showed an intermediate response (4.8 ± 2.3 and 5.6 ± 2.9 in U87 and U251, respectively).
Figure 6.
Statistical quantification of cerebrovascular responses to carbogen. (a) Representative coronal images, anatomic, and T maps (transposed on to T2*w) of one rat bearing a U87 and one a U251 tumor. The statistical significance of the parametric maps was set at p < 0.05. White arrows indicate the area (fine dashed line) with negative BOLD response. (b) Quantification of T values in the regions enclosed by the dashed lines.
Discussion
Although carbogen breathing has been promoted as an attractive approach to alleviate tumor hypoxia before radiation therapy in various peripheral tumors, the approach is ineffective for the majority of brain tumors.12 We hypothesized that the poor functionality of vessels within the tumor, especially when the tumor is hypoxic, may explain this failure.
We investigated, in this preclinical study, the vascular and oxygenation responses to carbogen breathing in two xenograft GB models, namely U87 and U251, previously described to exhibit different vascular and hypoxic profiles.17 Whitin the present setting, the two models of GB showed distinct anatomic, vascular, and oxygenation characteristics, in agreement with our previous report.17 During carbogen breathing, which significantly increases arterial gas tensions (especially paCO2 and paO2), marked changes in fCBV and SMRIO2 were observed in the contralateral tissue for all rats and the vasoreactivity was attested by the changes in the BOLD signal. These results are in line with those of Khan et al.13 who previously demonstrated in preclinical studies, an increase in oxygen pressure in the normal brain during carbogen breathing using EPR oximetry.29 These changes were also observed in the U87 model, which is the most uniformly vascularized model at baseline, although to a lesser extent for both fCBV and SMRIO2 and to a greater extent for BOLD signal. However, and more interestingly, modest changes were noticed for fCBV, SMRIO2, and vasoreactivity in the U251 tumor. We have extended the observations of Khan et al.,13 who already observed that the changes in oxygen pressure in the tumor would appear to be dependent on the vasodilatory capacity. Using the same model U251 developed in mice, these authors also observed that the response to carbogen was dependent on the initial ptO2.14 In the present study, we reinforce this hypothesis by showing that the ability to reoxygenate the tissue with carbogen is directly linked to the ability of vessels to dilate when exposed to carbogen. During carbogen breathing to measure vasoreactivity, we also identified in some rats of the U251 model, a reduced positive response in the tumor core accompanied with clearly negative response in the peritumoral region volume (Figure 6(a), white arrow), at the time when the contralateral tissue was maximally activated. Significant response delays were noticed in the U251 model for both stimulation periods compared to the contralateral tissue. Another manner to appreciate the physiological heterogeneity of the tumor is to measure the fCBV and SMRIO2 throughout a cross section of the brain: contralateral hemisphere, tumoral rims, and core (Figures S2(a) and (b)). The studies were made under baseline (normoxic) conditions. As mentioned previously, SMRIO2 is expressed in percentage and must be within 0 and 100%. Distributions of such measurements cannot be symmetrical especially when mean values are higher or lower. In order to reduce the impact of an asymmetrical distribution, we have used a log odds monotone scale for SMRIO2 measurements: log (SMRIO2/(100−SMRIO2)). To assess intra-individual variability of the carbogen-induced impacts, we have used the standard deviation of voxel-based delta maps (ΔSMRIO2(log)) for each rat (only tumor ROI values are reported). We found that intra-individual variabilities in tumoral regions were lower and more homogenous in the U87 model for both ΔfCBV and ΔSMRIO2(log) measurements (Table S1). Eight rats among nine (U87 model) have an intra-individaul variability lower than 0.85 in ΔSMRIO2(log) measurements, whereas in U251 model, seven of the 10 rats showed values lower than 0.9. For the ΔfCBV parameters, seven rats demonstrated an intra-individual variability lower than 11.7% in the more homogenous vascularized U87 model. In the U251 model, six rats exhibit a variability greater than 11.7%.
In addition to these findings, the sub-region analysis in the U251 model including hypo-perfused tumor core (fCBV = 3.2 ± 1%, SMRIO2 = 62.7 ± 20.1%) and hyperperfused tumor rim (fCBV = 4.7 ± 1.1%, SMRIO2 = 69.5 ± 18.1%) confirms that carbogen-induced changes are spatially heterogeneous (Figure S2(c)).
These finding are concur with those obtained by the AUC analysis. The particular pattern observed in the tumor of the U251 model is described by two principal characteristics. Firstly, the presence of a marked edema leading to a pressure on the blood vessels which, in turn, impairs the vascular response (decreased ΔfCBV accompanied with negative ΔSMRIO2). Secondly, an intracranial hemodynamic steal may also explain not only the absence of response but also the negative response, principally observed in peritumoral regions, as observed in the BOLD analyses. In parallel with our investigation, a study performed in healthy volunteers and GB patients, Ben Bashat et al.30 observed either no or a decreased response to hypercapnia as well as, for some patients, a negative BOLD response.
At an early stage of tumor progression, the U87 model shows a significantly greater vascular reactivity, similar to that of contralateral tissue. For larger tumor volumes, we detected a negative relationship with ΔfCBV, which suggests a transformation of this model into an even more chaotically vascularized tumor, unresponsive to carbogen, especially prominent in tumor volumes greater than 100 mm3. SPM analysis confirmed that the U87 tumor is more responsive to a carbogen stimulus when compared to U251 model. It should be noted that there was no statistical difference between final tumor volumes of each group despite slight difference in the coefficients of variability. In our study, the vasoactive challenges were performed under medetomidine anesthesia which is less likely to disturb baseline cerebrovascular tone and more importantly the T2*-oxygenation ratio in cortex, hippocampus, and deep gray structures (striatum and thalamus).31
There are a few limitations to the current study that should be addressed. Firstly, as shown in the manuscript (equation (2)), SMRIO2 is calculated on the basis of an equation in which various factors are included (fCBV, local hematocrit (Hct), T2). One assumes that a non-proportional variation of one of these parameters may result in enhanced variability of the calculated SMRIO2. The influence of the local Hct value on the calculation of SMRIO2 has been discussed elsewhere.26 Secondly, the larger variability of in the ΔSMRIO2 could also be attributed to heterogeneity of the ROIs that define the contralateral tissue (Figures 2(a) and 6(a)). The ROIs encompassed both the cortex and the striatum of the contralateral hemisphere. These two structures may respond in different magnitudes to a carbogen challenge. Indeed, our data on the dynamic BOLD variations indicate that the cortex seems more responsive to carbogen than the striatum (Figure 6(a)). Finally, variations of ΔSMRIO2 in the contralateral hemisphere may be indirectly influenced by the response of the tumor region. Indeed, in the U251 tumor, the variability of ΔSMRIO2 in the reference tissue was 83% versus 46% in U87 rats. Further preclinical studies are clearly required with X-ray treatment protocols to demonstrate if carbogen can favorably modify the radio-response of hypoxic tumor tissue.
Despite the limitations described above, the strength of our study is that we have first demonstrated the ability of using multiparametric MRI to simultaneously assess, in the same examination, blood volume and oxygenation maps. Secondly, with this approach, we have been able to show that the ability of brain tumor to respond to carbogen ventilation, employed as a reoxygenation strategy, is dependent on the vasodilatory capacity. We also report, that, even in the most vascularized tumor model (U87), the response decreases as a function of tumor volume. This point can be explained by the non-linearity of the intracranial volume–pressure relationships with cerebral mass lesions.32 Indeed, an abolished cerebrovascular reactivity to CO2 is found with decreased mean perfusion pressure caused by intracranial hypertension as has been previously reported and modelized.33–35 Additionally, in this study, we attempted to clarify the functional MRI response to carbogen in two models of glioma. The extrapolation of our study to clinical applications should be limited to a group of well-defined GB patients to avoid the complications due to tumor mass/volume effects. The principal message of our investigation is to encourage the use of multiparametric MRI to select patients who respond to carbogen.
Supplementary Material
Funding
The author(s) disclosed receipt of the following financial support for the research, authorship, and/or publication of this article: This study was supported by the Centre National de la Recherche Scientifique (CNRS), the Université de Caen-Normandie (UCN), the Conseil Regional de Basse-Normandie (CRBN) – 13P03220, the Fondation Elen (Armenia), the European Union-Fonds de Développement Régional (FEDER), L’Europe s’engage en Basse-Normandie – convention n° 32638, the Institut National du Cancer (INCa) – NCT 01200134, the Agence Nationale de la Recherche-Labex IRON (ANR-11-LABX-0018-01).
Declaration of conflicting interests
The author(s) declared no potential conflicts of interest with respect to the research, authorship, and/or publication of this article.
Authors’ contributions
AC, OT, and SV designed the study; ACD, AG, JT, LC, DD performed the data acquisition; AC, FK, ND, OT, SV performed data analyses and were blinded of the treatment; MML performed histological and immunohistochemical staining; ETM, EP, and MB supervised and revised the manuscript. All the authors approved the final version of the manuscript.
Supplementary material
Supplementary material for this paper can be found at http://jcbfm.sagepub.com/content/by/supplemental-data
References
- 1.Hirata K, Terasaka S, Shiga T, et al. 18F-Fluoromisonidazole positron emission tomography may differentiate glioblastoma multiforme from less malignant gliomas. Eur J Nucl Med Mol Imaging 2012; 39: 760–770. [DOI] [PubMed] [Google Scholar]
- 2.Gray LH, Conger AD, Ebert M, et al. The concentration of oxygen dissolved in tissues at the time of irradiation as a factor in radiotherapy. Br J Radiol 1953; 26: 638–648. [DOI] [PubMed] [Google Scholar]
- 3.Corroyer-Dulmont A, Chakhoyan A, Collet S, et al. Imaging modalities to assess oxygen status in glioblastoma. Front Med 2015; 2: 57. [DOI] [PMC free article] [PubMed] [Google Scholar]
- 4.Pérès EA, Gérault AN, Valable S, et al. Silencing erythropoietin receptor on glioma cells reinforces efficacy of temozolomide and X-rays through senescence and mitotic catastrophe. Oncotarget 2015; 6: 2101–2119. [DOI] [PMC free article] [PubMed] [Google Scholar]
- 5.Evans SM, Jenkins KW, Chen HI, et al. The relationship among hypoxia, proliferation, and outcome in patients with de novo glioblastoma: a pilot study. Transl Oncol 2010; 3: 160–169. [DOI] [PMC free article] [PubMed] [Google Scholar]
- 6.Spence AM, Muzi M, Swanson KR, et al. Regional hypoxia in glioblastoma multiforme quantified with [18F] fluoromisonidazole positron emission tomography before radiotherapy: correlation with time to progression and survival. Clin Cancer Res 2008; 14: 2623–2630. [DOI] [PMC free article] [PubMed] [Google Scholar]
- 7.Diepart C, Karroum O, Magat J, et al. Arsenic trioxide treatment decreases the oxygen consumption rate of tumor cells and radiosensitizes solid tumors. Cancer Res 2012; 72: 482–490. [DOI] [PubMed] [Google Scholar]
- 8.Rojas A, Hirst VK, Calvert AS, et al. Carbogen and nicotinamide as radiosensitizers in a murine mammary carcinoma using conventional and accelerated radiotherapy. Int J Radiat Oncol Biol Phys 1996; 34: 357–365. [DOI] [PubMed] [Google Scholar]
- 9.Horsman MR, Siemann DW, Chaplin DJ, et al. Nicotinamide as a radiosensitizer in tumours and normal tissues: the importance of drug dose and timing. Radiother Oncol 1997; 45: 167–174. [DOI] [PubMed] [Google Scholar]
- 10.Pigott K, Dische S, Saunders MI. Short communication: the addition of carbogen and nicotinamide to a palliative fractionation schedule for locally advanced breast cancer. Br J Radiol 1995; 68: 215–218. [DOI] [PubMed] [Google Scholar]
- 11.Kaanders JH, Bussink J, van der Kogel AJ. ARCON: a novel biology-based approach in radiotherapy. Lancet Oncol 2002; 3: 728–737. [DOI] [PubMed] [Google Scholar]
- 12.van der Maazen RW, Thijssen HO, Kaanders JH, et al. Conventional radiotherapy combined with carbogen breathing and nicotinamide for malignant gliomas. Radiother Oncol 1995; 35: 118–122. [DOI] [PubMed] [Google Scholar]
- 13.Khan N, Mupparaju S, Hekmatyar SK, et al. Effect of hyperoxygenation on tissue pO2 and its effect on radiotherapeutic efficacy of orthotopic F98 gliomas. Int J Radiat Oncol Biol Phys 2010; 78: 1193–1200. [DOI] [PMC free article] [PubMed] [Google Scholar]
- 14.Khan N, Li H, Hou H, et al. Tissue pO2 of orthotopic 9L and C6 gliomas and tumor-specific response to radiotherapy and hyperoxygenation. Int J Radiat Oncol Biol Phys 2009; 73: 878–885. [DOI] [PMC free article] [PubMed] [Google Scholar]
- 15.Valable S, Petit E, Roussel S, et al. Complementary information from magnetic resonance imaging and 18F-fluoromisonidazole positron emission tomography in the assessment of the response to an antiangiogenic treatment in a rat brain tumor model. Nucl Med Biol 2011; 38: 781–793. [DOI] [PubMed] [Google Scholar]
- 16.Collet S, Valable S, Constans JM, et al. [18F]-fluoro-L-thymidine PET and advanced MRI for preoperative grading of gliomas. Neuroimage Clin 2015; 8: 448–454. [DOI] [PMC free article] [PubMed] [Google Scholar]
- 17.Corroyer-Dulmont A, Pérès EA, Petit E, et al. Noninvasive assessment of hypoxia with 3-[18F]-fluoro-1-(2-nitro-1-imidazolyl)-2-propanol [18F]-FMISO: a PET study in two experimental models of human glioma. Biol Chem 2013; 394: 529–539. [DOI] [PubMed] [Google Scholar]
- 18.Lemasson B, Christen T, Serduc R, et al. Evaluation of the relationship between MR estimates of blood oxygen saturation and hypoxia: effect of an antiangiogenic treatment on a gliosarcoma model. Radiology 2012; 265: 743–752. [DOI] [PubMed] [Google Scholar]
- 19.Cantin S, Villien M, Moreaud O, et al. Impaired cerebral vasoreactivity to CO2 in Alzheimer’s disease using BOLD fMRI. Neuroimage 2011; 58: 579–587. [DOI] [PubMed] [Google Scholar]
- 20.Kilkenny C, Browne WJ, Cuthill IC, et al. Improving bioscience research reporting: the ARRIVE guidelines for reporting animal research. PLoS Biol 2010; 8: e1000412. [DOI] [PMC free article] [PubMed] [Google Scholar]
- 21.Paxinos G, Watson C. The rat brain in stereotaxic coordinates. San Diego, CA: Elsevier, 2007.
- 22.Valable S, Lemasson B, Farion R, et al. Assessment of blood volume, vessel size, and the expression of angiogenic factors in two rat glioma models: a longitudinal in vivo and ex vivo study. NMR Biomed 2008; 21: 1043–1056. [DOI] [PubMed] [Google Scholar]
- 23.Christen T, Lemasson B, Pannetier N, et al. Evaluation of a quantitative blood oxygenation level-dependent (qBOLD) approach to map local blood oxygen saturation. NMR Biomed 2010; 24: 393–403. [DOI] [PubMed] [Google Scholar]
- 24.Christen T, Lemasson B, Pannetier N, et al. Is T2* enough to assess oxygenation? Quantitative blood oxygen level–dependent analysis in brain tumor. Radiology 2012; 262: 495–502. [DOI] [PMC free article] [PubMed] [Google Scholar]
- 25.Troprès I, Grimault S, Vaeth A, et al. Vessel size imaging. Magn Reson Med 2001; 45: 397–408. [DOI] [PubMed] [Google Scholar]
- 26.Christen T, Bouzat P, Pannetier N, et al. Tissue oxygen saturation mapping with magnetic resonance imaging. J Cereb Blood Flow Metab 2014; 34: 1550–1557. [DOI] [PMC free article] [PubMed] [Google Scholar]
- 27.Spees WM, Yablonskiy DA, Oswood MC, et al. Water proton MR properties of human blood at 1.5 Tesla: magnetic susceptibility, T1, T2, T2*, and non-Lorentzian signal behavior. Magn Reson Med 2001; 45: 533–542. [DOI] [PubMed] [Google Scholar]
- 28.Cremer JE, Sevill MP. Regional brain blood flow, blood volume, and haematocrit values in the adult rat. J Cereb Blood Flow Metab 1983; 3: 254–256. [DOI] [PubMed] [Google Scholar]
- 29.Hou H, Dong R, Li H, et al. Dynamic changes in oxygenation of intracranial tumor and contralateral brain during tumor growth and carbogen breathing: a multisite EPR oximetry with implantable resonators. J Magn Reson 2012; 214: 22–28. [DOI] [PMC free article] [PubMed] [Google Scholar]
- 30.Ben Bashat D, Artzi M, Ben Ami H, et al. Hemodynamic response imaging: a potential tool for the assessment of angiogenesis in brain tumors. PLoS One 2012; 7: e49416. [DOI] [PMC free article] [PubMed] [Google Scholar]
- 31.Uhrig L, Ciobanu L, Djemai B, et al. Sedation agents differentially modulate cortical and subcortical blood oxygenation: evidence from ultra-high field MRI at 17.2 T. PLoS One 2014; 9: e100323. [DOI] [PMC free article] [PubMed] [Google Scholar]
- 32.Kawoos U, McCarron RM, Auker CR, et al. Advances in intracranial pressure monitoring and its significance in managing traumatic brain injury. Int J Mol Sci 2015; 16: 28979–28997. [DOI] [PMC free article] [PubMed] [Google Scholar]
- 33.Harper AM, Glass HI. Effect of alterations in the arterial carbon dioxide tension on the blood flow through the cerebral cortex at normal and low arterial blood pressures. J Neurol Neurosurg Psychiatry 1965; 28: 449–452. [DOI] [PMC free article] [PubMed] [Google Scholar]
- 34.Hauerberg J, Ma X, Bay-Hansen R, et al. Effects of alterations in arterial CO2 tension on cerebral blood flow during acute intracranial hypertension in rats. J Neurosurg Anesthesiol 2001; 13: 213–221. [DOI] [PubMed] [Google Scholar]
- 35.Ursino M, Lodi CA. Interaction among autoregulation, CO2 reactivity, and intracranial pressure: a mathematical model. Am J Physiol Hear Circ Physiol 1998; 274: H1715–H1728. [DOI] [PubMed] [Google Scholar]
Associated Data
This section collects any data citations, data availability statements, or supplementary materials included in this article.
Supplementary Materials


