Abstract
We report the enhanced mechanical properties of AZ31 magnesium alloys by plasma electrolytic oxidation (PEO) coating in NaOH, Na2SiO3, KF and NaH2PO4·2H2O containing electrolytes. Mechanical properties including wear resistance, surface hardness and elastic modulus were increased for PEO-coated AZ31 Mg alloys (PEO-AZ31). DC polarization in Hank’s solution indicating that the corrosion resistance significantly increased for PEO-coating in KF-contained electrolyte. Based on these results, the PEO coating method shows promising potential for use in biodegradable implant applications where tunable corrosion and mechanical properties are needed.
Keywords: Plasma electrolytic oxidation (PEO), Magnesium, Biodegradable materials, Coated AZ31 alloy
1. Introduction
Biodegradable materials including magnesium, iron, and zinc-based alloys have been studied for use in orthopedic and cardiovascular devices [1,2]. In particular, because of their non-toxicity [3], mechanical properties (close to bone) [4], and degradability [5], magnesium-based alloys are being explored by the research communities [6–9]. However, one of the potential problems is fast corrosion at the initial stage of implantation, leading to large hydrogen gas evolution and mechanical failure at bone/device interface [6,10,11]. Plasma electrolytic oxidation (PEO), as one of the surface modification methods, can increase initial corrosion resistance and mechanical strength in the body since this barrier layer protects the substrate from the surrounding human body-fluid environment [12]. PEO can control porosity during an electrolytic passivation process (sparking phenomenon). The porous surface at the micro-/nano-scale level can promote cell adhesion/proliferation, leading to fast-healing of local tissue [13–18]. PEO-coated layer has relatively low toxicity [19]. This process is applicable for medical devices with complex geometries such as ACL screws, plates, and pins [19–22].
In this work, we report enhanced mechanical properties and increased corrosion resistance of the biodegradable magnesium alloy which is coated by plasma electrolytic oxidation (PEO). We carefully investigate the effect of the electrolyte composition, electrical parameters and substrates (AZ31) on the surface morphology, mechanical properties and corrosion resistance. Nanoindentation and wear tests were conducted to evaluate surface mechanical properties of PEO coating.
2. Materials and methods
2.1. Preparation of the initial substrate
As-drawn AZ31 Mg alloy (mass fraction, %) of 3.0 Al, 1.0 Zn and the balance Mg was purchased from Goodfellow. AZ31 rod of 1.27 cm diameter was polished to remove the oxide layer sequentially with 600, 800, 1000, and 1200 grit silicon carbide paper before cutting into samples of 3 mm thickness. All samples were connected with copper wire on one side using a conductive epoxy (Eccobond 56C/Cat 9 kit, Ablestik) and mounted in epoxy resin (Epokwick™, BUEHLER) with the other surface exposed. In order to ensure the same surface roughness for all test samples, the surfaces were carefully polished using 400, 600, 800, 1000, and 1200 grit silicon carbide paper, using ethanol as a lubricant, and drying with nitrogen stream.
2.2. Plasma electrolyte oxidation (PEO) coating
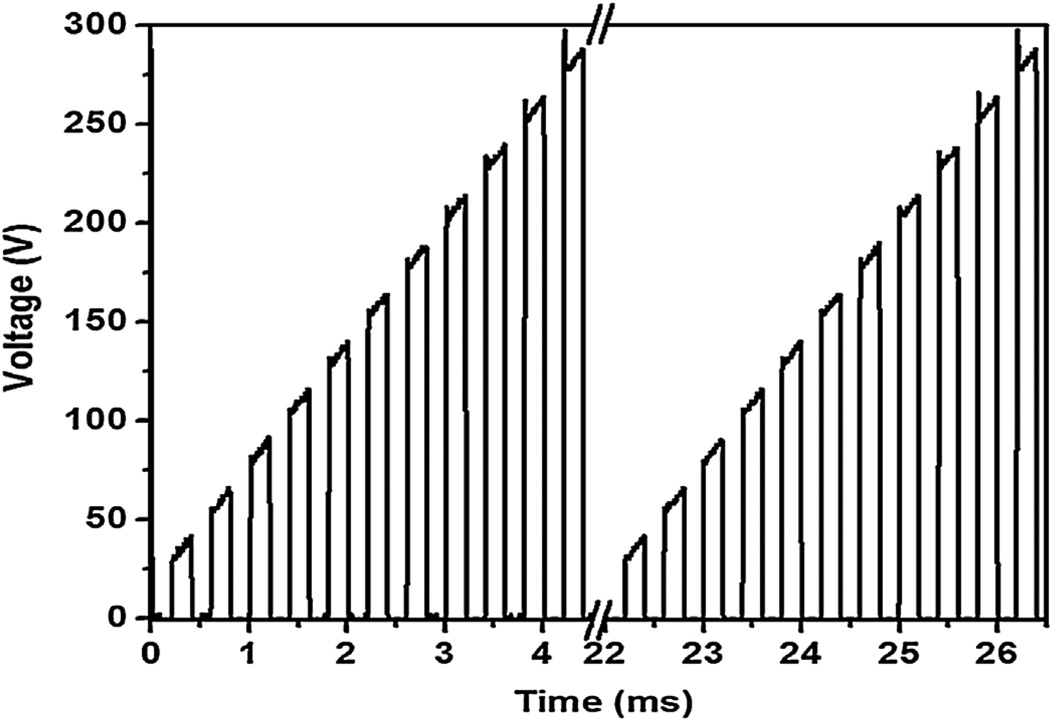
The PEO process was carried out using a pulsed AC power source with a gradient pulse of ton:toff = 0.2 ms:0.2 ms (2.5 kHz). This gradient pulse was repeated with a frequency of 225 Hz (Fig. 1). This wave was applied to magnesium alloy for 2 min at room temperature. We used a high voltage power supply, ET Systems® electronic GmbH. The exposed surface area was 1.27 cm2 and maximum current density applied was 118 mA/cm2. We recorded voltage and current waveform using an oscilloscope (Tektronix TDS 1012B). AZ31 alloy specimens and stainless steel rod were used as the anode and cathode, respectively.
Fig. 1.
Applied voltage profile for PEO coating on magnesium alloy.
As shown in Table 1, the three electrolytes were prepared separately. Millipore Milli-Q deionized water was used as a solvent. Chemicals, sodium silicate (Na2SiO3, anhydrous, Alfa Aesar), sodium hydroxide (NaOH, ≥97.0%, Fisher Scientific), potassium fluoride (KF, 99%, ACROS), and sodium dihydrogen phosphate (NaH2PO4·2H2O, 99.9%, Fisher Scientific) were used as the resources for three different electrolytes. The electrolyte was continuously stirred by a magnetic stirrer during coating at room temperature. Stainless steel rod was used as a cathode. Finally, coated samples were rinsed with deionized water and dried in warm air.
Table 1.
Concentration and components of the three different electrolytes for PEO coating on AZ31 alloy.
| Samples | Concentration (M) | |||
|---|---|---|---|---|
| Na2SiO3 | NaOH | KF | NaH2PO4·2H2O | |
| AZ31-1 | 0.08 | 0.05 | 0.1 | 0.04 |
| AZ31-2 | 0.08 | 0.05 | – | 0.04 |
| AZ31-3 | 0.08 | 0.05 | 0.1 | – |
2.3. Coating characterization
The surface morphologies of the uncoated/PEO-AZ31 alloys were characterized by field-emission scanning electron microscopy (FE-SEM, Hitachi 8000, 10 kV). Surface roughness and wear profiles were analyzed using white light interferometry based WYKO RST Plus non-contact optical profiler.
For cross-sectional analysis of the PEO-AZ31 alloys, the alloys were mechanically cut in half using a rotating saw (Allied® TechCut 5). Cross-sections were prepared by hand polishing with 600–1200 grit SiC paper, successively. Sections were coated with a thin coating of gold/palladium using a sputter coater (Bio-Rad® E5400) to improve conductivity and imaging using SEM. Elemental mapping was performed using EDX (Bruker AXS5350, Germany).
The XRD measurements were performed using a commercial X-ray diffractometer (Bruker D8 Tools, λ = 1.5406 A, 40 mA, 40 kV). The scanning range of diffraction angle (2θ) was set between 20° and 80° with steps of 0.02° and time step of 1 s.
2.4. Electrochemical studies
The electrochemical measurements were collected in a three-electrode setup: uncoated and PEO-AZ31 alloys as the working electrode and a platinum wire electrode and an Ag/AgCl electrode (saturated KCl) as counter and reference electrodes, respectively. The DC polarization test was performed using Reference 600 potentiostat (Gamry Instrument, USA) in the simulated body fluid (SBF) solution (8 g/L NaCl, 0.4 g/L KCl, 0.14 g/L CaCl2, 0.35 g/L NaHCO3, 1 g/L glucose, 0.2 g/L MgSO4·7H2O, 0.09 g/L KH2PO4 and 0.06 g/L NaH2PO4·7H2O) at room temperature. DC polarization tests for samples were conducted in the −0.1 V to +0.5 V range with a scan rate of 5 mV/s after immersion in SBF for 10 min to reach a steady open circuit potential [23].
2.5. Mechanical properties
Nanoindentation (MTS Nanoindenter XP) tests using a Berkovich indenter were performed to measure hardness (H) and elastic modulus (E) of uncoated and PEO-AZ31 samples. Measurements were conducted in continuous stiffness measurement (CSM) mode. The Berkovich indenter has a tip angle of 65.3°. Though rule of thumb suggests that the indentation depths should not exceed one tenth of the film thickness, due to high surface roughness and porosity of the coatings, nanoindentation data at low depths would not represent true values of the coating. For this reason, the indentation depth was set at 1000 nm, within the coating thickness, with a surface approach velocity of 10 nm/s and a frequency of 45 Hz. A minimum of 25 indents were made for each test at various locations on the sample as the coating surface was porous and heterogeneous. The analysis of hardness and elastic modulus was done from the experimentally obtained load versus depth of penetration plots using the Oliver and Pharr method [24]. Experimental hardness and elastic modulus values were calculated over a depth range within 500 nm in TestWorks® software to stick to one tenth of film thickness. This nullifies the effect of the substrate on hardness and elastic modulus values. Further, Weibull analysis is performed on hardness and elastic modulus data due to huge scatter in the data. Wear tests were conducted on a Ball-on-disc tribometer (Bruker Corporation). A tungsten carbide ball with a diameter of 3.96875 mm was used as the static friction partner against the PEO coatings and uncoated AZ31 alloy. The wear tests were carried out under a normal load of 3 N. A load of 3 N was selected in order to remain within the coating during the wear test. Samples reciprocated against the ball with the frequency of 0.5 Hz, stroke length of 3 mm and 150 cycles (150 passes). Wear of tungsten carbide ball was negligible. Volumetric wear loss was calculated by multiplying wear cross sectional area with stroke length. Specific wear rate, an indicator of material removal rate, was calculated as the wear volume per unit load and unit sliding distance. All wear tests were conducted under dry sliding conditions at room temperature. Specimen surfaces were thoroughly degreased with acetone and allowed to dry before start of each test. The worn surfaces were examined under optical microscope and mechanical stylus profilometer for wear track measurements.
3. Results and discussion
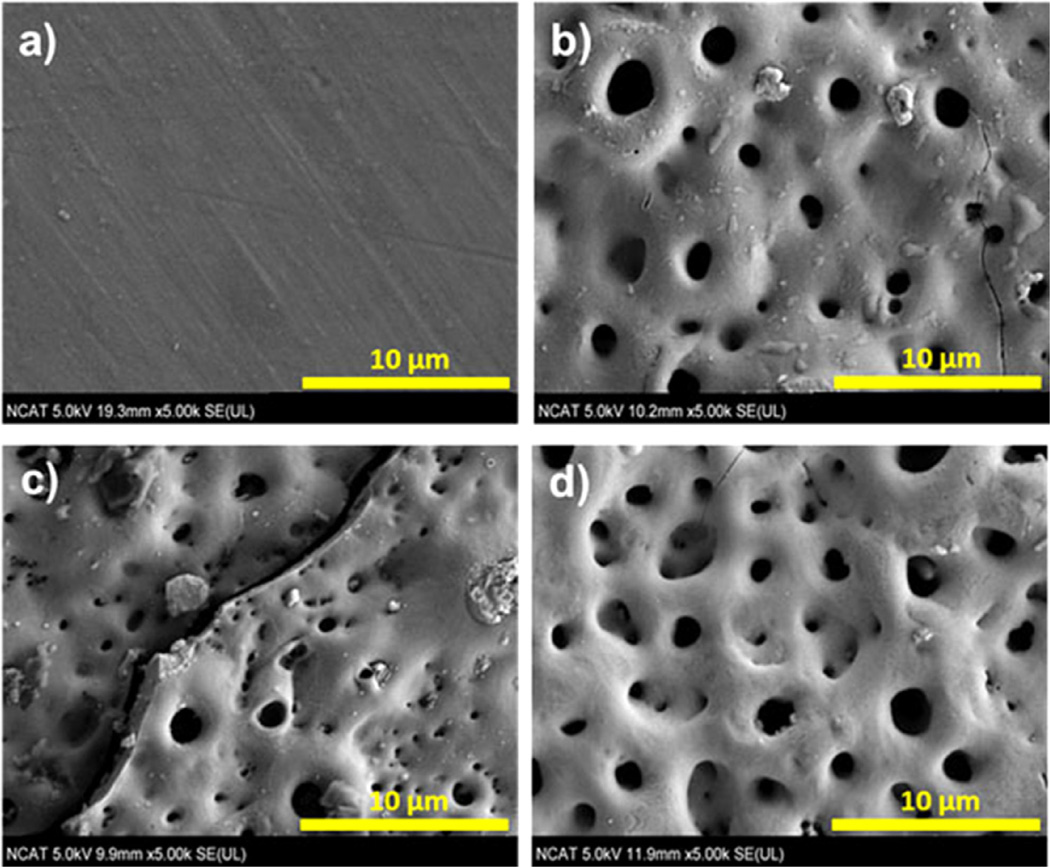
SEM images of the surface morphologies of AZ31 substrate and the three different PEO-AZ31 based samples are shown in Fig. 2. PEO coated (Fig. 2b–d) samples show the presence of pores due to the PEO process [25,26]. The pores are considered to be “footprints” of the plasma discharge channels and reach the coating/electrolyte interface during the plasma-generated melting.
Fig. 2.
SEM images of surfaces. (a) AZ31 substrate, (b) AZ31-1 (including fluoride and phosphorus), (c) AZ31-2 (no fluoride), and (d) AZ31-3 (no phosphorus).
AZ31-1 and AZ31-3 (Fig. 2b and d) show less pores and smooth surfaces due to the fluoride in the electrolyte compared to AZ31-2 without fluoride. However, the large cracks and non-uniform surface were observed in AZ31-2 (Fig. 2c). An increased number of pores will provide more areas for corrosive media to attack and reduce corrosion resistance.
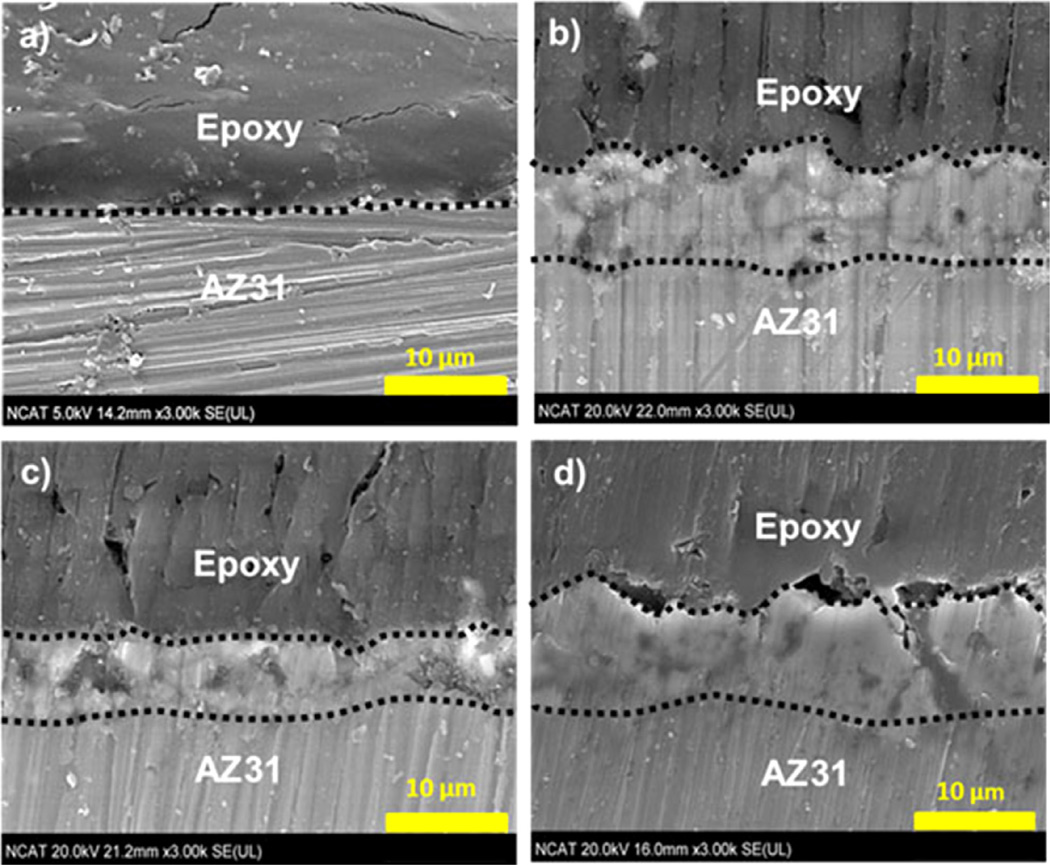
Fig. 3 shows the representative cross-section images of uncoated/PEO-coated samples. In all three cases, the substrate-coating interface shows the presence of intermetallic phases, a result of dissolution of AZ31 substrate in the early stages of processing [27]. The thicknesses of coatings AZ31-1 and AZ31-3 are similar, these are formed in the electrolyte with KF. It can be originated from the conductivity of fluoride, as reported the rate of film formation increased when anions with higher conductivity were introduced to the coating solution [28,29]. Thickness of coating in AZ31-2 is thinner, 6.26 ± 0.27 than thickness of coating in AZ31-1 and ZA31-3 (see Table 2).
Fig. 3.
Cross-section images. (a) AZ31 substrate, (b) AZ31-1 (including fluoride and phosphorus), (c) AZ31-2 (no fluoride), and (d) AZ31-3 (no phosphorus).
Table 2.
Summary of surface morphology of the AZ31 substrate and PEO coated samples.
| Samples | Pore size (µm) | Number of pore (2.5/mm2) | Thickness (µm) | Roughness (µm) |
|---|---|---|---|---|
| AZ31 | – | – | – | 0.253 ± 0.13 |
| AZ31-1 | 1.40 ± 0.75 | 35 ± 7 | 8.54 ± 0.70 | 0.625 ± 0.03 |
| AZ31-2a | 0.63 ± 0.19 | 89 ± 3 | 6.26 ± 0.27 | 3.646 ± 1.01 |
| AZ31-3 | 1.43 ± 0.37 | 46 ± 5 | 8.70 ± 0.49 | 0.561 ± 0.02 |
AZ31-2 data were not considered cracks on the surface.
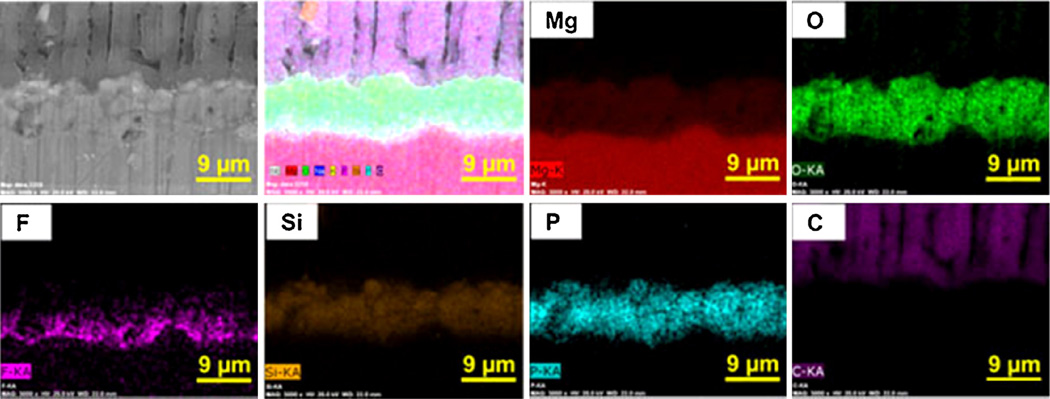
Fig. 4 shows the cross-section elemental mapping EDX image of PEO-coated AZ31-1, representatively. It can be seen that the fluoride layer does form closer to the substrate/coating interface of the AZ31 substrate. Fluoride plays an important role in the initial film formation as the presence of fluoride in the oxide film is a result of the reaction between the fluoride anion in the solution and the Mg cation in the film [30]. It is well known that fluoride is very electronegative, meaning that it has a strong tendency to acquire a negative charge and form fluoride ions in solution. Yerokhin et al. [31] showed that adding compounds that contain the F− ion into an electrolyte solution helped to increase the electrolyte conductivity. The Mg alloy is quickly passivated in the presence of the F− ion and undissolved MgF2 is generated on the surface [32]. This gives the reason why a fluoride-enriched zone is found at the alloy/solution interface and MgF2 is able to form as a barrier layer so quickly [33]. This thin layer of fluoride ions will protect the substrate from oxidation. The cross-section profiles also reveal the other elements as part of the layer involves a heavy amount of phosphorus, oxygen, and magnesium. These elements appear to be uniformly distributed in the coatings [34].
Fig. 4.
Representative cross-section elemental mapping EDX analysis for PEO-coated AZ31-1 (including fluoride and phosphorus).
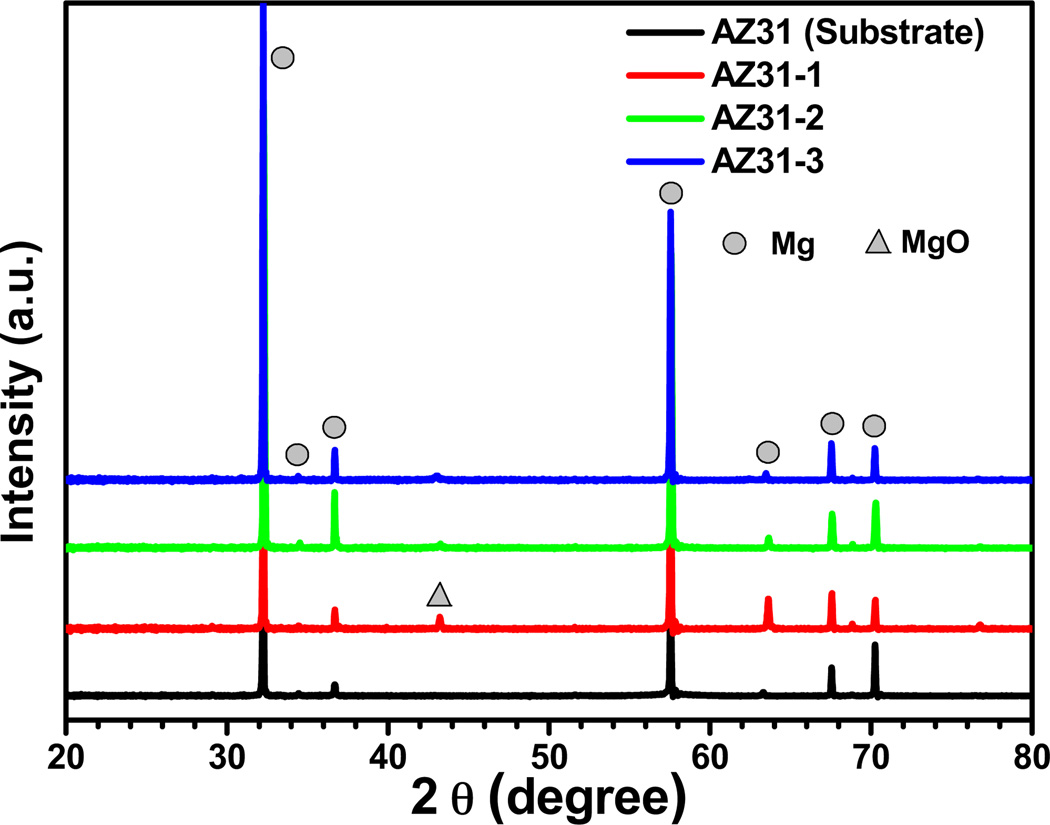
XRD patterns for AZ31 substrate alloy and PEO coatings are shown in Fig. 5. It can be seen that the AZ31 alloy is mainly composed of a hexagonal close packed (hcp) magnesium-rich phase. For the PEO-coated samples, the XRD results show the dominating magnesium-rich phase as well as periclase MgO in the coatings. No peaks associated with fluoride, phosphorus, or potassium appears for the PEO coatings indicating that any magnesium compounds that may have resulted are amorphous. These elements exist in small amounts due to the short coating time of only 2 min.
Fig. 5.
XRD patterns of AZ31 substrate and PEO-coated AZ31 alloys. Mg and MgO are corresponded with JCPDS No. 89-5003 and JCPDS No. 45-0946.
Table 2 shows the summary of surface morphology of PEO coated AZ31 samples. Pore size, number of pore, and thickness were estimated from SEM images (Figs. 2 and 3). Average surface roughness, Ra of the AZ31 substrate and the PEO-AZ31-1, 2, and 3 coatings were measured using non-contact optical pro-filer (in Fig. S1). Fig. S1 results show that AZ31-1 and AZ31-3 coatings have lower surface roughness compared to AZ31-2. The addition of F ion into a solution is known to increase the electrolyte conductivity. This allows a decrease in the work voltage and final voltage during the PEO coating process [31,35]. This decrease in voltage promotes the conversion of larger spark discharges to fine spark discharges while increasing the number of sparks. The associated large sparks that result from the PEO coating process are known to influence the surface roughness in a detrimental way and finer sparks help in reducing surface roughness [36]. The smaller sparks that are generated allow for smaller pore size with a higher pore number, providing a more uniform coating. The effect of phosphate on the surface roughness is virtually insignificant, as there is no significant difference in coating roughness between coatings AZ31-1 and AZ31-3.
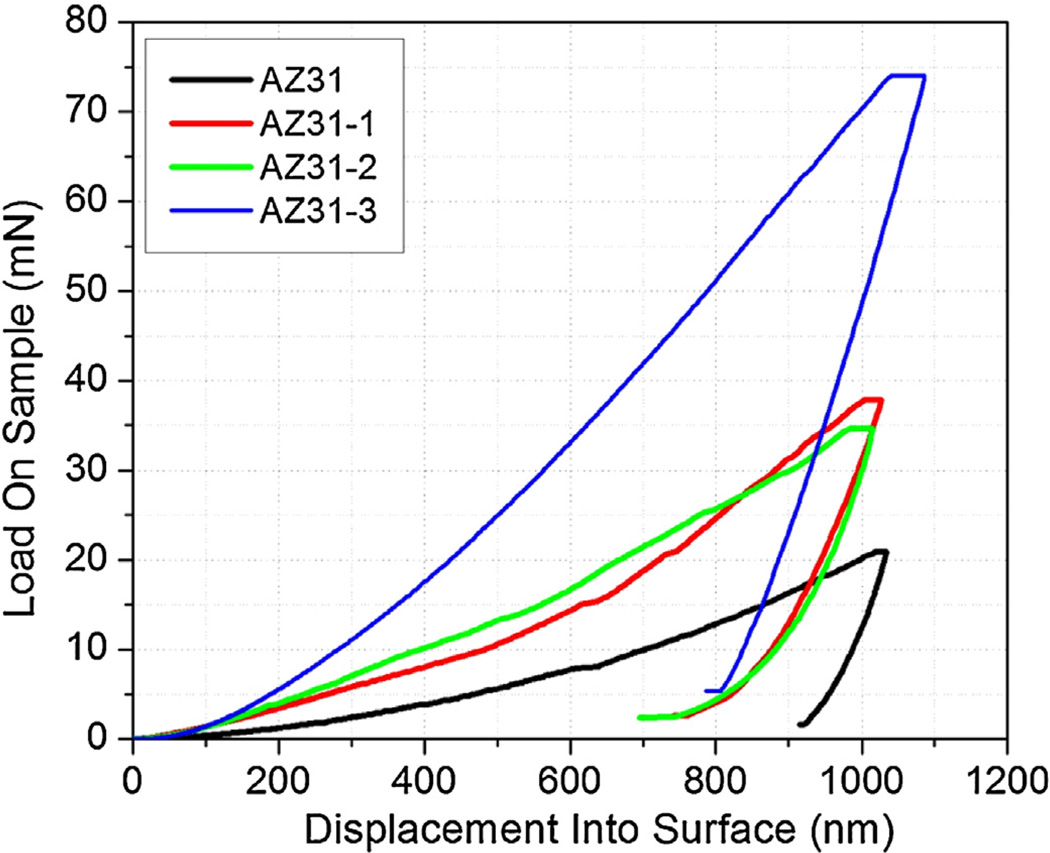
Typical nanoindentation load–displacement curves for AZ31 and PEO coatings are shown in Fig. 6. AZ31 and PEO coatings are indented up to 1 µm indentation depth. It can be noticed that the maximum load required to indent up to 1 µm depth for AZ31-3 (~75 mN) is significantly higher that required for AZ31 substrate (~20 mN). Weibull analysis was performed on nanoindentation hardness and elastic modulus data for at least 25 indents on each sample. Table 3 shows the summary of the Weibull analysis data for hardness and elastic modulus data for AZ31 substrate and PEO-coated samples. Characteristic hardness (H) and elastic modulus (E) are shown to decrease with the PEO coating. This is expected as the coatings have a statistical distribution of defects in the form of pores and micro-cracks. Due to the higher density of defects in the coatings when compared to the substrate AZ31, more scatter is introduced which leads to a further reduction in modulus. Elastic modulus has significantly increased when PEO-coatings were applied. Hardness and elastic modulus of the PEO-coated AZ31 can be improved in accordance with PEO coating process and electrolytes condition [37–40].
Fig. 6.
Typical nanoindentation load versus displacement curves at 1 µm indentation depth for the AZ31 substrate and PEO coated samples.
Table 3.
Weibull analysis data for characteristic hardness and elastic modulus data.
| Sample | Hardness | Elastic modulus | ||||
|---|---|---|---|---|---|---|
| Weibull modulus (m) |
Characteristic hardness (GPa) |
Correlation coefficient (R2) |
Weibull modulus (m) |
Characteristic elastic modulus (GPa) |
Correlation coefficient (R2) |
|
| AZ31 | 6.4 | 1.1 | 0.96 | 13.05 | 47.4 | 0.92 |
| AZ31-1 | 1.6 | 4.9 | 0.93 | 2.62 | 74.6 | 0.93 |
| AZ31-2 | 1.4 | 3.4 | 0.92 | 1.50 | 44.0 | 0.89 |
| AZ31-3 | 5.7 | 7.0 | 0.91 | 5.85 | 99.1 | 0.87 |
Results indicate that the hardness of PEO coatings is around 3–7 times greater than that of AZ31 substrate. This increase is attributed to the formation of coated layer. AZ31-1 and AZ31-3 coatings exhibited highest hardness which can be attributed to the addition of KF, leading to a more compact coating structure. The high hardness and elastic modulus values are related to the microstructure and phase composition of the coatings, which can improve the wear performance of the AZ31 substrate as well. Coating AZ31-2 (without fluoride) exhibited very low hardness and elastic modulus values which indicates that there were more defects in the coating. The reason for such high scatter was that the coating was full of surface defects such as micro/macro pores, shallow cracks, and defects lying in close vicinity to the sub-surface region. These flaws would have a statistical size distribution due to the PEO coating process [37]. Coating AZ31-2 also displayed the lowest characteristic values for hardness and elastic modulus.
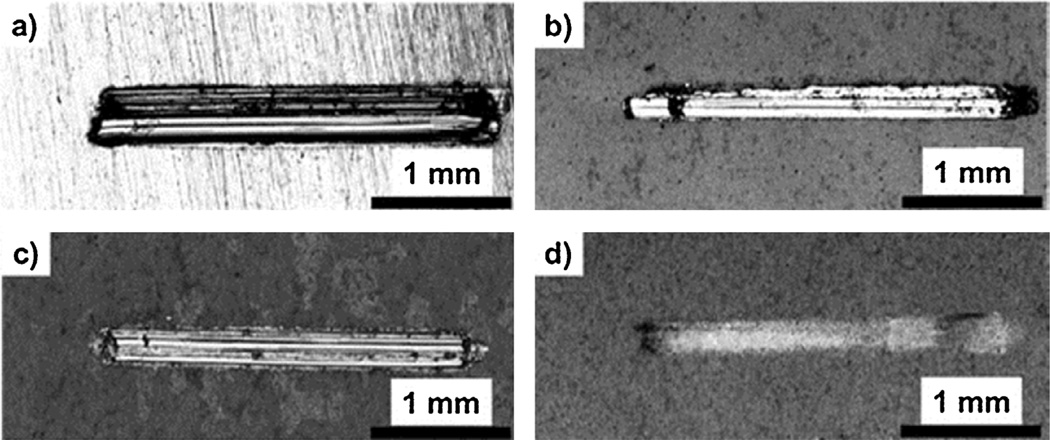
The optical images of the wear tracks of untreated and PEO-AZ31 alloys are shown in Fig. 7. The damage to the uncoated AZ31 is evident in Fig. 7a, where the wear track width is greater than that of the coated AZ31 alloys. Lim et al. also received similar results [41]. It could be possible that β particles by Al element in AZ31 could have contributed to the depth of the wear tracks [36]. The appearance of the wear tracks for the PEO-AZ31 samples was different from that of the uncoated AZ31 substrate, indicating that the PEO-coated surfaces have a much higher resistance to abrasive wear. Although the coating thicknesses are similar, it is clear that the electrolyte solution plays a major role on the wear of the surface. Very little wear of the coating was observed in case of AZ31-3 coating as reflected by an incomplete wear track of the coating AZ31-3 in Fig. 7d, indicating that the major part of the coating was still intact. In the case of coatings AZ31-1 and AZ31-2, the coating was completely removed. This can be evidenced by the shiny nature of the wear tracks and the developed score marks in Fig. 7b and c. For coating AZ31-3, there is no appearance of the shiny metal substrate, indicating higher wear resistance under the same load and cycles. It can be concluded that the PEO-coated samples do possess improved wear resistance.
Fig. 7.
Optical images of wear tracks for (a) AZ31 substrate, (b) AZ31-1 (including fluoride and phosphorus), (c) AZ31-2 (no fluoride), and (d) AZ31-3 (no phosphorus).
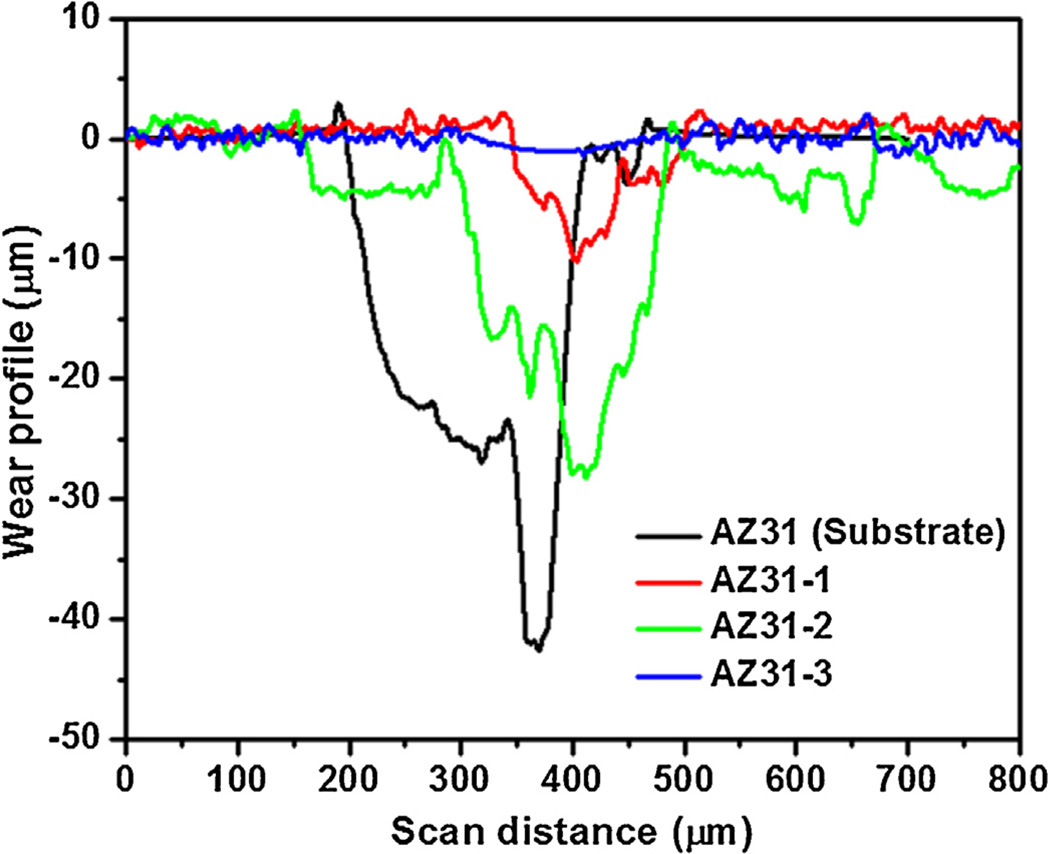
Cross-sectional profiles of the wear tracks for wear width, depth, and wear cross-sectional (c/s) area measurements were obtained using a mechanical stylus profilometer and plotted in Fig. 8. Table 4 shows the summary of cross-sectional wear profile measurements. Fig. 8 shows the cross-sectional wear profiles for AZ31 substrate as well as coatings AZ31-1, AZ31-2 and AZ31-3 at a load of 3 N and 150 passes. After 150 passes, the average wear depths for AZ31 substrate and AZ31-2 were 39.3 µm and 29.5 µm, whereas, for coatings AZ31-1 and AZ31-3, the wear depths were only 11.18 µm and 1.42 µm, respectively. Similar trend is noticed for wear cross-sectional area as well. For AZ31, the wear depth was non-uniform indicating an abrasive wear caused due to the resulting debris. It is clear that the lack of fluoride had a tremendous effect on wear behavior of the coating. In case of coating AZ31-3, the fluoride added may have been able to participate in the reaction easier without the presence of phosphorus giving way to a denser, more compact and more wear resistant MgF2 layer at the coating/substrate interface (Fig. 4).
Fig. 8.
Wear track profiles of (a) AZ31 substrate, (b) AZ31-1 (including fluoride and phosphorus), (c) AZ31-2 (no fluoride), and (d) AZ31-3 (no phosphorus).
Table 4.
Ball-on-disc wear measurements of AZ31 substrate and PEO coated samplesa (wear load: 3 N, number of passes: 150).
| Samples | Wear width (µm) | Wear depth (µm) | Wear c/s area (µm2) | Wear volume (µm3) | Specific wear rate (m3/N m) |
|---|---|---|---|---|---|
| AZ31 | 274.6 | 39.3 | 4.69 × 10³ | 1.39 × 10⁸ | 1.04 × 10⁻¹¹ |
| AZ31-1 | 181.6 | 11.2 | 1.04 × 10³ | 3.07 × 10⁶ | 2.32 × 10⁻¹² |
| AZ31-2 | 207.8 | 29.5 | 3.67 × 10³ | 1.01 × 10⁷ | 8.16 × 10⁻¹² |
| AZ31-3 | 196.8 | 1.4 | 0.22 × 10³ | 6.25 × 10⁷ | 4.93 × 10⁻¹³ |
Values reported are average value of five wear profile measurements.
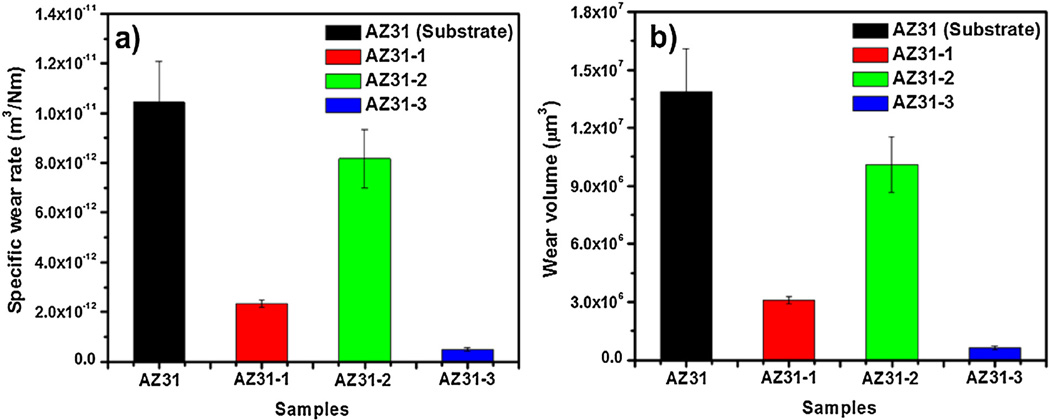
Fig. 9a demonstrates the effect of PEO coating on the wear properties of AZ31 alloy. Uncoated AZ31 substrate exhibited high specific wear rate, whereas AZ31-3 alloy with PEO coating exhibited minimal wear. Mechanical characterization of AZ31 and PEO-coated AZ31 alloys has indicated a correlation between hardness and wear rate. In other words, alloy with minimum hardness, as in the case of uncoated AZ31 alloy, has exhibited poor wear resistance. This is evident by the high wear rate. Alloy with maximum hardness (PEO-coated AZ31-3) has shown high wear resistance, evident from the low wear rate.
Fig. 9.
(a) Specific wear rate and (b) wear volume for AZ31 substrate, AZ31-1 (including fluoride and phosphorus), AZ31-2 (no fluoride), and AZ31-3 (no phosphorus).
The uncoated AZ31 substrate recorded an average (n = 5) wear rate coefficient of 1.04 × 10⁻¹¹ m3/N m, whereas average specific wear rates observed for coatings AZ31-1, AZ31-2, and AZ31-3 are 2.32 × 10⁻¹² m3/N m, 8.16 × 10⁻¹² m3/N m and 4.93 × 10⁻¹³ m3/N m, respectively (Table 3). While there is difference of one to two orders of magnitude between the AZ31 substrate specific wear rate and the PEO-coated sample specific wear rate, there is no significant difference between the three coatings. This was reported in the literature through a study by Liang et al. [35]. The average wear volume for the AZ31 substrate was 1.39 × 107 µm3. The average wear volumes for coatings AZ31-1, AZ31-2, and AZ31-3 were 3.07 × 106 µm3, 1.01 × 107 µm3, and 6.25 × 105 µm3, respectively. A lower wear volume indicates a better wear resistance and this further proves that the PEO coatings can improve wear resistance over the uncoated AZ31 substrate. The improvement of wear resistance can be correlated to the high hardness associated with the MgO phases present (Fig. 5) in all coatings under dry sliding conditions. The higher wear rates and better wear resistance of the coatings AZ31-1 and AZ31-3 are attributed to the presence of KF in the electrolyte solution. The smaller wear rate coefficient and higher wear volume of the coating AZ31-2 are related to the cracks and weak adhesion of the coating layer to the substrate alloy due to lack of KF. It is clear that the tribological properties of coatings can be controlled by the electrolyte solution used.
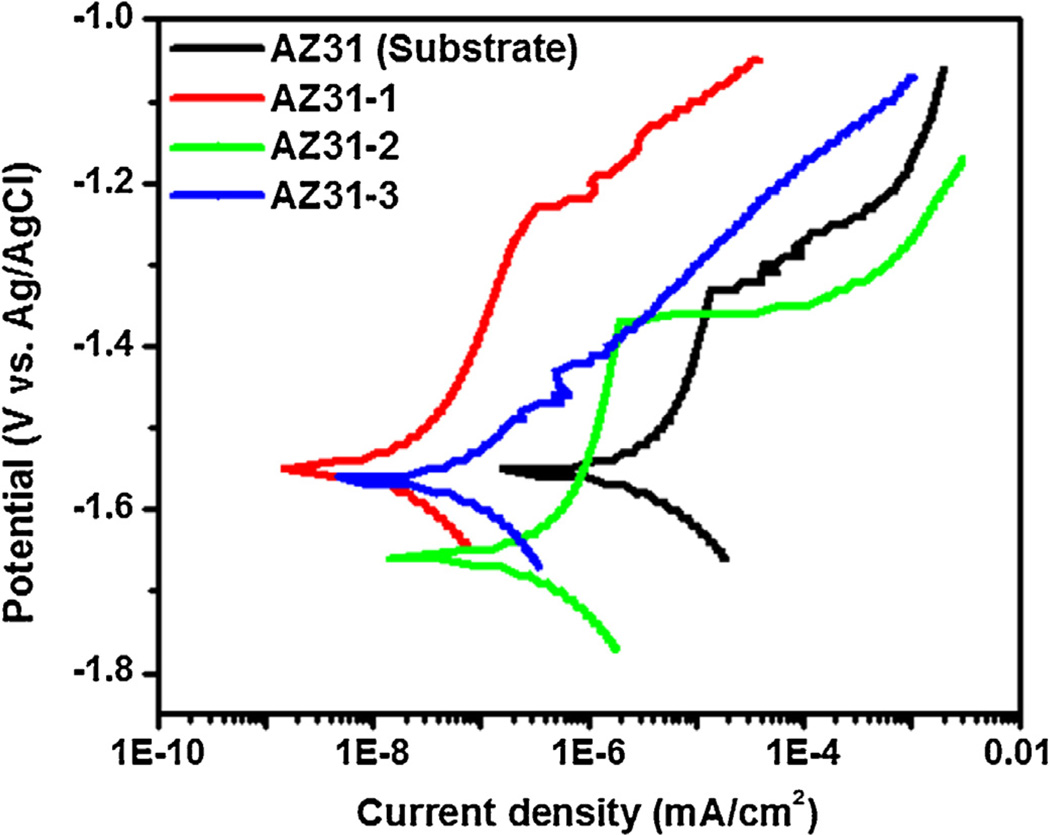
Fig. 10 shows the results obtained from DC polarization. The corrosion potential (Ecorr) and corrosion current density (Icorr) were derived directly from the DC polarization curves and the electrochemical data are presented in Table 5. AZ31 substrate had exhibited a corrosion current density of 8.06 × 10⁻⁶ A/cm2 with an associated corrosion potential −1.55 V. The corrosion potentials of the AZ31-1 and AZ31-3 were similar to that of the AZ31 substrate and the AZ31-2 showed more active corrosion potential. The corrosion current density values of PEO coated the AZ31-1 and AZ31-3 were better two orders of magnitude than that for the AZ31 substrate. This indicates that, using fluoride, PEO coating with higher corrosion resistance can be produced on the magnesium surface. Coatings AZ31-1 and AZ31-3 have Icorr values of 3.98 × 10⁻⁸ and 8.44 × 10⁻⁸, respectively, which results in corrosion rates of 9.12 × 10⁻⁷ MPY and 1.93 × 10⁻⁶ MPY, respectively. When compared to the corrosion rates of substrate AZ31 and coating AZ31-2 (1.85 × 10⁻⁴ and 2.38 × 10⁻⁵, respectively), the PEO-coatings including fluoride can increase corrosion resistance. Moreover, the coating AZ31-2 had registered a lower breakdown potential compared to that of AZ31 substrate. It can be depicted the localized damage and thin layer. Also, while reviewing the morphology of coating AZ31-2 as shown in Fig. 2c, uniform coating is not present. This gives way to localized and accelerated corrosion as the corrosive ions attack at weaker areas in the coating first. Based on the corrosion potential, corrosion current density, and polarization resistance, PEO coatings offer improved corrosion protection over the AZ31 substrate.
Fig. 10.
DC polarization curves for AZ31 substrate, and PEO coated samples (AZ31-1; including fluoride and phosphorus, AZ31-2; no fluoride, AZ31-3; no phosphorus) in Hank’s solution.
Table 5.
Summary of DC polarization results for AZ31 substrate and PEO coated samples.
| Samples | ECorr (V) | ICorr (A/cm2) | βAnodic | βCathodic | Vb (V) | Corrosion rate (MPY) |
|---|---|---|---|---|---|---|
| AZ31 | −1.55 | 8.06 × 10⁻⁶ | 0.9211 | 0.2136 | −1.33 | 1.85 × 10⁻⁴ |
| AZ31-1 | −1.55 | 3.98 × 10⁻⁸ | 0.3837 | 0.24 | −1.23 | 9.12 × 10⁻⁷ |
| AZ31-2 | −1.66 | 1.04 × 10⁻⁶ | 1.0208 | 0.2743 | −1.37 | 2.38 × 10⁻⁵ |
| AZ31-3 | −1.56 | 8.44 × 10⁻⁸ | 0.1489 | 0.1534 | −1.47 | 1.93 × 10⁻⁶ |
4. Conclusions
Surface coating of AZ31 alloy was successfully achieved by PEO technique with/without phosphate and fluoride. PEO-AZ31 alloys exhibited improved mechanical properties such as hardness and elastic modulus compared to the AZ31 substrate. The coating formed in the electrolyte with fluoride has resulted in a dense, compact coating structure, and low roughness of coating surface on the AZ31 substrate. Moreover, it has a higher surface hardness and better wear resistance than that formed in the electrolyte without fluoride.
It was also verified that PEO-coated AZ31 alloys with fluoride have higher corrosion resistance than AZ31 substrate through DC polarization analysis in body fluid solution. Although there are many challenges that remain ahead, PEO coatings with desired mechanical properties and adjustable degradation rate could play a significant role in the development of coatings for biodegradable metals.
Supplementary Material
Acknowledgments
This research was supported by the NSF Engineering Research Center (ERC) for revolutionizing metallic biomaterials (NSF-0812348) and NIH NIGMS grant (1SC3GM113728-01) at North Carolina A&T State University.
Footnotes
Appendix A. Supplementary data
Supplementary data associated with this article can be found, in the online version, at http://dx.doi.org/10.1016/j.mseb.2016.02.005.
References
- 1.Zreiqat H, Howlett CR, Zannettino A, Evans P, Schulze-Tanzil G, Knabe C, Shakibaei M, Biomed J. Mater. Res. 2002;62:175–184. doi: 10.1002/jbm.10270. [DOI] [PubMed] [Google Scholar]
- 2.Aksakal B, Yildirim Ö, Gul H, Fail J. Anal. Prev. 2004;4:17–23. [Google Scholar]
- 3.Song G, Song S. Adv. Eng. Mater. 2007;9:298–302. [Google Scholar]
- 4.Staiger MP, Pietak AM, Huadmai J, Dias G. Biomaterials. 2006;27:1728–1734. doi: 10.1016/j.biomaterials.2005.10.003. [DOI] [PubMed] [Google Scholar]
- 5.Witte F, Fischer J, Nellesen J, Crostack H-A, Kaese V, Pisch A, Beckmann F, Windhagen H. Biomaterials. 2006;27:1013–1018. doi: 10.1016/j.biomaterials.2005.07.037. [DOI] [PubMed] [Google Scholar]
- 6.Zheng YF, Gu XN, Witte F. Mater. Sci. Eng. R: Rep. 2014;77:1–34. [Google Scholar]
- 7.Yun Y, Dong Z, Lee N, Liu Y, Xue D, Guo X, Kuhlmann J, Doepke A, Halsall HB, Heineman W, Sundaramurthy S, Schulz MJ, Yin Z, Shanov V, Hurd D, Nagy P, Li W, Fox C. Mater. Today. 2009;12:22–32. [Google Scholar]
- 8.Yoshizawa S, Brown A, Barchowsky A, Sfeir C. Connect. Tissue Res. 2014;55:155–159. doi: 10.3109/03008207.2014.923877. [DOI] [PubMed] [Google Scholar]
- 9.Wang J, Giridharan V, Shanov V, Xu Z, Collins B, White L, Jang Y, Sankar J, Huang N, Yun Y. Acta Biomater. 2014;10:5213–5223. doi: 10.1016/j.actbio.2014.08.034. [DOI] [PubMed] [Google Scholar]
- 10.Parithimarkalaignan S, Padmanabhan TV. J. Indian Prosthodont. Soc. 2013;13:2–6. doi: 10.1007/s13191-013-0252-z. [DOI] [PMC free article] [PubMed] [Google Scholar]
- 11.Alvarez K, Nakajima H. Materials. 2009;2:790–832. [Google Scholar]
- 12.Gray JE, Luan B. J. Alloys Compd. 2002;336:88–113. [Google Scholar]
- 13.Kasemo B. Surf. Sci. 2002;500:656–677. [Google Scholar]
- 14.Assender H, Bliznyuk V, Porfyrakis K. Science. 2002;297:973–976. doi: 10.1126/science.1074955. [DOI] [PubMed] [Google Scholar]
- 15.Webster TJ, Ejiofor JU. Biomaterials. 2004;25:4731–4739. doi: 10.1016/j.biomaterials.2003.12.002. [DOI] [PubMed] [Google Scholar]
- 16.Stevens MM, George JH. Science. 2005;310:1135–1138. doi: 10.1126/science.1106587. [DOI] [PubMed] [Google Scholar]
- 17.Lutolf MP, Hubbell JA. Nat. Biotechnol. 2005;23:47–55. doi: 10.1038/nbt1055. [DOI] [PubMed] [Google Scholar]
- 18.Paital SR, Dahotre NB. Biomed. Mater. 2007;2:274–281. doi: 10.1088/1748-6041/2/4/011. [DOI] [PubMed] [Google Scholar]
- 19.Razavi M, Fathi M, Savabi O, Vashaee D, Tayebi L. J. Biomed. Mater. Res. 2015;A103:1798–1808. doi: 10.1002/jbm.a.35324. [DOI] [PubMed] [Google Scholar]
- 20.Farraro KF, Kim KE, Woo SLY, Flowers JR, McCullough MB. J. Biomech. 2014;47:1979–1986. doi: 10.1016/j.jbiomech.2013.12.003. [DOI] [PMC free article] [PubMed] [Google Scholar]
- 21.Razavi M, Fathi M, Savabi O, Vashaee D, Tayebi L. J. Mater. Sci.: Mater. Med. 2015;26:1–7. doi: 10.1007/s10856-015-5514-3. [DOI] [PubMed] [Google Scholar]
- 22.Chaya A, Yoshizawa S, Verdelis K, Myers N, Costello BJ, Chou D-T, Pal S, Maiti S, Kumta PN, Sfeir C. Acta Biomater. 2015;18:262–269. doi: 10.1016/j.actbio.2015.02.010. [DOI] [PubMed] [Google Scholar]
- 23.Jang Y, Tan Z, Jurey C, Collins B, Badve A, Dong Z, Park C, Kim CS, Sankar J, Yun Y. Mater. Sci. Eng. C. 2014;45:45–55. doi: 10.1016/j.msec.2014.08.052. [DOI] [PubMed] [Google Scholar]
- 24.Oliver WC, Pharr GM. J. Mater. Res. 2004;19:3–20. [Google Scholar]
- 25.Curran JA, Clyne TW. Acta Mater. 2006;54:1985–1993. [Google Scholar]
- 26.Wheeler JM, Collier CA, Paillard JM, Curran JA. Surf. Coat. Technol. 2010;204:3399–3409. [Google Scholar]
- 27.Hussein RO, Zhang P, Nie X, Xia Y, Northwood DO. Surf. Coat. Technol. 2011;206:1990–1997. [Google Scholar]
- 28.Yasukawa A, Yokoyama T, Kandori K, Ishikawa T. Colloids Surf. A: Physicochem. Eng. Asp. 2004;238:133–139. [Google Scholar]
- 29.Zhang W, Tian B, Du KQ, Zhang HX, Wang FH. Int. J. Electrochem. Sci. 2011;6:5228–5248. [Google Scholar]
- 30.Ono S, Kijima H, Masuko N. Mater. Trans. 2003;44:539–545. [Google Scholar]
- 31.Yerokhin AL, Nie X, Leyland A, Matthews A, Dowey SJ. Surf. Coat. Technol. 1999;122:73–93. [Google Scholar]
- 32.Gulbrandsen E, Taftø J, Olsen A. Corros. Sci. 1993;34:1423–1440. [Google Scholar]
- 33.Lishi W, Qizhou C, Bokang W, Youwei Y. J. Wuhan Univ. Technol. Mater. Sci. 2007;22:229–233. [Google Scholar]
- 34.Murakami K, Hino M, Hiramatsu M, Nakai K, Kobayashi S, Saijo A, Kanadani T. Mater. Trans. 2007;48:3101–3108. [Google Scholar]
- 35.Liang J, Guo B, Tian J, Liu J, Zhou J, Xu T. Appl. Surf. Sci. 2005;252:345–351. [Google Scholar]
- 36.Srinivasan PB, Liang J, Blawert C, Dietzel W. Appl. Surf. Sci. 2010;256:3265–3273. [Google Scholar]
- 37.Dey A, Rani RU, Thota HK, Sharma AK, Bandyopadhyay P, Mukhopad-hyay AK. Ceram. Int. 2013;39:3313–3320. [Google Scholar]
- 38.Dey RUA, Thota HK, Bandyopadhyay P, Rajendra A, Sharma AK, Mukhopadhyay AK. Surf. Eng. 2014;30:913–919. [Google Scholar]
- 39.Dey RUA, Thota HK, Rajendra A, Sharma AK, Bandyopadhyay P, Mukhopadhyay AK. Surf. Eng. 2014;30:905–912. [Google Scholar]
- 40.Sathiyanarayanan S, Azim SS, Venkatachari G. Appl. Surf. Sci. 2006;253:2113–2117. [Google Scholar]
- 41.Lim C, Lim S, Gupta M. Wear. 2003;255:629–637. [Google Scholar]
Associated Data
This section collects any data citations, data availability statements, or supplementary materials included in this article.


