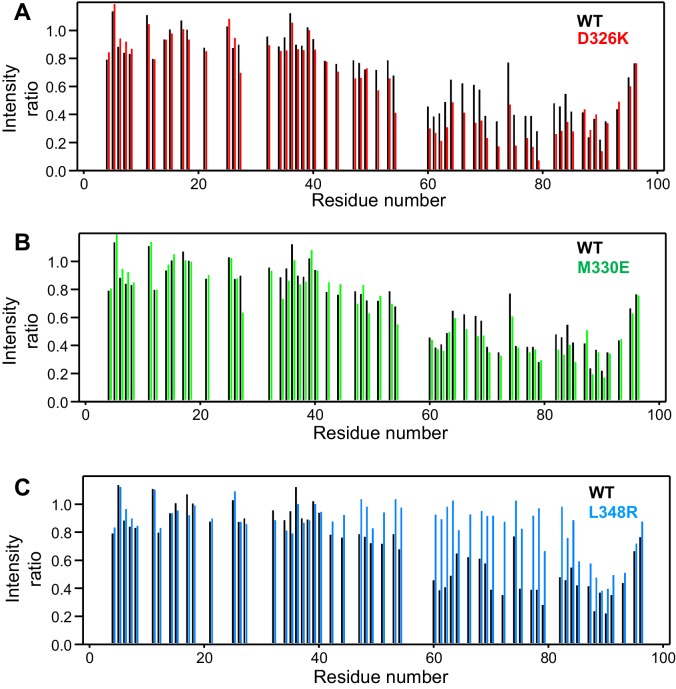
Figure 3. Selective enhancement and disruption of synaptobrevin binding by Munc18-1 mutations.
(A–C) Plots of the ratios of the intensities of the synaptobrevin(1-96) 1H-15N HSQC cross-peaks observed in the presence of WT or mutant Munc18-1 versus those observed in its absence, as a function of residue number. The plots compare the results obtained with WT Munc18-1 (black bars) with those obtained with the D326K (red bars, [A]), M330E (green bars, [B]) or L348R (blue bars, [C]) Munc18-1 mutants. Intensities were measured only for well-resolved cross-peaks. Ratios were calculated from experiments performed with two separate samples and averaged.

