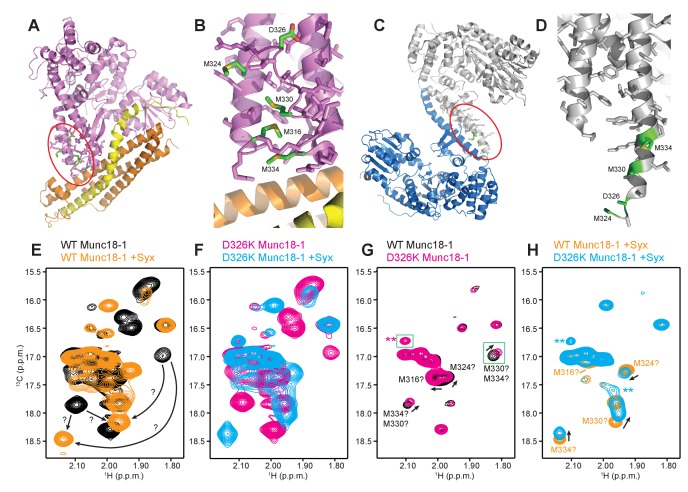
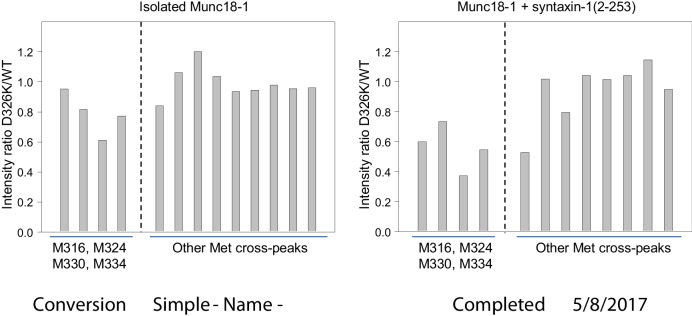
Figure 6. The D326K mutation destabilizes the structure of the Munc18-1 loop.
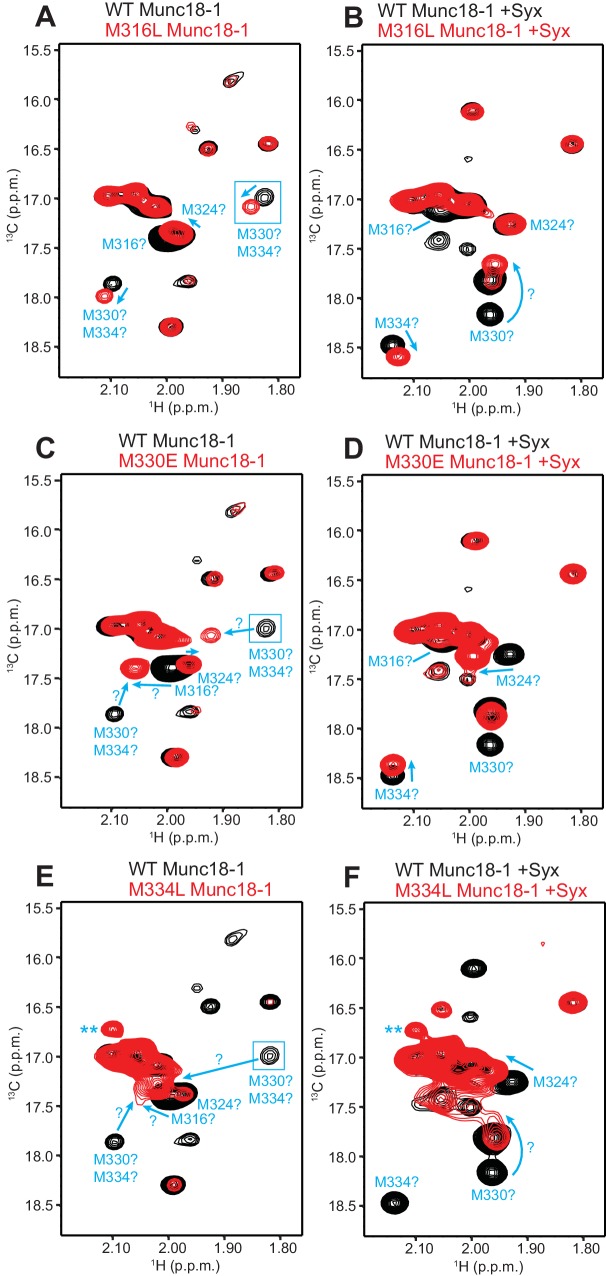
(A) Ribbon diagram of Munc18-1 (violet) bound to syntaxin-1 (SNARE motif in yellow; N-terminal region in orange) (PDB code 3C98) (Burkhardt et al., 2008). The red ellipse shows the location of the loop that connects two helices of domain 3a of Munc18-1. (B) Close-up view of the domain 3a loop region from panel A. Side chains from the loop and the two helices are shown as stick models, and the atoms of the side chains from D326, M316, M324, M330 and M334 are color-coded (carbon green; oxygen red; sulfur yellow). The diagram illustrates that these side chains are well packed within the furled structure of the loop, although they have different degrees of solvent accessibility. (C) Ribbon diagram showing the dimeric structure observed in the crystals of Munc18-1 bound to a syntaxin-4 N-terminal peptide (not shown) (PDB code 3PUJ) (Hu et al., 2011). One Munc18-1 molecules is shown in gray and the other in blue. Note that dimerization involves the two domain 3a helices but the loop is at the end of the dimerization interface. The red ellipse shows the location of the loop for the gray molecule. (D) Close-up view of the loop in the gray Munc18-1 molecule of panel C. Atoms from the loop and the two helices are shown as stick models, and the atoms observed for M324, D326, M330 and M334 are color-coded (carbon green; oxygen red; sulfur yellow). Note that residues 315–323, as well as the side chains of M324, D326 and M330, were not observable, probably because they are not packed against other regions of Munc18-1 and they are thus dynamic. (E) Expansions from the methionine methyl region of 1H-13C HMQC spectra of WT 50%-2H-ILMV-13CH3-Munc18-1 free (black contours) and bound to syntaxin-1 (2–253) (orange contours). The arrows indicate potential shifts caused by syntaxin-1 (2–253) binding on the cross-peaks tentatively assigned to M330 and M334 (Figure 6—figure supplement 2). (F) Expansions from the methionine methyl region of 1H-13C HMQC spectra of D326K 50%-2H-ILMV-13CH3-Munc18-1 free (magenta contours) and bound to syntaxin-1 (2–253) (cyan contours). (G,H) Expansions of the 1H-13C HMQC spectra shown in panels E, F but superimposing the spectra of WT and D326K 50%-2H-ILMV-13CH3-Munc18-1 in isolation (G) or bound to syntaxin-1 (2–253) (H). The spectra were plotted at higher contour levels to emphasize the spectral changes induced by the D326K mutation. Arrows indicate cross-peak shifts. Cross-peaks are labeled with residue assignments based on spectra acquired on methionine mutants (Figure 6—figure supplement 2); the ? symbols after the residue numbers indicate the tentative nature of the assignments. Green boxes indicate regions of the spectra that were plotted at lower levels to show weak cross-peaks. New cross-peaks caused by the D326K mutation are indicated by **.
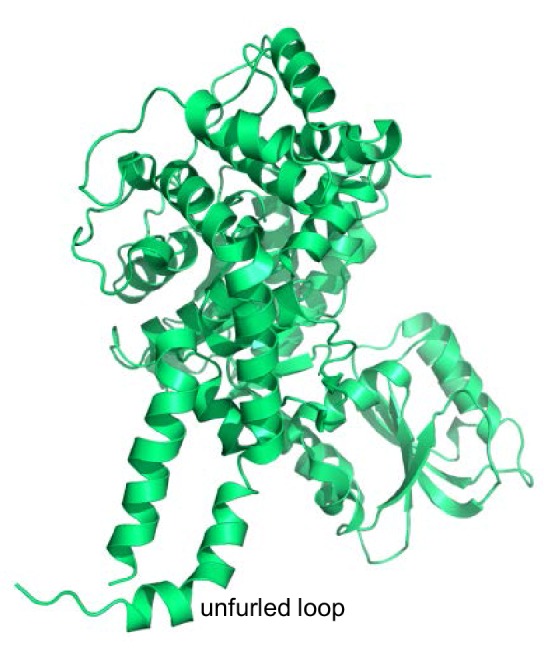
Figure 6—figure supplement 1. Structure of squid Munc18-1.


