Supplemental digital content is available in the text.
Abstract
Background
Previous analyses of the United States transplant database regarding long-term outcomes in kidney transplantation have shown minimal improvement in the rate of long-term graft loss. This study sought to analyze intermediate-term outcomes and graft function at 6 months in kidney transplantation in adult living and deceased donor recipients in the last decade.
Methods
Survival analysis was performed based on the year of transplant between 6 months and 3 years’ posttransplant. The Chronic Kidney Disease Epidemiology Collaboration estimated glomerular filtration rate (eGFR) was determined at 6 months.
Results
The unadjusted graft survival between 6 months and 3 years improved significantly in the latter half of the decade in both deceased and living donor kidney recipients. Cox analysis showed a 33% reduction in the rate of graft loss and that the improvement in graft survival was due to similar improvements in both death-censored graft and death with graft function survival. A 10% improvement in median eGFR occurred despite worsening donor demographics over time in both donor types. This improvement in eGFR and graft survival occurred in association with a consolidation of chronic discharge immunosuppression from a variety of combinations to over 85% of recipients receiving tacrolimus and mycophenolate derivative immunosuppression.
Conclusions
In the latter half of last decade graft survival improved in adult kidney transplant recipients. The improvement in graft survival occurred in temporal association with an improvement in median eGFR at 6 months and consolidation of discharge immunosuppression in most patients to tacrolimus and mycophenolate derivatives.
Analyses of the United States kidney transplant database regarding long-term outcomes has previously shown minimal improvement in the long-term rate of graft loss despite very marked improvements in both the rate of early rejection and graft loss.1,2 In the mid-1990s, there was a large drop in the acute rejection rate with the introduction of mycophenolate mofetil, tacrolimus (TAC) and new induction regimens but little improvement in long-term graft outcomes.2,3 The drop in the rejection rate was projected to improve long-term graft outcomes but analysis of actual graft outcomes during that period showed much more modest improvements than projected.2,4 A more recent analysis of long-term graft outcomes showed that the majority of improvement in graft survival has been due to improvements in graft survival in the first year after transplant looking at transplant data up to the mid 2000s.1 Several hypotheses have been proffered to explain this lack of improvement including the long-term nephrotoxicity of calcineurin inhibitors (CNI), the worsening of cardiac risk factors due to immunosuppression side effects, increased risks of malignancy mortality, and the emergence of BK nephropathy with higher intensity immunosuppression. This study sought to understand the trends in outcomes of both living and deceased donor patients transplanted in the last decade (2000-2010). The main outcomes of interest were graft and patient survival after transplant between 6 months and 3 years and glomerular filtration rate (GFR) achieved in the first 6 months after transplant calculated using the Chronic Kidney Disease Epidemiology Collaboration (CKD EPI) equation in both these populations of recipients.5
MATERIALS AND METHODS
All adult patients transplanted with either a deceased or living donor kidney transplant alone between January 1, 2000, and December 31, 2010, who had at least 6 months of graft survival recorded in the Scientific Registry of Transplant Recipients (SRTR) database were included in the analysis. Characteristics of the patients and donors were ascertained from the database and included the Kidney Donor Profile Index (KDPI) based on the 2013 KDPI categories for deceased donors, donor age, race/ethnicity, sex for living donors, recipient age, race/ethnicity, sex, cause of end-stage renal disease (ESRD), HLA mismatch for deceased donors, HLA identical recipients for living donors defined as sibling donors with a zero HLA mismatch, history of delayed graft function based on the need for dialysis in the first week, acute rejection in the first 6 months, duration of dialysis before transplant, retransplants, pediatric en bloc transplants in deceased donors and panel-reactive antibodies (PRA). Discharge immunosuppression was also determined. The major combinations include cyclosporine (CSA), any formulation, and mycophenolate acid (MPA) derivatives either mycophenolate sodium or mycophenolate mofetil; TAC, any formulation, and MPA; CNI, either TAC or CSA and mammalian target of rapamycin (mTOR) either sirolimus or everolimus; CNI and azathioprine (AZA); or other combinations. Steroid maintenance was also determined separately. Death censored, death with graft function, and overall graft, and patient survival were determined for both living and deceased donor transplants based on the year of transplant using the Kaplan Meier method. Statistical significance was determined with log rank testing. The data set had outcomes up until August 31, 2013 (date of compilation of data set by SRTR). Since the 2010 recipients had only 3 years of follow-up, the graft and patient survival analysis compared the interval for both transplant types between 6 months and 3 years over the decade. For the patient survival analysis, deaths recorded in the Social Security Master Death File (SSMDF) were included. Patients who were lost to follow-up before 3 years but were not on the SSMDF were considered alive as of the last follow-up date on the data set August 31, 2013, to reduce the effect of ascertainment bias associated with using SSMDF information.
To account for the changes in the demographics of patients and donors during this period, Cox proportional analysis was carried out based on a limited set of characteristics that were not the result of changes in allocation, chronic immunosuppression, or induction therapy. For instance, HLA matching in the deceased donor recipients worsened over the decade due to changes in the allocation point system for HLA matching and the abandonment of the zero mismatch program for unsensitized candidates. Therefore, no adjustment was made for these changes. The covariates used in the model included for deceased donors the KDPI of donor, recipient age, race/ethnicity and sex, cause of ESRD, pediatric en bloc transplant, duration of dialysis before transplant and retransplantation. For living donor recipient, just the donor age, race/ethnicity and sex, recipient age, race/ethnicity and sex, cause of ESRD, duration of dialysis before transplant, retransplantation, and HLA identical versus non-HLA identical living donor transplant were included in the model. With the exception of duration of dialysis, there were no missing data. Approximately 2% of non-preemptively transplanted cases lacked a dialysis start date. To account for the missing data multiple imputation method was used in the analysis. Finally, PRA was not considered in the model because a change in the calculation of PRA occurred during the decade and a significant number of candidates had missing data.
To see if graft function at 6 months was improving, all recipients with 6 months of graft survival and a creatinine at 6 months follow-up recorded in the database were ascertained. Approximately 5% of candidates did not have a 6 month creatinine in the data set during the decade. Estimated GFR (eGFR) was determined using the CKD EPI equation using the 6 month posttransplant creatinine, age at transplant, sex and race of the recipient (black or other).5 Median eGFR was determined based on year of transplant for both living and deceased donor recipients. The median eGFR was also adjusted for the change in KDPI in deceased donors and donor age and sex in living donors over the decade. There is a very linear relationship between KDPI in deceased donors and donor age in living donors and median eGFR. The slopes of these lines as determined by linear regression were used in the adjustment as was sex in living donors since the percent female donors increased over the decade. Because median KDPI and donor age increased during the decade, this was used to account for this change in donor characteristics.
Statistical analysis was performed using SPSS statistical software version 22 (IBM, Armonk, NY). Because the impact of recipient age on long-term graft survival was U-shaped, recipient age was categorically defined by 5-year increments in the Cox analysis to account for this behavior.
This study used data from the SRTR. The SRTR data system includes data on all donor, waitlisted candidates, and transplant recipients in the United States, submitted by the members of the Organ Procurement and Transplantation Network. The Health Resources and Services Administration, US Department of Health and Human Services provides oversight to the activities of the Organ Procurement and Transplantation Network and SRTR contractors.
RESULTS
Between 2000 and 2010, 97 294 adult recipients of deceased donor and 64 483 living donor recipients were identified that were kidney transplant alone recipients. Seven thousand seven hundred ninety-eight deceased donor and 2767 living donor recipient grafts failed or were lost to follow-up in the first 6 months, leaving a study population of 89 496 deceased donor and 61 716 living donor recipients, respectively, for the graft and patient survival analyses. Of these cohorts, 85 215 deceased donor and 58 395 living donor recipients (missing 4.8% and 5.4% of recipients, respectively) had a creatinine at 6 months recorded and were used for the analysis graft function.
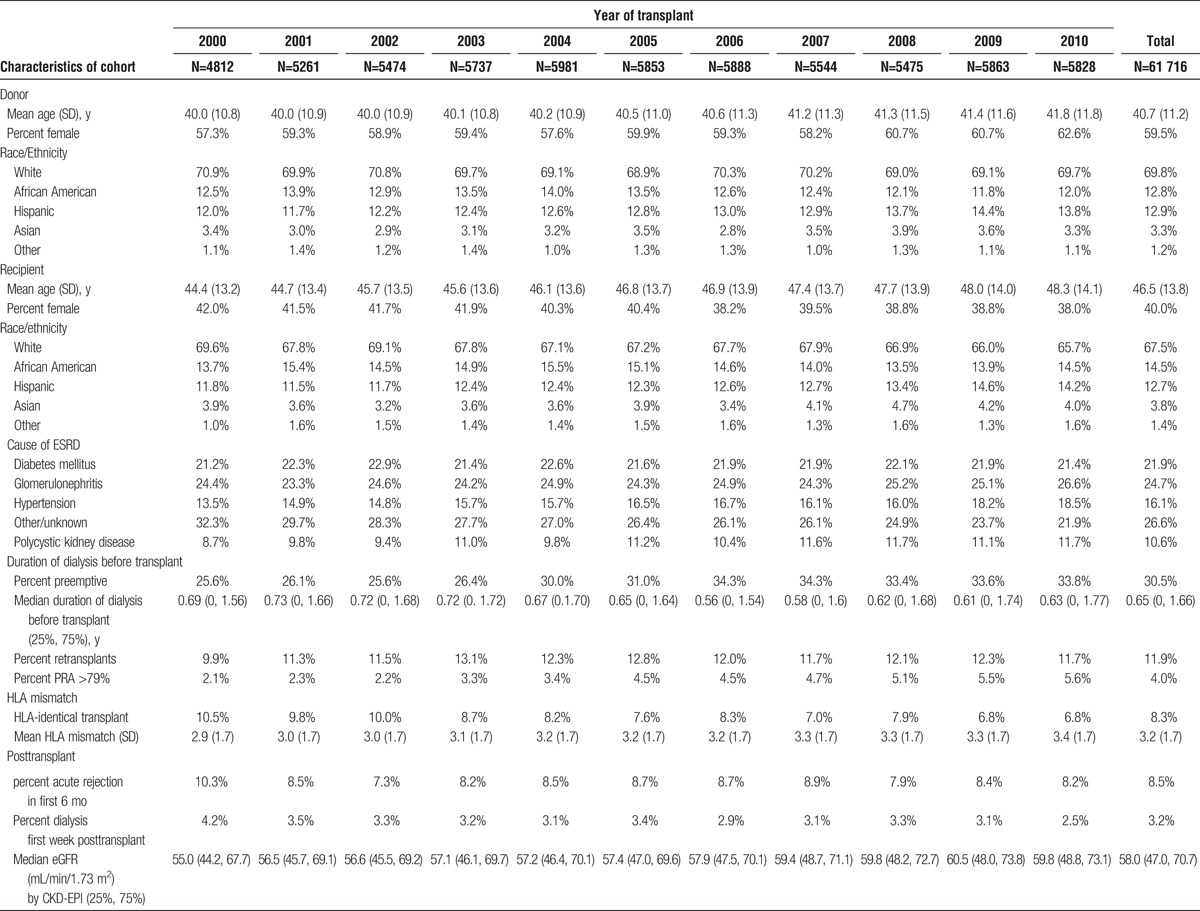
The characteristics of the living and deceased donor study populations are shown in Tables 1 and 2. The following characteristics of the deceased donor population increased over the decade: KDPI of the donors, recipient age, the percent of minority recipients, recipients with cause of ESRD of diabetes mellitus or hypertension, the median dialysis time, high PRA recipients, and the percentage of candidates with delayed graft function. The percentage of preemptive transplants among deceased donors initially increased but in the latter half of the decade began to decrease. There was very little change in the sex of recipients, number of retransplants, pediatric en bloc transplants, and acute rejection rate in the first 6 months posttransplant. HLA mismatch increased and the number of zero HLA mismatch recipients decreased. The characteristics of the living donor recipients changed less dramatically over the period. There was a small increase in the percentage of female donors, and age of donors and recipients. The percentage of preemptive transplants increased as did the recipients with high PRAs and retransplants. HLA-identical recipients decreased over the decade. The remainder of characteristics was relatively stable over the period.
TABLE 1.
Characteristics of deceased donor kidney transplant recipients with at least 6 mo of graft survival
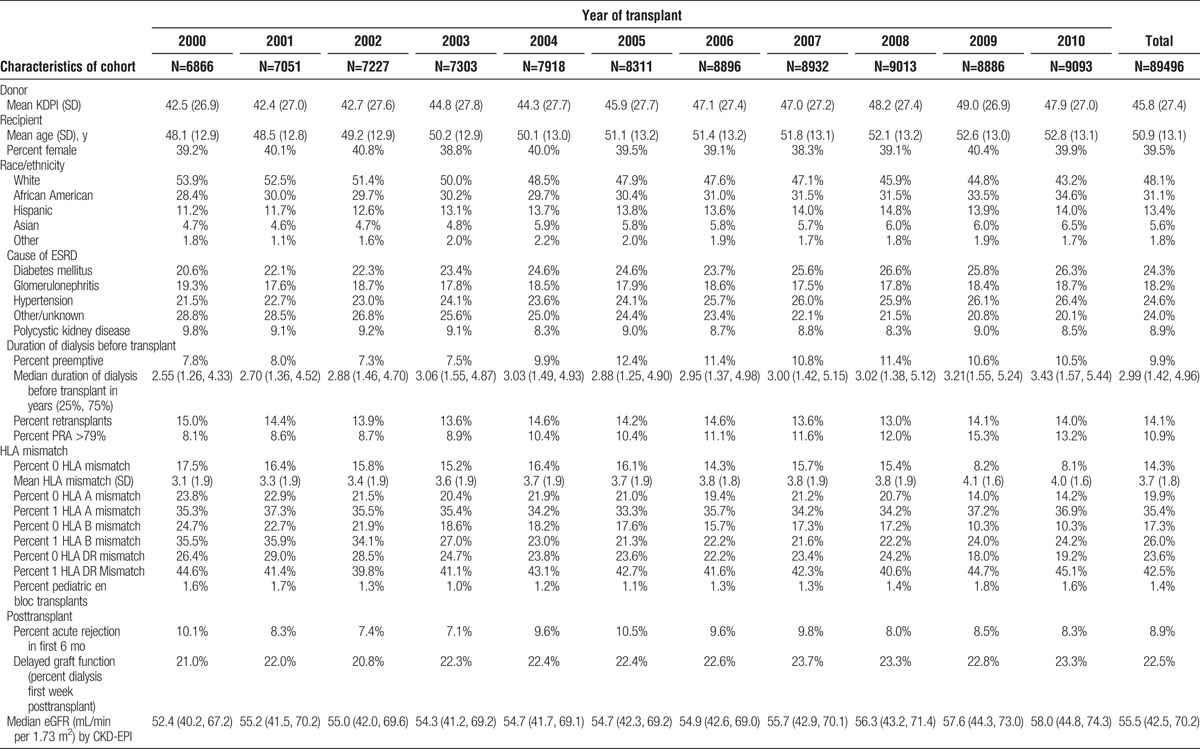
TABLE 2.
Characteristics of living donor kidney transplant recipients with at least 6 mo of graft survival
In both the deceased and living donor recipients the median eGFR at 6 months improved significantly for the populations, an increase of 5.6 and 4.8 mL/min per 1.73 m2 for deceased and living donor recipients, respectively, over the decade (Figure 1). A downward shift in CKD stage was seen with more recipients achieving a CKD stage of 3a or less in the more recent transplants in both deceased and living donor recipients (Figure 2). The improvement in the unadjusted eGFR at 6 months for living donor recipients was steady throughout the decade, whereas it occurred in the latter half of the decade for deceased donor recipients. The unadjusted median eGFR based on KDPI of deceased donors and donor age in living donors comparing the biennium of 2000 to 2001 with 2009 to 2010 showed a 10% improvement in the median eGFR at every level of KDPI in deceased donors and donor age in living donors (Figure 3).
FIGURE 1.
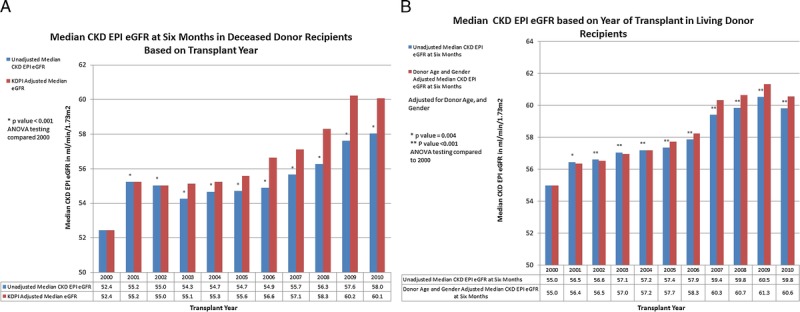
A, Median CKD EPI eGFR at 6 months of deceased donor recipients by year of transplant. B, Median CKD EPI eGFR at 6 months post-living donor transplant by year of transplant. The equations for adjusted Median eGFR20XX = Median eGFR20XX + ((Median KDPI2000 − Median KDPI20XX) × slope of the regression line for KDPI and Median eGFR) for deceased donors and the adjusted Median eGFR20XX = Median eGFR20XX + ((Median Donor Age2000 − Median Donor Age20XX) × slope of the regression line for donor age and Median eGFR) + ((Percent Donor Male20XX − Percent Donor Male2000) × regression value for eGFR difference with Male Donor) for living donors.
FIGURE 2.
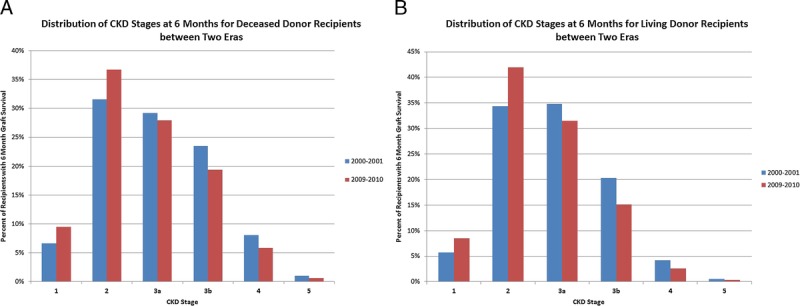
Unadjusted distribution of CKD stage at 6 months in the Biennium of 2000–2001 and 2009–2010. A, Deceased donor recipients. B, Living donor recipients.
FIGURE 3.
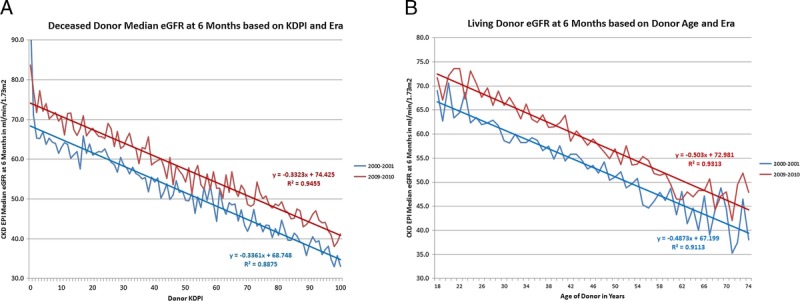
Unadjusted median eGFR at 6 months based on KDPI in deceased donors and donor age in living donors based on 2 bienniums 2000 to 2001 and 2009 to 2010 with the regression line for each era. A, Deceased donors. B, Living donors.
The Kaplan Meier plots of graft survival are seen in Figure 4. In the latter half of the decade both living and deceased donor kidney transplant recipients saw a highly significant improvement in unadjusted graft survival. In the deceased donor population this was seen despite increasing donor KDPI and recipient age. Cox regression adjusting confirmed about a 33% reduction in the graft loss rate (Tables 3 and 4). The overall improvement in graft survival was due to improvements in both the death censored graft survival and graft failure due to death in both living and deceased donor recipients (Tables 3 and 4). Cox analysis also showed the patient survival for both living and deceased donor transplant recipients improved during the decade (Tables 3 and 4).
FIGURE 4.
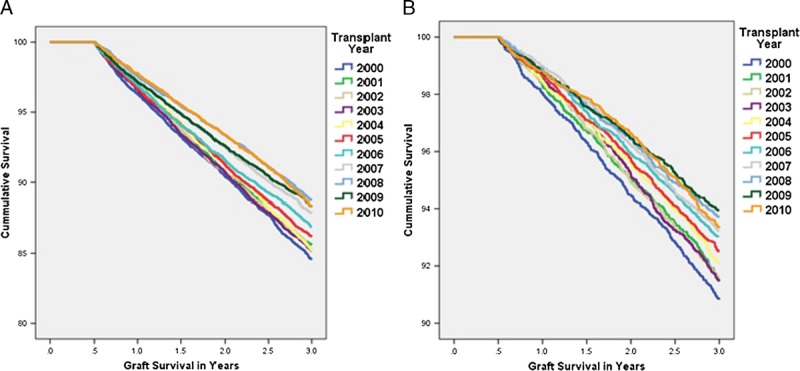
Kaplan-Meier unadjusted graft survival by year of transplant for living and deceased donor kidney transplant recipients. A, Deceased donor recipients. B, Living donor recipients. A, Log rank testing revealed a P value of 0.006 for 2005 compared with 2000. 2006 onward the P value was less than 0.001. Before 2005, P values were greater than 0.05. B, Log rank testing revealed a P value of 0.019 for 2004 and 0.002 for 2005 compared with 2000. 2006 onward, the P value was less than 0.001. Before 2004, P values were greater than 0.05.
TABLE 3.
Cox analysis of graft, death censored graft, death with function graft, and patient survival for deceased donor recipients from 6 mo to 3 y

TABLE 4.
Cox analysis of graft, death-censored graft, death with function graft, and patient survival for living donor recipients from 6 mo to 3 y

The discharge immunosuppression over the period for both the living and deceased donor cohorts showed a consolidation of discharge immunosuppression from a variety of combinations in 2000 to over 85% of recipients receiving TAC and MPA derivatives in 2010 (Figure 5). Switching of immunosuppression between discharge and 6 months follow-up revealed that TAC and MPA derivative treated recipients were the most likely to remain on their discharge immunosuppression at 6 months (Table S1 and S2, SDC, http://links.lww.com/TXD/A41).
FIGURE 5.
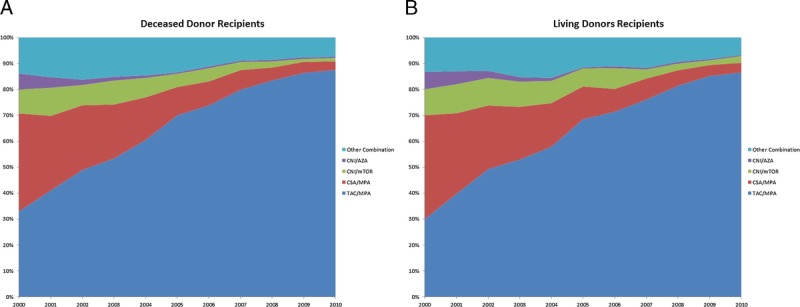
Discharge immunosuppression of recipients with 6 months of graft survival. A, Deceased donor recipients. B, Living donor recipients. CNI, either CSA or tacrolimus; mTOR, either sirolimus or everolimus, CSA, any formulation; TAC, any formulation); and MPA, either mycophenolate mofetil or mycophenolate sodium.
Because of the potential drift of creatinine measures over time, the adjusted eGFR of the three most prevalent immunosuppression types was compared by year of transplant. (Figure S1, SDC, http://links.lww.com/TXD/A41). This confirmed that for every year tested TAC and MPA derivative treated patients achieved a higher eGFR at 6 months than the other combinations. Linear regression analysis of both living and deceased donor recipients revealed that TAC and MPA derivative treated patients achieved on average a 5-mL/min per 1.73 m2 improvement in eGFR than the next most prevalent combination of CSA and MPA derivative treated patients (Table S3 and S4, SDC, http://links.lww.com/TXD/A41).
DISCUSSION
This analysis shows that in the latter half of last decade unadjusted graft survivals between 6 months and 3 years for adult kidney transplant recipients improved. This improvement occurred despite worsening demographics of donors and recipients with regard to risk of graft failure. The adjusted graft survival improved with a reduction in graft failure of about 33% for both living and deceased donor recipients. Associated with this improvement in graft outcomes was an improvement in eGFR at 6 months over the decade of about 8% to 10% with higher percentage of recipients achieving CKD stage 3a or lower despite increasing donor KDPI in deceased donors and donor age in living donors. This improvement in both eGFR and graft survival occurred in temporal association with a consolidation of immunosuppressive practices in the United States to predominantly TAC and MPA for discharge immunosuppression.
There are a number of weaknesses with the study. First, in the latter half to the last decade efforts in laboratory medicine were undertaken to improve the standardization of creatinine measures across laboratories in the United States to improve the accuracy of eGFR determinations which may have impacted eGFR calculations in this study. Small decreases in the creatinine measure, especially at lower creatinine levels, lead to significant increases in the eGFR. The call for recalibration of serum creatinine in the United States began in 2006 with the publication of a consensus document and probably lagged several years behind this publication.6 By 2011, almost all of the vendors of automated analytic machines added correction factors to improve accuracy, but it is not known what percentage of laboratories in the United States incorporated these correction factors in their creatinine measures.7 The overall effect on creatinine in laboratories that have recalibrated their assays showed a downward trend creatinine measures.7 This analysis indicates that at least half of the improvement in eGFR was due to changes in maintenance immunosuppression; however, some of the apparent improvement could be due to changes in the calibration of creatinine measures in the latter half of the decade.
There are a number are limitations to creatinine based estimates of GFR. In the studies of GFR estimation equations in kidney transplantation, the CKD EPI equation in general performed the best but the level of precision remains less than optimal between the equations and measured GFR.8-10 That being said, the errors introduced by the use of the CKD EPI equation are systematic and should affect all groups equally and not change the conclusions of the study.
Second, our data only compared the outcomes from 6 months to 3 years. This improvement in intermediate- graft outcomes may not be sustained and the projected half-lives may be overestimated. Graft survival based on recipient age is very linear between 6 months and 7 years but whether this trend is sustained beyond that or drops off over time is not clear. Therefore, projections of graft survival half-lives are just projections and may not be realized as these cohorts are followed in real time. Previous projections of graft survival in earlier studies proved to be overestimated.2,4
A third issue that could confound the results is the 2009 and 2010 cohorts of patients have higher rates of censoring of data between 6 months and 3 years. With longer follow-up of these cohorts, ascertainment of the censored cases will improve. If the censored cases have a higher rate of graft failure than in the cases with data that may influence this apparent improvement. On the other hand, data from 2008, which has the same percentage of censoring as earlier years, demonstrated the same amount of improvement as seen in 2009 and 2010, and ascertainment bias typically favors events (ie, graft losses and deaths are more likely to be known than continued graft and patient survivals).
Finally, we assessed only discharge immunosuppression, and many patients do change immunosuppression due to side effects and lack of efficacy. This study did not assess the amount of switching of immunosuppression regimens over time so conclusions regarding the long-term efficacy of one immunosuppressive regimen over another must be interpreted in that light. In an earlier study of longitudinal immunosuppression use in the US population, switching immunosuppression was common but it was more common to switch from CSA or mTOR inhibitor to TAC during that era than the reverse, and patients treated with TAC and MPA derivatives were the most likely to remain on their discharge regimen over time.11 This was true for this study as well.
If this improvement in both graft function and survival is correct, than it does indicate that our current standard of care for renal transplant recipients is improving intermediate outcomes. The most dramatic measured change in care of renal transplant recipients has been the consolidation of immunosuppression to TAC and MPA immunosuppression from a variety of other combinations. How the change in immunosuppression use may have resulted in this improvement is likely multifactorial in etiology, not necessarily directly related to immunosuppression, and cannot be directly answered by this analysis. There are a number of possibilities including the impact of improved GFR on both long-term patient and graft survival, better immunosuppression afforded with TAC and MPA combination, possible differences in nephrotoxicity of TAC and CSA, less impact of TAC and MPA on cardiovascular risk factors, the abandonment over the decade of the mTOR and CNI combination, pharmacokinetic and dosing differences between TAC and CSA, better overall care of recipients after transplant irrespective of immunosuppression, and better management of BK and CMV infections over time.
Numerous studies in kidney transplantation have shown that early achieved GFR is an important determinant in graft and patient survival.12-15 The shift downward in CKD stage at 6 months after transplant is likely one factor improving graft and patient outcomes seen in the last decade.
TAC and MPA combination may better control immune mediated graft injury. The Symphony trial clearly showed that the rejection rate was lowest and renal function achieved in the population was best in the TAC and MPA derivative arm.16,17 There is also evidence from other studies that TAC- and MPA-treated recipients have much lower rates of more subtle graft inflammation due to subclinical rejection, a risk factor for poorer long-term graft survival, than CSA and MPA derivative-treated patients.18-22
The presumption that nephrotoxicity of TAC and CSA are similar may not be true. Consistent with our findings regarding graft function, a paired analysis of deceased donors with discordant treatment of the recipients with microemulsion CSA and MPA and TAC and MPA showed that at all time points the renal function was better in the latter group.23 Other side effects, although similar among CNIs, do vary in prevalence and intensity depending on the agent used, and this could be true for nephrotoxicity as well. Differences in pharmacokinetics of CSA and TAC may also be a factor. TAC has less intraindividual variability than CSA, and for drugs with narrow therapeutic windows this potentially limits episodes of under and overimmunosuppression that can lead to either immunologic damage to the graft or enhance nephrotoxicity, respectively, leading to graft injury.24
Between the mid 1990s and the early 2000s, United States registry data showed a significant amount of experimentation with immunosuppression combinations by centers.25 During the decade evidence emerged that the CNI and mTOR combination had poorer graft outcomes, and clinical trials have shown the CNI dosing must be reduced with mTOR inhibitors if similar graft function is to be achieved as standard dose CNI- and MPA-treated candidates.26-30 The abandonment of this combination as a major treatment option could be contributing to the improve graft function and graft outcomes achieved in the latter half of the decade.
Another factor may be the superior cardiovascular risk profile and lower blood pressures seen in TAC and MPA derivative–treated patients. The analysis of the Symphony trial data reveal that blood pressure and lipid levels were lowest in the TAC and MPA derivative–treated arm, whereas the absolute incidence of posttransplant diabetes mellitus was only slightly higher in TAC arm and use of hypoglycemic agents were similar in all 4 arms.31
Another insight from the Symphony trial was the recognition that lower target levels for TAC dosing resulted in a very low rejection rate with excellent 1- and 3-year graft outcomes.16,17 The recognition probably has led to reductions in TAC dosing targets that may have decreased long-term nephrotoxicity and possibly improve long-term outcomes. A Symphony study analysis showed that a dose-dependent relationship between renal function and TAC trough levels existed.32,33
Another possibility is that the overall care of kidney transplant recipients is improving. Greater attention to cardiovascular risk management and blood pressure control may have contributed to the improvement. In the general population of the United States, the age-adjusted risk of death from cardiovascular disease fell and ambulatory blood pressure control has improved throughout the last decade.34-36
Finally, advances in the management and treatment of BK and CMV infections over the decade may be an important factor in the improvement. The TAC and MPA combination is a very potent immunosuppressive regimen, and the transition to this combination is an important cause of the emergence of BK nephropathy as a significant cause of graft loss.37 The problem of BK has been mitigated in part by recognition that monitoring for infection and lowering immunosuppression to prevent or treat BK nephropathy lowers the risk of graft damage and failure.38-41 Similarly, CMV infection has been associated with poorer graft outcomes, acute rejection, and the development of chronic graft damage.42 In 2003, the Food and Drug Administration approved oral valganciclovir for prophylaxis of CMV infections in transplantation. The widespread availability of oral valganciclovir for prevention of CMV infection has reduced serious symptomatic infection and possibly reduced injury to grafts. Although recent analysis of the United States registry data indicates a persistent impact of donor and recipient CMV mismatching on graft survival, analysis of in the United Kingdom showed no impact of CMV mismatching on long-term outcomes in the era of valganciclovir.43,44
Most kidney transplant recipients in the United States are now discharged on the TAC and MPA combination. Clearly, this is in part driven by the ease of use and favorable side effect profile of this combination, but it also reflects a perception by the transplant community that this combination is better than other available combinations. The last time 1 combination of immunosuppression had this large a market share of the kidney transplant population in the United States was in the early 1990s before the emergence of second generation immunosuppressive agents when CSA and azathioprine was the dominant and only combination available. With the exception of belatacept, there are no new classes of chronic immunosuppression on the immediate horizon. As more experience with TAC and MPA combination has accrued and some of the problems associated with higher intensity immunosuppression have been addressed it appears that graft outcomes improved. Belatacept, which has no nephrotoxicity, may prove to be a better long-term drug for patients that are amenable to this treatment.45 Unfortunately, the belatacept trials used CSA and MPA for the comparison arm, and our data clearly shows that TAC- and MPA-treated patients have about 10% higher GFRs at 6 months. As a result, the benefits of belatacept over the current standard of care may be more difficult to prove because the differences in GFR will likely be smaller.
TAC remains the most potent CNI and the most potent current chronic immunosuppressive agent to prevent early cellular rejection in kidney transplant populations. CNI-free combinations using mTOR inhibitors and MPA derivatives and belatacept and MPA derivatives are associated with higher early rejection rates.16,46,47 Very few studies have examined the effect of these agents on rates of subclinical inflammation in the graft, and comparative studies looking at differences in control of the humoral response are only available for belatacept compared to CSA. Graft survival is dependent on control of the innate, humoral, and cellular immune response to the allograft as well as the consequences of drug nephrotoxicity and side effects that impact mortality risk. The use of less potent nonnephrotoxic agents may avoid nephrotoxicity but at the expense of poorer control of the immune response and not result in improved long-term graft outcomes in a population. The long-term outcomes of the Benefit-Ext trial may be an example of this problem.48 Despite a very large difference in GFR between the belatacept and CSA treated groups, no difference in graft survival was seen in this study after 7 years. Similarly, the DeKAF study showed that recipients with chronic graft injury deemed primarily due to CNI toxicity actually had better long-term outcomes than other causes of chronic graft injury suggesting that inadequate immunosuppression may be more pernicious to the graft than pure nephrotoxicity.49 The data from this study indicate that widespread adoption of TAC and MPA combination by most transplant recipients in the last decade was temporally associated with a measurable improvement in intermediate patient and graft outcomes in adult patients transplanted in the United States despite the use of poorer quality grafts in deceased donors and an aging of the population receiving transplants. Despite TAC and MPAs short comings, until there is clear evidence that other combinations outperform TAC and MPA, this combination should remain the standard of care in renal transplantation and should be the standard to which we compare any new immunosuppressive regimens.
Supplementary Material
Footnotes
Published online 25 May, 2017.
The authors declare funding or no conflicts of interest.
Disclosures: The data reported here have been supplied by the Minneapolis Medical Research Foundation as the contractor for the SRTR. The interpretation and reporting of these data are the responsibility of the author(s) and in no way should be seen as an official policy of or interpretation by the SRTR or the U.S. Government.
D.S. participated in the research design, statistical analysis, and interpretation of results, writing and editing the article. G.V. participated in research design, interpretation of results, writing and editing the article. A.N.-L. participated in research design, interpretation of results, writing and editing the article.
Supplemental digital content (SDC) is available for this article. Direct URL citations appear in the printed text, and links to the digital files are provided in the HTML text of this article on the journal’s Web site (www.transplantationdirect.com).
REFERENCES
- 1.Lamb KE, Lodhi S, Meier-Kriesche HU. Long-term renal allograft survival in the United States: a critical reappraisal. Am J Transplant. 2011;11:450–462. [DOI] [PubMed] [Google Scholar]
- 2.Meier-Kriesche HU, Schold JD, Srinivas TR, et al. Lack of improvement in renal allograft survival despite a marked decrease in acute rejection rates over the most recent era. Am J Transplant. 2004;4:378–383. [DOI] [PubMed] [Google Scholar]
- 3.Keith DS, DeMattos A, Golconda M, et al. Factors associated with improvement in deceased donor renal allograft function in the 1990s. J Am Soc Nephrol. 2005;16:1512–1521. [DOI] [PubMed] [Google Scholar]
- 4.Hariharan S, Johnson CP, Bresnahan BA, et al. Improved graft survival after renal transplantation in the United States, 1988 to 1996. N Engl J Med. 2000;342:605–612. [DOI] [PubMed] [Google Scholar]
- 5.Levey AS, Stevens LA, Schmid CH, et al. A new equation to estimate glomerular filtration rate. Ann Intern Med. 2009;150:604–612. [DOI] [PMC free article] [PubMed] [Google Scholar]
- 6.Myers GL, Miller WG, Coresh J, et al. Recommendations for improving serum creatinine measurement: a report from the laboratory working group of the National Kidney Disease education program. Clin Chem. 2006;52:5–18. [DOI] [PubMed] [Google Scholar]
- 7.Killeen AA, Ashwood ER, Ventura CB, et al. Recent trends in performance and current state of creatinine assays. Arch Pathol Lab Med. 2013;137:496–502. [DOI] [PubMed] [Google Scholar]
- 8.Choi HY, Joo DJ, Song MK, et al. The power of renal function estimation equations for predicting long-term kidney graft survival: a retrospective comparison of the chronic kidney disease epidemiology collaboration and the modification of diet in renal disease study equations. Medicine (Baltimore). 2016;95:e2682. [DOI] [PMC free article] [PubMed] [Google Scholar]
- 9.Shaffi K, Uhlig K, Perrone RD, et al. Performance of creatinine-based GFR estimating equations in solid-organ transplant recipients. Am J Kidney Dis. 2014;63:1007–1018. [DOI] [PMC free article] [PubMed] [Google Scholar]
- 10.White CA, Akbari A, Doucette S, et al. Estimating glomerular filtration rate in kidney transplantation: is the new chronic kidney disease epidemiology collaboration equation any better? Clin Chem. 2010;56:474–477. [DOI] [PubMed] [Google Scholar]
- 11.Meier-Kriesche HU, Chu AH, David KM, et al. Switching immunosuppression medications after renal transplantation—a common practice. Nephrol Dial Transplant. 2006;21:2256–2262. [DOI] [PubMed] [Google Scholar]
- 12.Kasiske BL, Israni AK, Snyder JJ, et al. The relationship between kidney function and long-term graft survival after kidney transplant. Am J Kidney Dis. 2011;57:466–475. [DOI] [PubMed] [Google Scholar]
- 13.Hariharan S, McBride MA, Cherikh WS, et al. Post-transplant renal function in the first year predicts long-term kidney transplant survival. Kidney Int. 2002;62:311–318. [DOI] [PubMed] [Google Scholar]
- 14.Abbott KC, Yuan CM, Taylor AJ, et al. Early renal insufficiency and hospitalized heart disease after renal transplantation in the era of modern immunosuppression. J Am Soc Nephrol. 2003;14:2358–2365. [DOI] [PubMed] [Google Scholar]
- 15.Weiner DE, Carpenter MA, Levey AS, et al. Kidney function and risk of cardiovascular disease and mortality in kidney transplant recipients: The FAVORIT trial. Am J Transplant. 2012;12:2437–2445. [DOI] [PMC free article] [PubMed] [Google Scholar]
- 16.Ekberg H, Tedesco-Silva H, Demirbas A, et al. Reduced exposure to calcineurin inhibitors in renal transplantation. N Engl J Med. 2007;357:2562–2575. [DOI] [PubMed] [Google Scholar]
- 17.Ekberg H, Bernasconi C, Tedesco-Silva H, et al. Calcineurin inhibitor minimization in the symphony study: observational results 3 years after transplantation. Am J Transplant. 2009;9:1876–1885. [DOI] [PubMed] [Google Scholar]
- 18.Nickerson P, Jeffery J, Gough J, et al. Effect of increasing baseline immunosuppression on the prevalence of clinical and subclinical rejection: a pilot study. J Am Soc Nephrol. 1999;10:1801–1805. [DOI] [PubMed] [Google Scholar]
- 19.Rush D, Arlen D, Boucher A, et al. Lack of benefit of early protocol biopsies in renal transplant patients receiving TAC and MMF: a randomized study. Am J Transplant. 2007;7:2538–2545. [DOI] [PubMed] [Google Scholar]
- 20.Roberts IS, Stratopoulos C, Zilvetti M, et al. Impact of immunosuppression on the incidence of early subclinical renal allograft rejection: implications for protocol biopsy policy. Transpl Int. 2009;22:831–836. [DOI] [PubMed] [Google Scholar]
- 21.Moreso F, Ibernon M, Goma M, et al. Subclinical rejection associated with chronic allograft nephropathy in protocol biopsies as a risk factor for late graft loss. Am J Transplant. 2006;6:747–752. [DOI] [PubMed] [Google Scholar]
- 22.Thierry A, Thervet E, Vuiblet V, et al. Long-term impact of subclinical inflammation diagnosed by protocol biopsy one year after renal transplantation. Am J Transplant. 2011;11:2153–2161. [DOI] [PubMed] [Google Scholar]
- 23.Kaplan B, Schold JD, Meier-Kriesche HU. Long-term graft survival with neoral and tacrolimus: a paired kidney analysis. J Am Soc Nephrol. 2003;14:2980–2984. [DOI] [PubMed] [Google Scholar]
- 24.Kapturczak MH, Meier-Kriesche HU, Kaplan B. Pharmacology of calcineurin antagonists. Transplant Proc. 2004;36(Suppl 2):25S–32S. [DOI] [PubMed] [Google Scholar]
- 25.Shapiro R, Young JB, Milford EL, et al. Immunosuppression: evolution in practice and trends, 1993–2003. Am J Transplant. 2005;5(4 Pt 2):874–886. [DOI] [PubMed] [Google Scholar]
- 26.Meier-Kriesche HU, Steffen BJ, Chu AH, et al. Sirolimus with neoral versus mycophenolate mofetil with neoral is associated with decreased renal allograft survival. Am J Transplant. 2004;4:2058–2066. [DOI] [PubMed] [Google Scholar]
- 27.Meier-Kriesche HU, Schold JD, Srinivas TR, et al. Sirolimus in combination with tacrolimus is associated with worse renal allograft survival compared to mycophenolate mofetil combined with tacrolimus. Am J Transplant. 2005;5:2273–2280. [DOI] [PubMed] [Google Scholar]
- 28.Chhabra D, Skaro AI, Leventhal JR, et al. Long-term kidney allograft function and survival in prednisone-free regimens: tacrolimus/mycophenolate mofetil versus tacrolimus/sirolimus. Clin J Am Soc Nephrol. 2012;7:504–512. [DOI] [PMC free article] [PubMed] [Google Scholar]
- 29.Vitko S, Margreiter R, Weimar W, et al. Everolimus (certican) 12-month safety and efficacy versus mycophenolate mofetil in de novo renal transplant recipients. Transplantation. 2004;78:1532–1540. [DOI] [PubMed] [Google Scholar]
- 30.Cibrik D, Silva HT, Jr, Vathsala A, et al. Randomized trial of everolimus-facilitated calcineurin inhibitor minimization over 24 months in renal transplantation. Transplantation. 2013;95:933–942. [DOI] [PubMed] [Google Scholar]
- 31.Claes K, Meier-Kriesche HU, Schold JD, et al. Effect of different immunosuppressive regimens on the evolution of distinct metabolic parameters: evidence from the symphony study. Nephrol Dial Transplant. 2012;27:850–857. [DOI] [PubMed] [Google Scholar]
- 32.Ekberg H, van Gelder T, Kaplan B, et al. Relationship of tacrolimus exposure and mycophenolate mofetil dose with renal function after renal transplantation. Transplantation. 2011;92:82–87. [DOI] [PubMed] [Google Scholar]
- 33.Shihab FS, Olyaei A, Wiland A, et al. Tacrolimus exposure in the real world: an analysis from the mycophenolic acid observational renal transplant study. Clin Transplant. 2014;28:768–775. [DOI] [PubMed] [Google Scholar]
- 34.Mozaffarian D, Benjamin EJ, Go AS, et al. Heart disease and stroke statistics—2015 update: a report from the American Heart Association. Circulation. 2015;131:e29–e322. [DOI] [PubMed] [Google Scholar]
- 35.Gu A, Yue Y, Argulian E. Age differences in treatment and control of hypertension in US Physician Offices, 2003–2010: a serial cross-sectional study. Am J Med. 2016;129:50–58.e4. [DOI] [PubMed] [Google Scholar]
- 36.Yoon SS, Gu Q, Nwankwo T, et al. Trends in blood pressure among adults with hypertension: United States, 2003 to 2012. Hypertension. 2015;65:54–61. [DOI] [PMC free article] [PubMed] [Google Scholar]
- 37.Hirsch HH, Brennan DC, Drachenberg CB, et al. Polyomavirus-associated nephropathy in renal transplantation: interdisciplinary analyses and recommendations. Transplantation. 2005;79:1277–1286. [DOI] [PubMed] [Google Scholar]
- 38.Hardinger KL, Koch MJ, Bohl DJ, et al. BK-virus and the impact of pre-emptive immunosuppression reduction: 5-year results. Am J Transplant. 2010;10:407–415. [DOI] [PMC free article] [PubMed] [Google Scholar]
- 39.Ramos E, Drachenberg CB, Papadimitriou JC, et al. Clinical course of polyoma virus nephropathy in 67 renal transplant patients. J Am Soc Nephrol. 2002;13:2145–2151. [DOI] [PubMed] [Google Scholar]
- 40.Saad ER, Bresnahan BA, Cohen EP, et al. Successful treatment of BK viremia using reduction in immunosuppression without antiviral therapy. Transplantation. 2008;85:850–854. [DOI] [PubMed] [Google Scholar]
- 41.Sood P, Senanayake S, Sujeet K, et al. Management and outcome of BK viremia in renal transplant recipients: a prospective single-center study. Transplantation. 2012;94:814–821. [DOI] [PubMed] [Google Scholar]
- 42.Brennan DC. Cytomegalovirus in renal transplantation. J Am Soc Nephrol. 2001;12:848–855. [DOI] [PubMed] [Google Scholar]
- 43.Johnson RJ, Clatworthy MR, Birch R, et al. CMV mismatch does not affect patient and graft survival in UK renal transplant recipients. Transplantation. 2009;88:77–82. [DOI] [PubMed] [Google Scholar]
- 44.Kuo HT, Ye X, Sampaio MS, et al. Cytomegalovirus serostatus pairing and deceased donor kidney transplant outcomes in adult recipients with antiviral prophylaxis. Transplantation. 2010;90:1091–1098. [DOI] [PubMed] [Google Scholar]
- 45.Vincenti F, Rostaing L, Grinyo J, et al. Belatacept and long-term outcomes in kidney transplantation. N Engl J Med. 2016;374:333–343. [DOI] [PubMed] [Google Scholar]
- 46.Vincenti F, Charpentier B, Vanrenterghem Y, et al. A phase III study of belatacept-based immunosuppression regimens versus cyclosporine in renal transplant recipients (BENEFIT study). Am J Transplant. 2010;10:535–546. [DOI] [PubMed] [Google Scholar]
- 47.Durrbach A, Pestana JM, Pearson T, et al. A phase III study of belatacept versus cyclosporine in kidney transplants from extended criteria donors (BENEFIT-EXT study). Am J Transplant. 2010;10:547–557. [DOI] [PubMed] [Google Scholar]
- 48.Durrbach A, Pestana JM, Florman S, et al. Long-term outcomes in belatacept- versus cyclosporine-treated recipients of extended criteria donor kidneys: final results from BENEFIT-EXT, a phase III randomized study. Am J Transplant. 2016;16:3192–3201. [DOI] [PMC free article] [PubMed] [Google Scholar]
- 49.Gaston RS, Cecka JM, Kasiske BL, et al. Evidence for antibody-mediated injury as a major determinant of late kidney allograft failure. Transplantation. 2010;90:68–74. [DOI] [PubMed] [Google Scholar]
Associated Data
This section collects any data citations, data availability statements, or supplementary materials included in this article.


