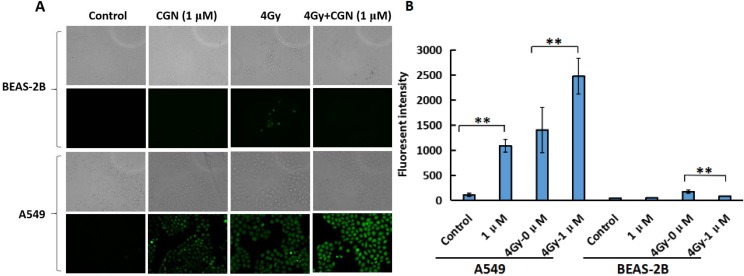
Figure 5. CGN treatment aggravates the oxidative stress and oxidative damage induced by radiation in A549 cells.
The exponential grown BEAS-2B (upper) and A549 (lower) cells were pretreated with CGN for 24 h and then followed by X-ray irradiation. The intracellular ROS levels were determined by means of fluorescent intensity of DCFH-DA-stained IECs assay. The images are shown as the representative from three independent experiments. The upper shows the images taken under the bright phase-contrast microscope and the lower shows the images taken under the fluorescent microscope (×10) in each group (A). Fluorescence intensity were quantified using ImageJ software (B). One hundred cells were quantified to determine the average fluorescence intensity. **P < 0.01 vs. X-ray irradiation alone.

