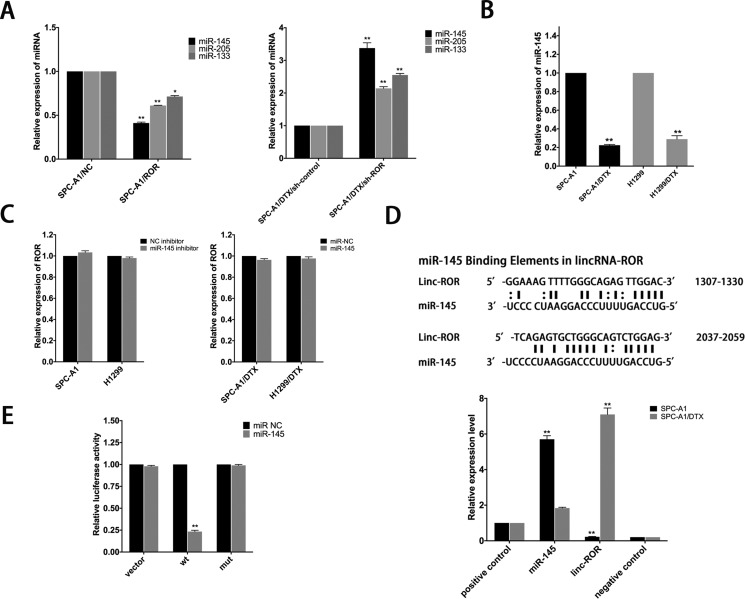
Figure 4. MiR-145 is a target of linc-ROR.
(A) Effect of dysregulated linc-ROR expression on the level of miR-145, miR-205 and miR-133 was measured by qRT-PCR. (B) QRT-PCR analysis of the expression level of miR-145 in parental and docetaxel-resistant LAD cells. (C) qRT-PCR was employed to detect the effect on linc-ROR level after ectopic expression or knockdown of miR-145. (D) Bioinformatics predicted miR-145 binding sites at two distinct positions in linc-ROR. RIP assay to detect the association between linc-ROR and miR-145 in SPC-A1 and SPC-A1/DTX cells. The positive and negative controls refer to U1 and IgG, respectively. (E) Luciferase activity in SPC-A1 cells co-transfected with miR-145 and luciferase reporters containing no insert, linc-ROR, or mutant linc-ROR. Data are presented as the relative ratio of firefly luciferase activity to Renilla luciferase activity. Error bars represent the mean ± SEM of at least three independent experiments. *p < 0.05, **p < 0.01 vs. control group.

