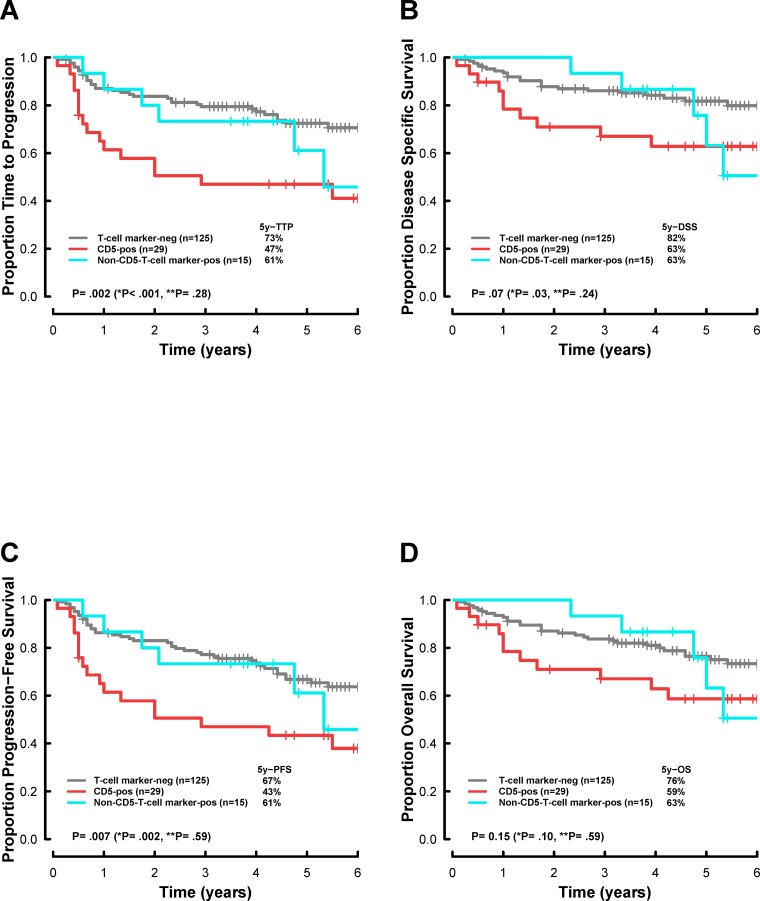
Figure 3. Survival analysis, according to T-cell marker status, in patients with newly diagnosed diffuse large B-cell lymphoma (DLBCL), treated with rituximab plus cyclophosphamide, doxorubicin, vincristine, and prednisone (R-CHOP)-based chemotherapy.
Kaplan-Meier curves represent (A) the time to progression (TTP), (B) disease-specific survival (DSS), (C) progression-free survival (PFS), and (D) overall survival (OS). T-cell marker-neg, T-cell marker-negative DLBCL; CD5-pos, CD5-positive DLBCL; Non-CD5-T-cell marker-pos, Non-CD5-T-cell marker-positive DLBCL. *P, CD5-pos vs. T-cell marker-neg; **P, Non-CD5-T-cell marker-pos vs. T-cell marker-neg. P values less than 0.05 were considered statistically significant.

