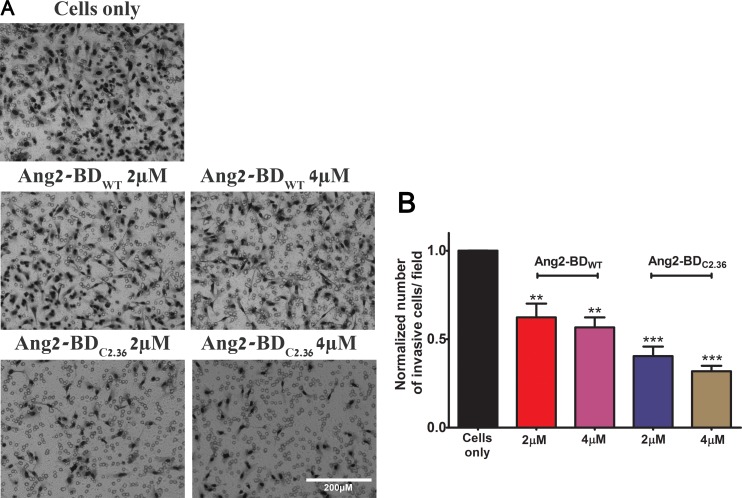
Figure 6. Inhibition of endothelial cells invasiveness by Ang2-BD variants.
(A) TIME cells were treated with indicated proteins in Boyden chambers. (B) Control buffer (cells only, black), 2 μM and 4 μM Ang2-BDWT (red and pink, respectively), 2 μM and 4 μM Ang2-BDC2.36 (blue and brown, respectively). The invading cells accumulated on the bottom of membrane were counted in 16 frames for each membrane and analyzed for the number of cells. *indicates P value < 0.05 for comparison of results between cells only and cells + tested proteins. Data shown is the average of triplicate experiments, and error bars represent standard error of the mean. Scale bar, 200 μm.

